2496
A Dedicated Protocol for Fat Fraction Mapping in Obese Patients: Preliminary Findings in Skeletal Muscle1Centre for Medical Imaging, University College London, London, United Kingdom, 2Department of Medical Physics, University College London Hospital, London, United Kingdom, 3Centre for Obesity Research, University College London, London, United Kingdom
Synopsis
Obesity is associated with ectopic fat deposition and chronic inflammation in skeletal muscle (SM), which contributes to insulin resistance. Novel treatments for obesity such as bariatric surgery can reduce insulin resistance by reducing ectopic fat deposition, but this effect is inconsistent and poorly understood. Therefore, we need a fast, non-invasive method that can help to study the link between ectopic fat deposition and insulin resistance. Here, we describe a protocol for scanning obese patients, which is fast, tolerable and accurate, and reveals significant changes in SM proton density fat fraction (PDFF) in obese patients.
Introduction
Obesity (Body Mass Index [BMI]≥30)1 is a major global and economic public health challenge. Almost 30% of the global population is overweight or obese2 and the prevalence of both obesity and related conditions, such as type 2 diabetes mellitus (T2DM) and cardiovascular disease, is increasing3.
Novel treatments for obesity such as bariatric surgery can reduce insulin resistance by reducing ectopic fat deposition, but this effect is inconsistent and poorly understood. For example, it is unclear which ectopic fat depot (including liver, pancreas and muscle) is most important, and why some patients fail to respond despite losing weight. Recent studies have highlighted the potential importance of skeletal muscle (SM) fat, which is associated with chronic inflammation and contributes to insulin resistance and T2DM4. Indeed, some authors have postulated that SM insulin resistance is the primary defect in T2DM5, although this hypothesis remains unproven. In order to further investigate the link between SM fat and insulin resistance, we need a tool that can quickly, noninvasively and accurately enable us to measure fat infiltration in multiple muscles.
The aim of this pilot study was to a) develop a fast, tolerable and accurate MRI protocol to quantify musculoskeletal fat in obese patients, b) compare musculoskeletal fat fraction (FF) between obese and control groups, and c) to inform sample size calculations for a larger prospective study investigating the role of SM fat in T2DM.
Methods
A dedicated protocol (Fig 1b) for imaging obese patients was developed on a wide-bore Philips Ingenia 3T system, consisting of a vendor-supplied six-echo spoiled gradient echo acquisition with bipolar readout gradients. Proton density fat fraction (PDFF) calculation was performed in-line (mDixon Quant) using a complex model for fat composition and correction for R2* decay. To assess the accuracy of PDFF measurements, the protocol was first used to image a specifically-designed phantom consisting of known concentrations of lard and 3% w/v agar solution, covering the full range of PDFF values at 10% increments (Fig 2a, b, c). The same protocol was used to scan two groups of subjects - seven patients with obesity (BMI≥30) who had been referred to the weight-management service at a tertiary referral centre and assessed for abdominal diameter using a dedicated sizing hoop (Fig 1a) and eight control volunteers (BMI <30). Coverage consisted of five contiguous anatomical stations (from the dome of the liver to mid-thigh), analogous to an abbreviated whole body MRI protocol (Figure 1c). Total acquisition time was approximately 25 minutes per subject.
For the phantom, circular regions-of-interest (ROIs) were placed on PDFF maps for each tube, and measured PDFF values were compared with reference FF values using linear regression. A two-sided t-test was used to determine whether there was a statistically significant difference between the obtained slope value and 1.0, and the obtained intercept value and 0 (∝=0.05). For each subject (Figure 3a), freehand regions of interest (ROIs) were placed on the gluteus maximus, gluteus medius, rectus abdominis and psoas muscles. As a comparison, ROIs were also placed on two areas of trabecular bone (both sacral alae and L5 vertebral body). For each pair of muscles, mean PDFF values were compared between obese and control groups using the Mann-Whitney-Wilcoxon test.
Results and Discusssion
The fat-water phantom was constructed and scanned; results are shown in Figure 2. Estimated PDFF slope and intercept values did not vary significantly from 1 and 0 respectively, suggesting that measured PDFF measurements accurately reflected reference FF values over the full range (0-100%).
The scan protocol was found tolerable and fully completed in each subject. Example PDFF maps for obese patients and controls are shown in Figure 3. Muscle PDFF values (Figure 4) were significantly higher in obese patients compared to controls for gluteus maximus (p=0.0003), gluteus medius (p=0.0006), rectus abdominis (p=0.02) and psoas (p=0.01). There was no significant difference in PDFF values of bone measured at the two sites between the groups (L5 vertebral body p=0.1; mean sacral alae p=0.1).
Conclusion
SM PDFF values are significantly increased in obese patients compared to controls, suggesting that larger scale studies of the role of SM fat in obesity are warranted. PDFF measurements are fast, non-invasive and can measure the TOTAL fat composition in muscles, unlike muscle biopsy.
In order to gain further understanding of the link between SM fat and insulin resistance, we plan to scan patients before and after bariatric surgery and to assess the relationship between changes in SM PDFF and glucose homeostasis. Estimates of the variance of PDFF measurements will be used to inform sample size calculations for this study.
Acknowledgements
This work was undertaken at UCLH/UCL, which receives funding from the Department of Health’s NIHR Biomedical Research Centre funding scheme. The views expressed in this publication are those of the authors and not necessarily those of the UK Department of Health.References
1. Obesity: identification, assessment and management | Guidance and guidelines | NICE.
2. Dobbs, R. et al. Overcoming obesity : An initial economic analysis. McKinsey Global Institute (2014).
3. Poirier, P. et al. Obesity and Cardiovascular Disease: Pathophysiology, Evaluation, and Effect of Weight Loss: An Update of the 1997 American Heart Association Scientific Statement on Obesity and Heart Disease From the Obesity Committee of the Council on Nutrition, Physical Activity, and Metabolism. Circulation 113, 898–918 (2006).
4. Wu, H. & Ballantyne, C. M. Skeletal muscle inflammation and insulin resistance in obesity. J. Clin. Invest. 127, 43–54 (2017).
5. DeFronzo, R. A. & Tripathy, D. Skeletal Muscle Insulin Resistance Is the Primary Defect in Type 2 Diabetes. Diabetes Care 32, S157–S163 (2009).
Figures
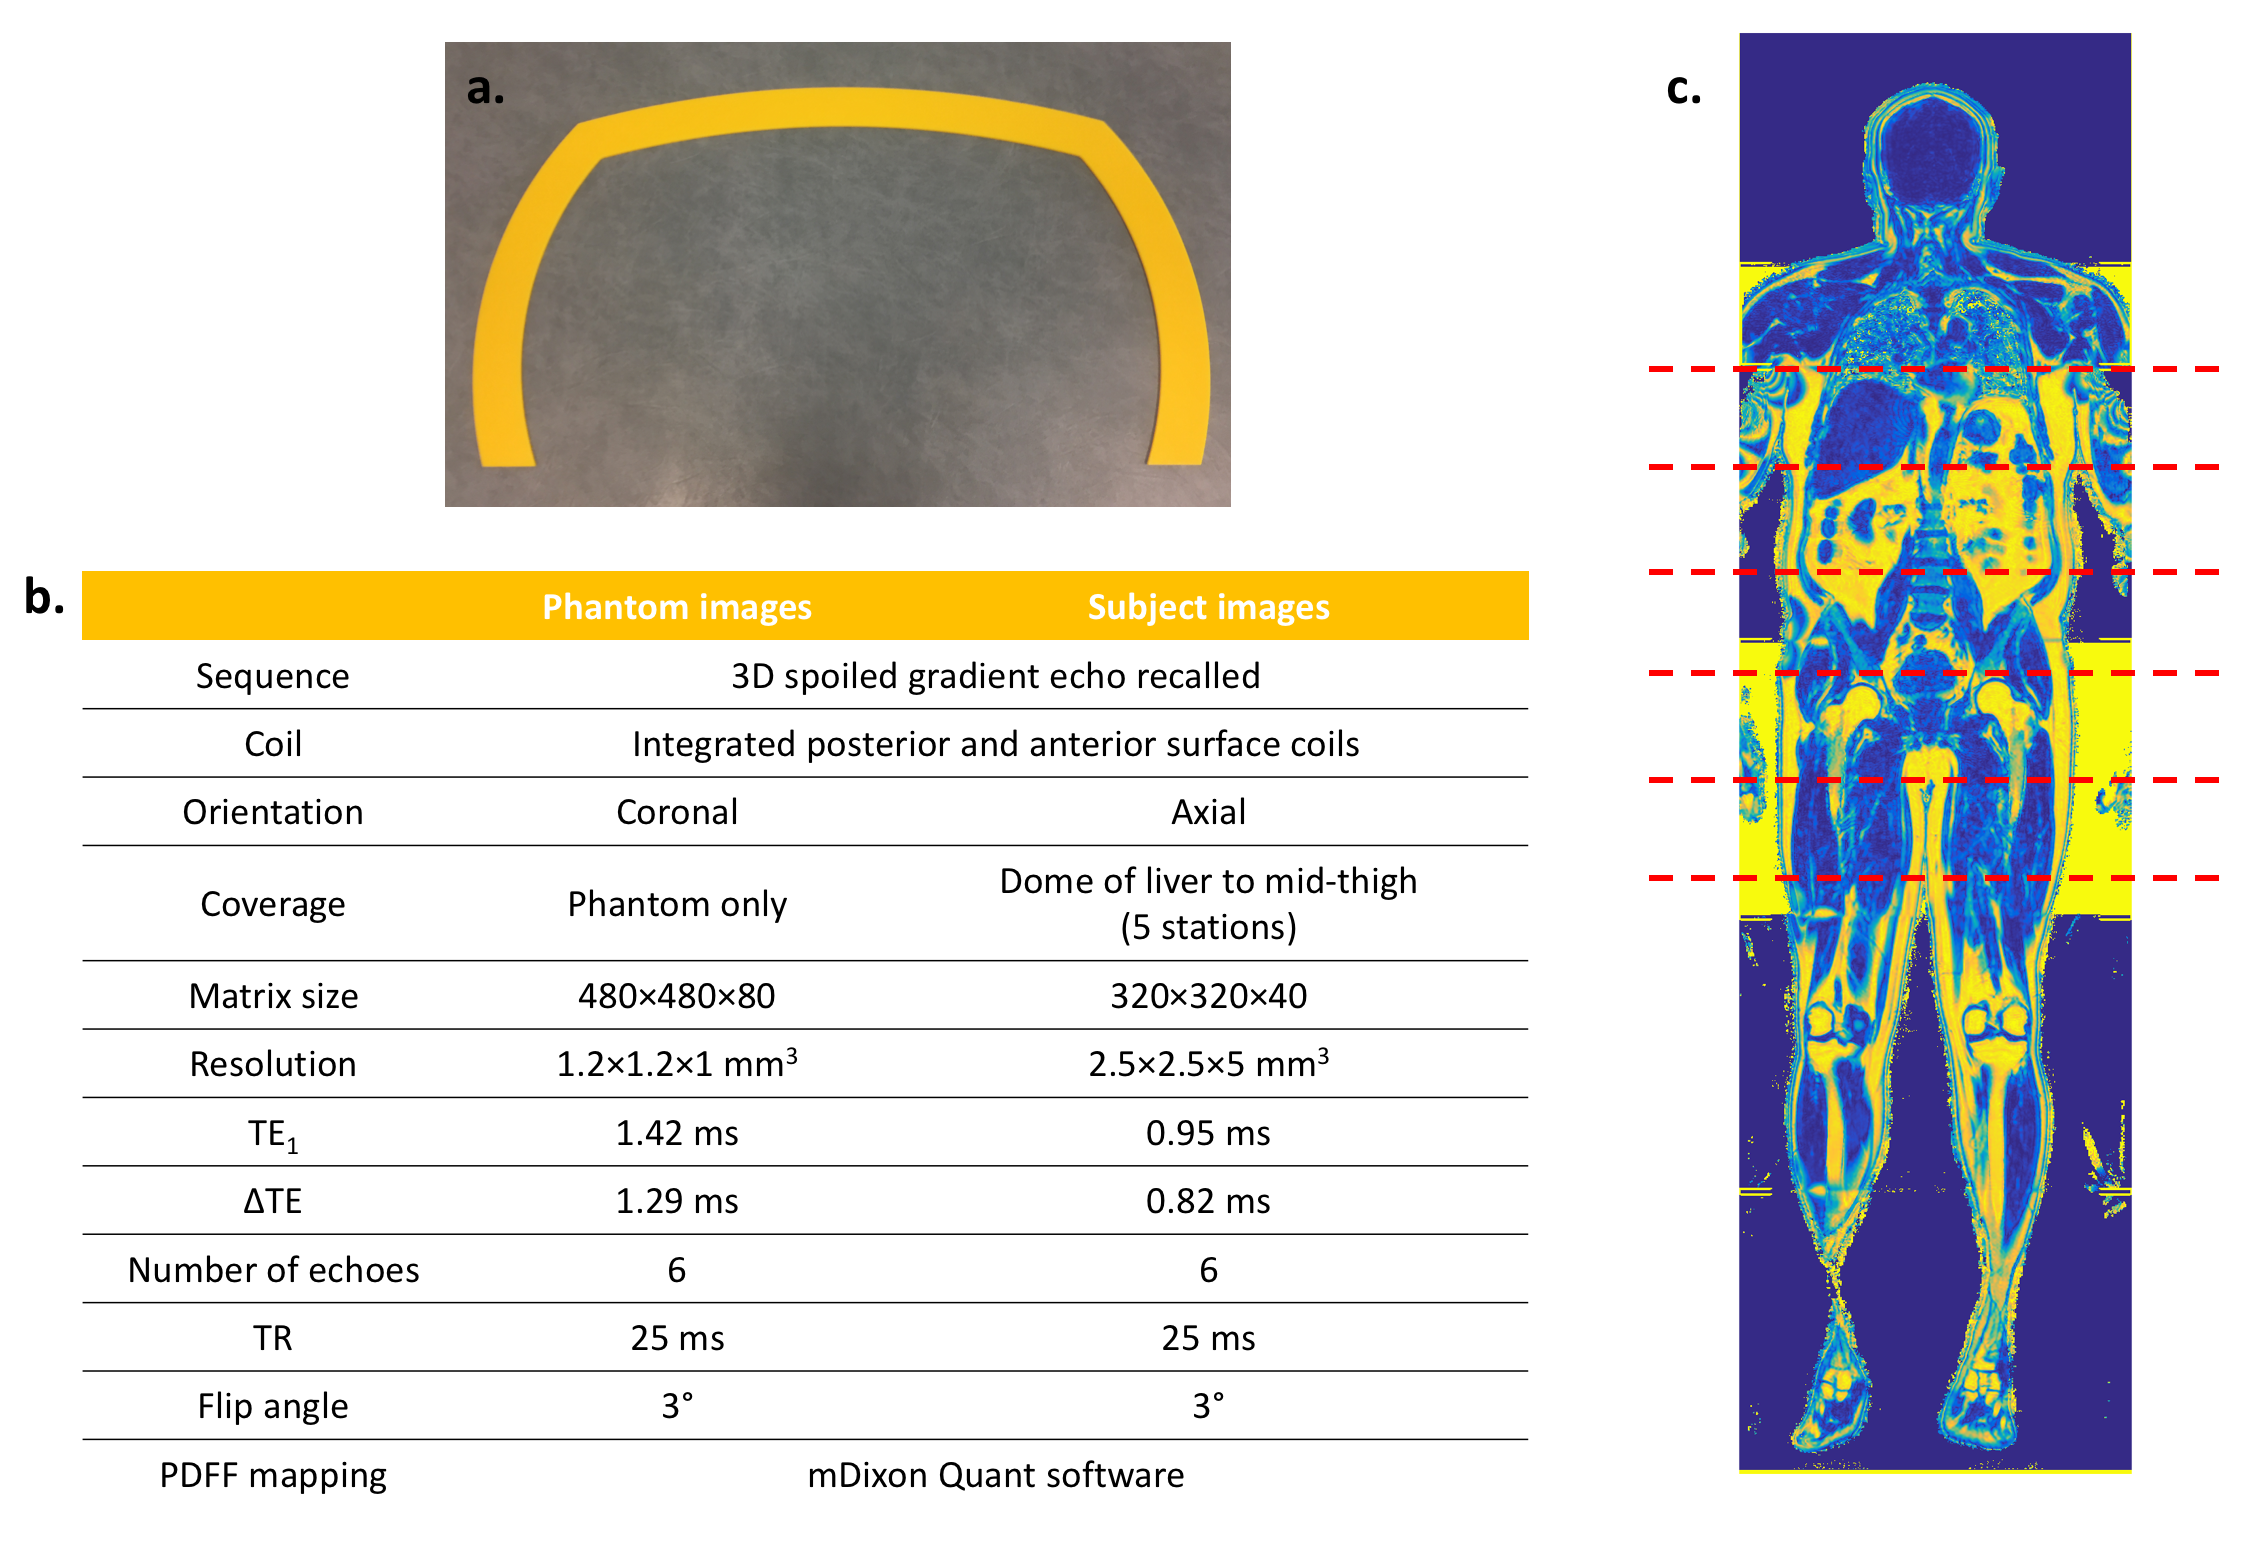
Figure 1
a. Sizing hoop
b. MRI acquisition parameters
c. Coronal PDFF map – the 5 anatomical imaging stations are represented by dashed lines
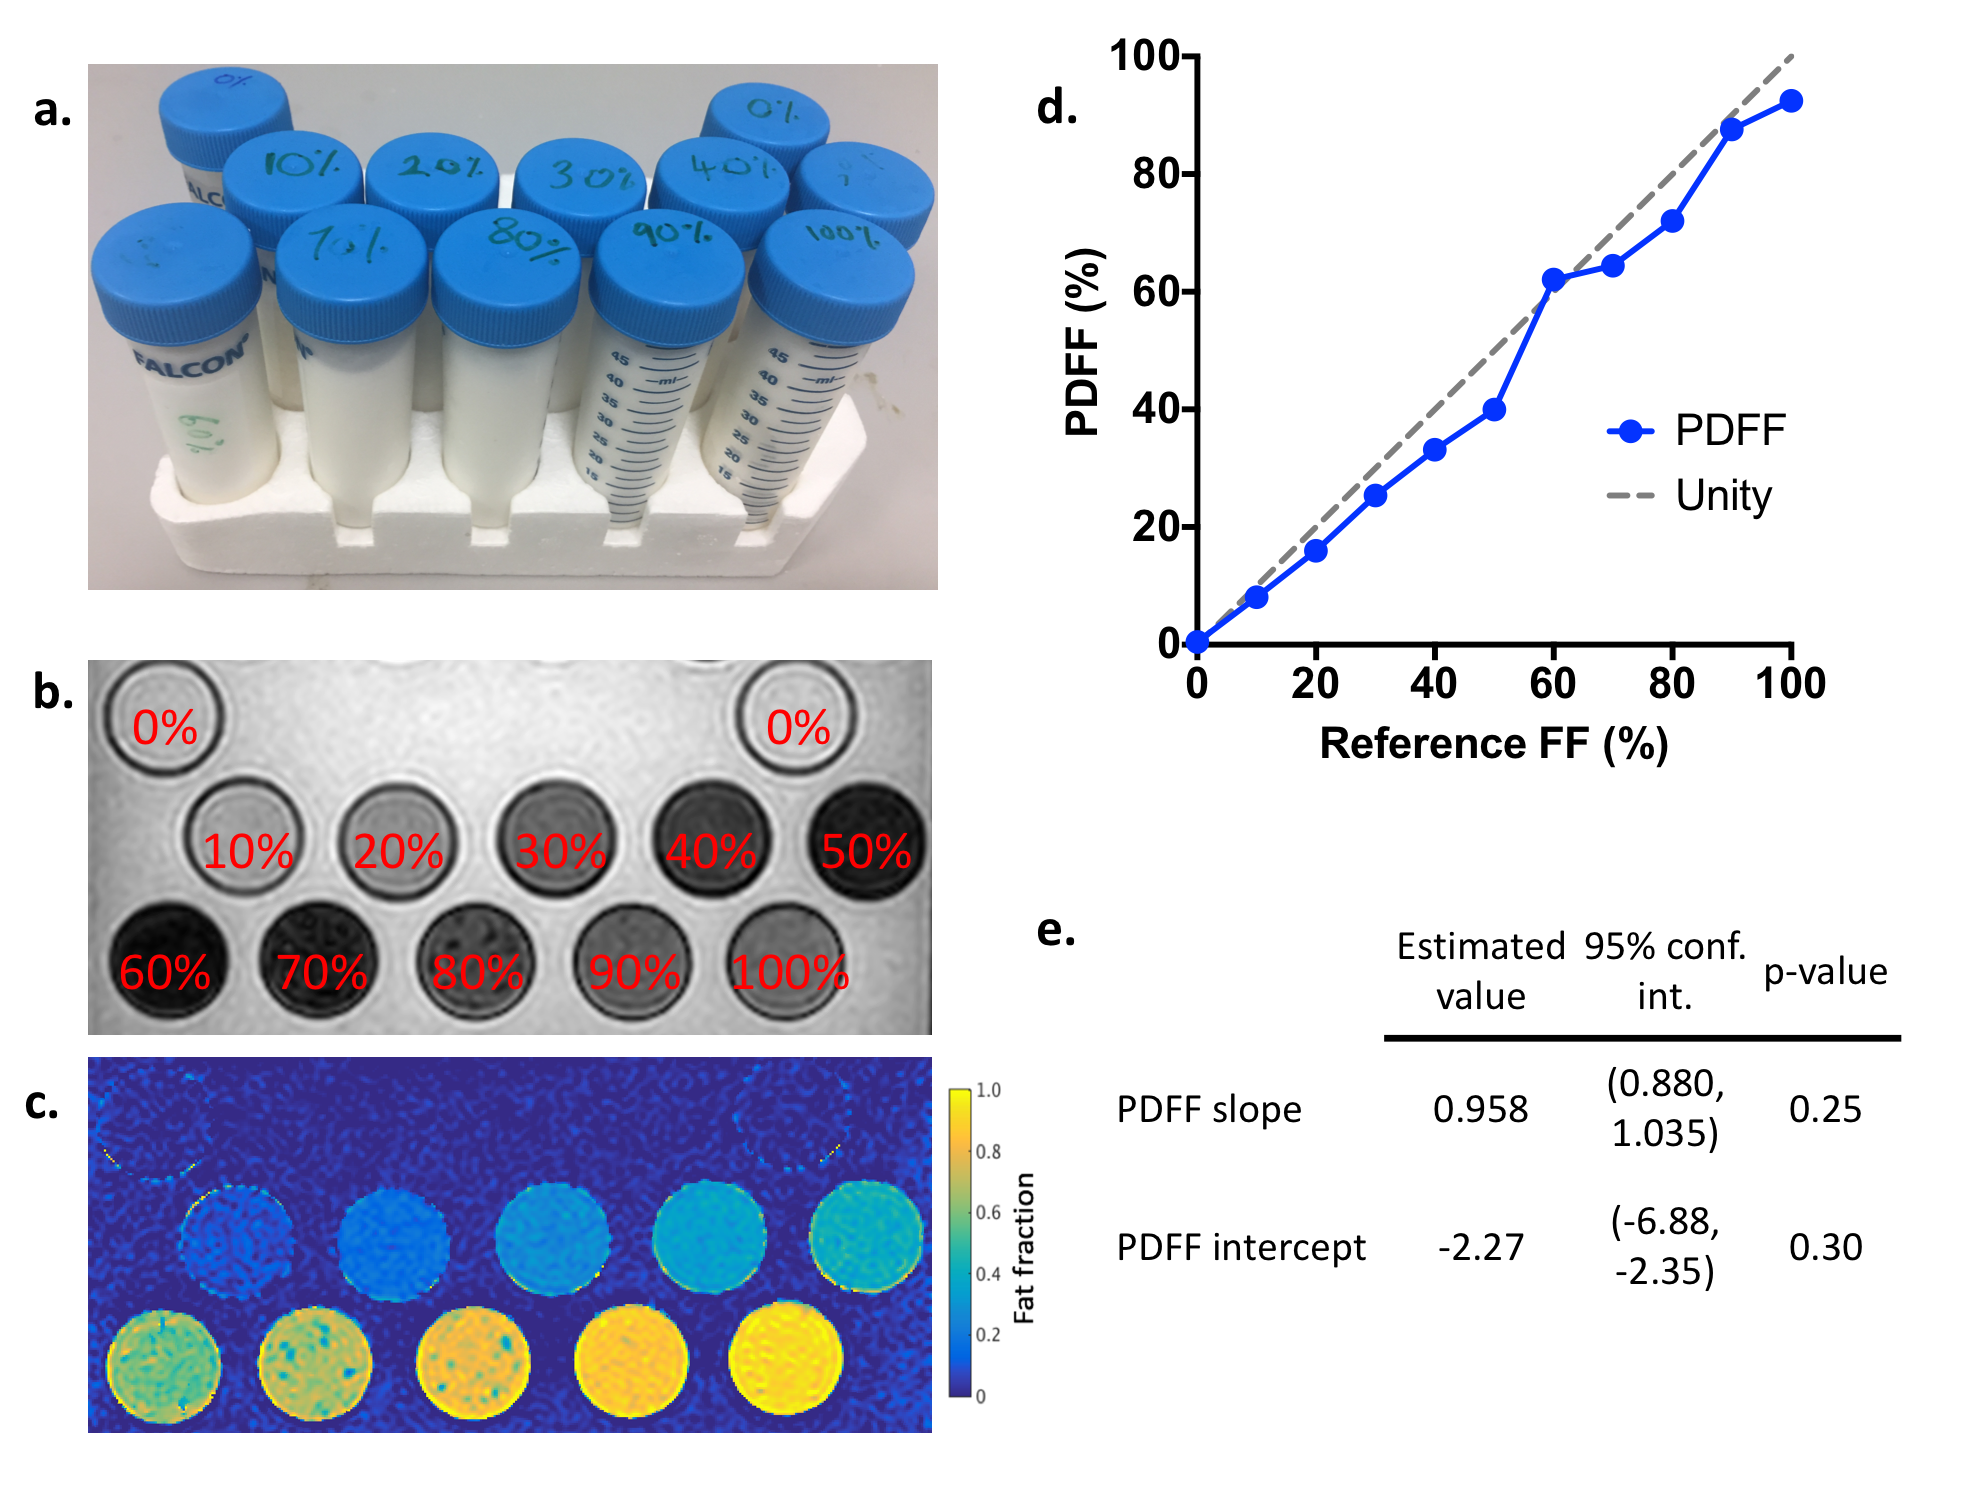
Figure 2
a. Photograph of the fat-water phantom – tubes with 10% increments of fat content from 0-100%
b. Magnitude images (first echo) of fat-water phantom
c. PDFF maps from fat-water phantom
d. Plot of measured PDFF values against reference FF values.
e. Results of linear regression of measured PDFF values in the phantom compared with reference FF
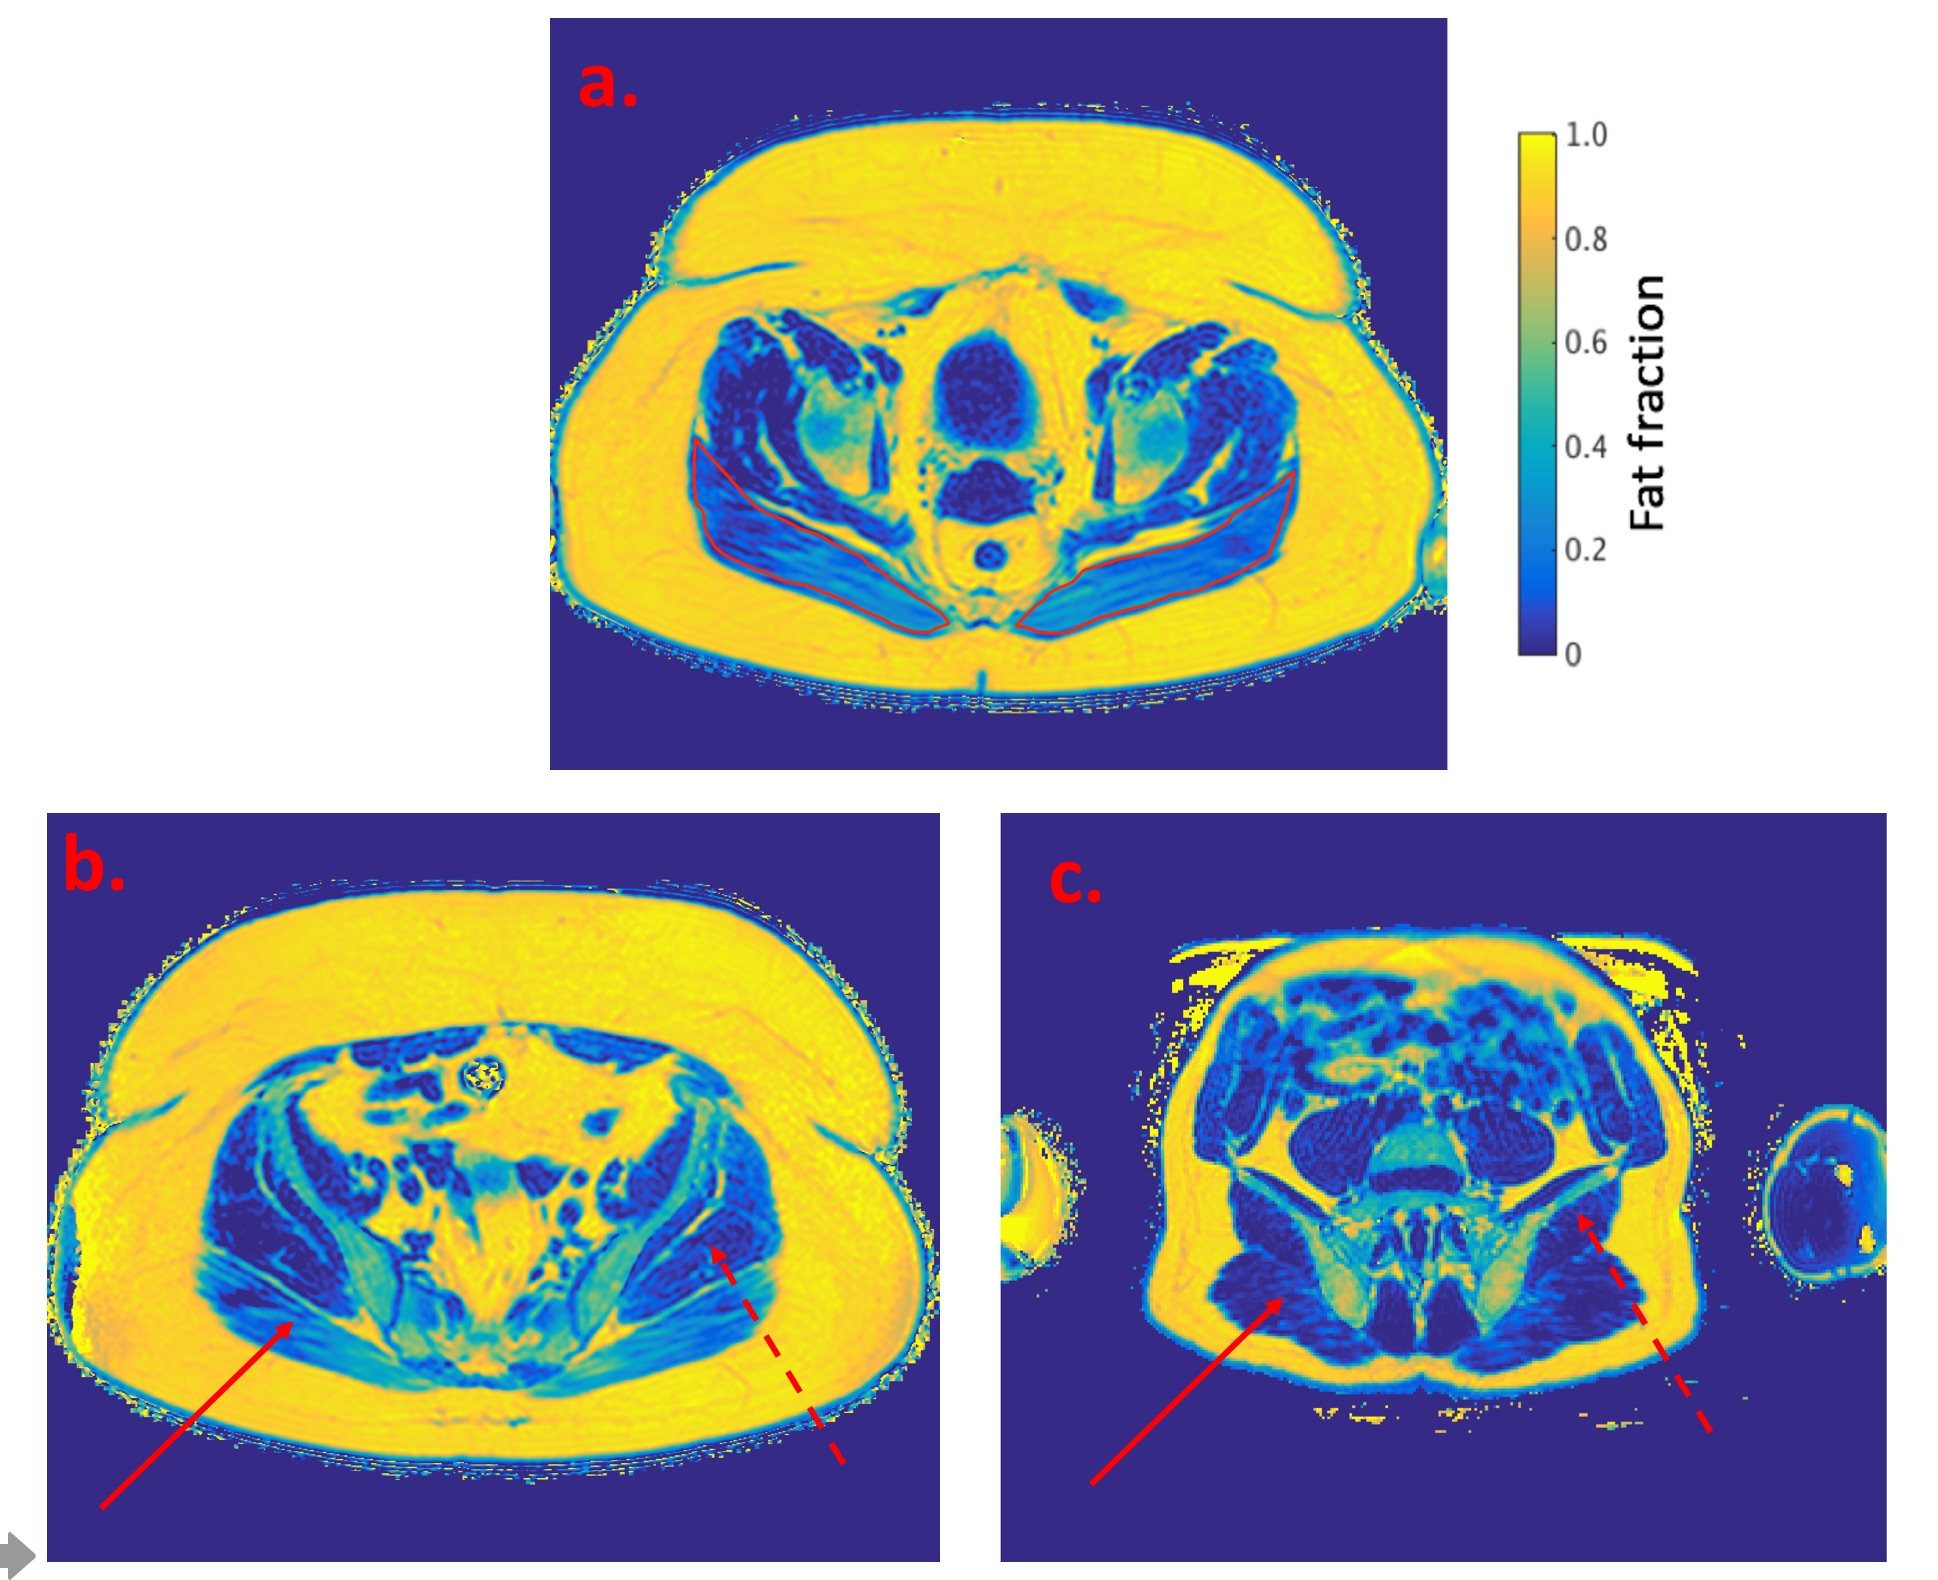
Figure 3
PDFF maps:
a. Obese patient – red lines represent ROI around the gluteus maximus muscles
b. Obese patient
c. Control
Solid line = right gluteus maximus muscle
Dashed line = left gluteus medium muscle
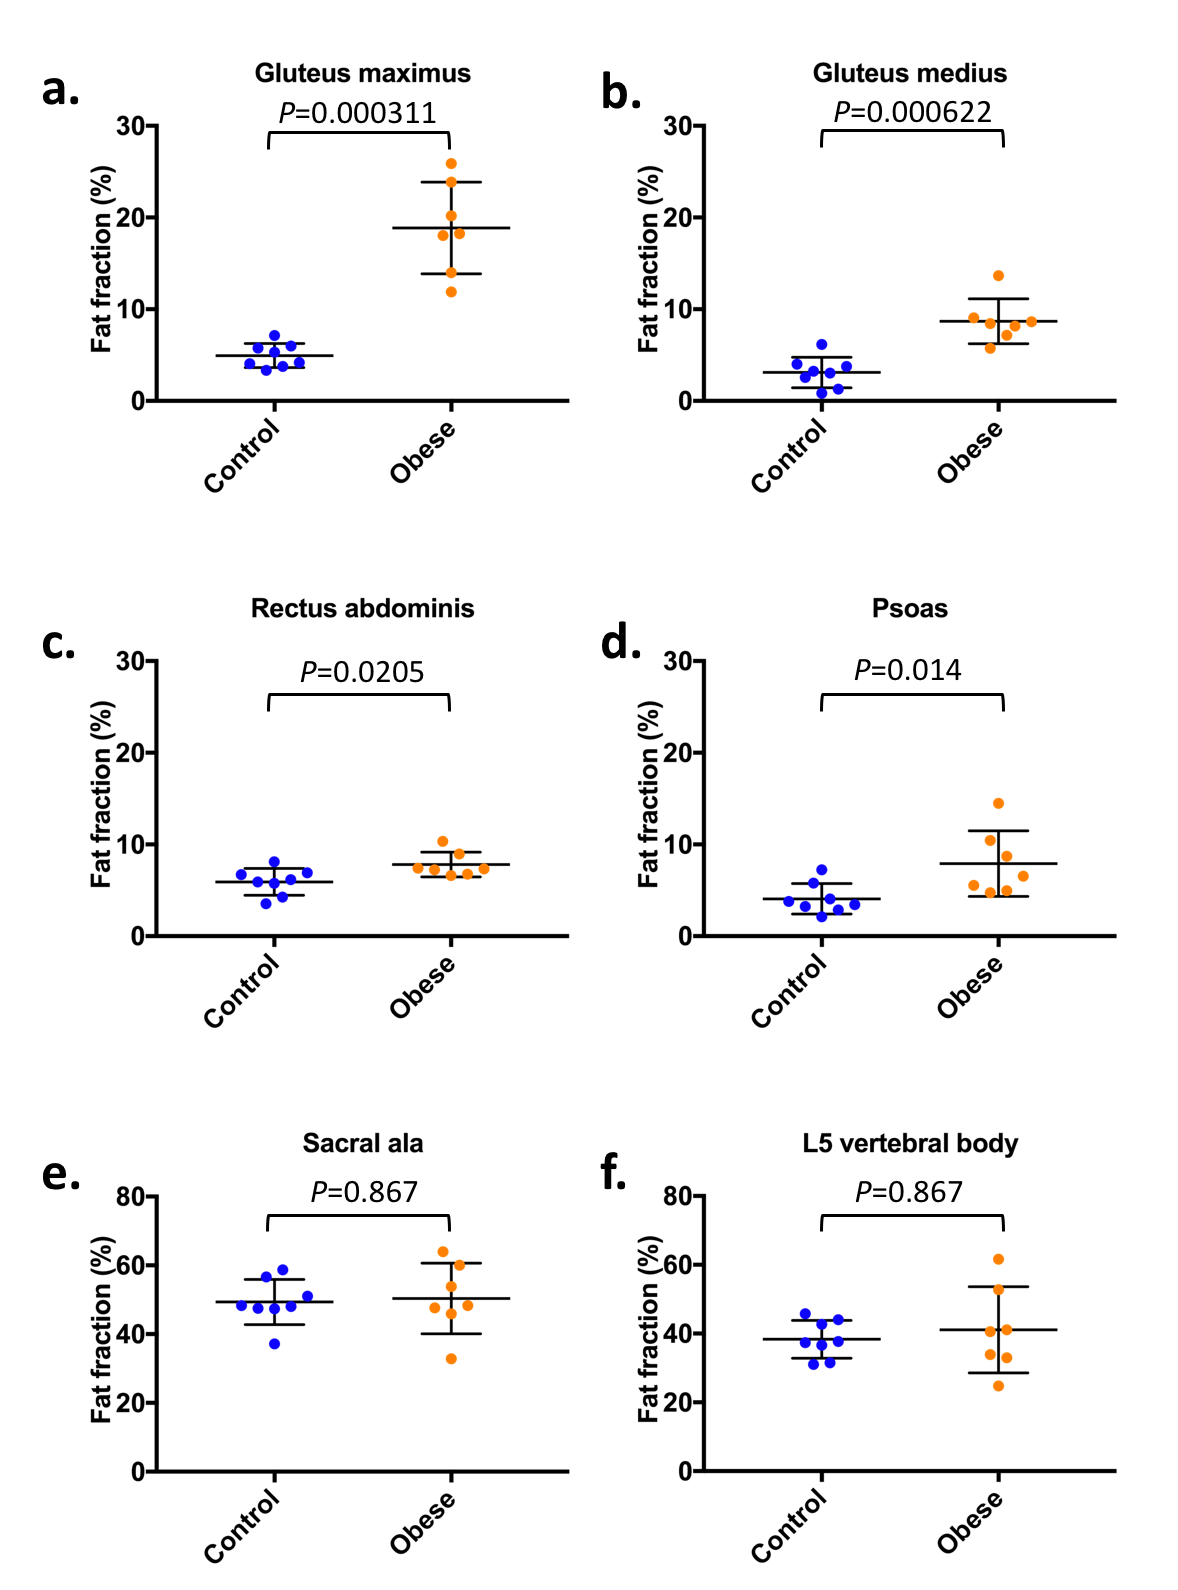
Figure 4
Comparison of muscle and bone PDFF values in controls and obese patients:
a. Gluteus maximus
b. Gluteus medius
c. Rectus abdominis
d. Psoas
e. Sacral alae
f. L5 vertebral body