2495
R1rho dispersion in human kidney1Radiology and Radiological Sciences, Vanderbilt University Institute of Imaging Science, Nashville, TN, United States
Synopsis
R1ρ (=1/T1ρ) imaging has been applied in many human organs to characterize tissue biochemical changes. However, R1ρ imaging in human kidney has been rarely reported partly due to the challenges associated with field inhomogeneities and respiratory motion. We developed an R1ρ imaging protocol for human kidney which used adiabatic half passage pulse and volume shimming to overcome field inhomogeneities. In addition, R1ρ dispersion was evaluated via a simple method with a fixed locking time but different locking frequencies. The volunteer scans exhibited characterized R1ρ maps in kidney, also there was greater R1ρ dispersion between locking frequencies of 100Hz and 300Hz.
Introduction
R1ρ (=1/T1ρ) is sensitive to slow macromolecular interactions and has been used to evaluate biochemical changes in many biological tissues. R1ρ variations with spin-locking fields, termed as R1ρ dispersion, provides more complete information of the system chemical and diffusive exchange. 1-3 Recent study showed that R1ρ dispersion (represented by the R1ρ difference between low and high locking fields) may be relevant to tissue fibrosis in human skeletal muscles associated with aging. 4 R1ρ imaging in human kidney is very rare, partially because of the field inhomogeneities and respiratory motion that often lead to significant artifacts. The purpose of this study was to develop quantitative R1ρ (and R1ρ dispersion) imaging for human kidney aiming to characterize biochemical changes (for instance fibrosis) in kidney diseases.Methods
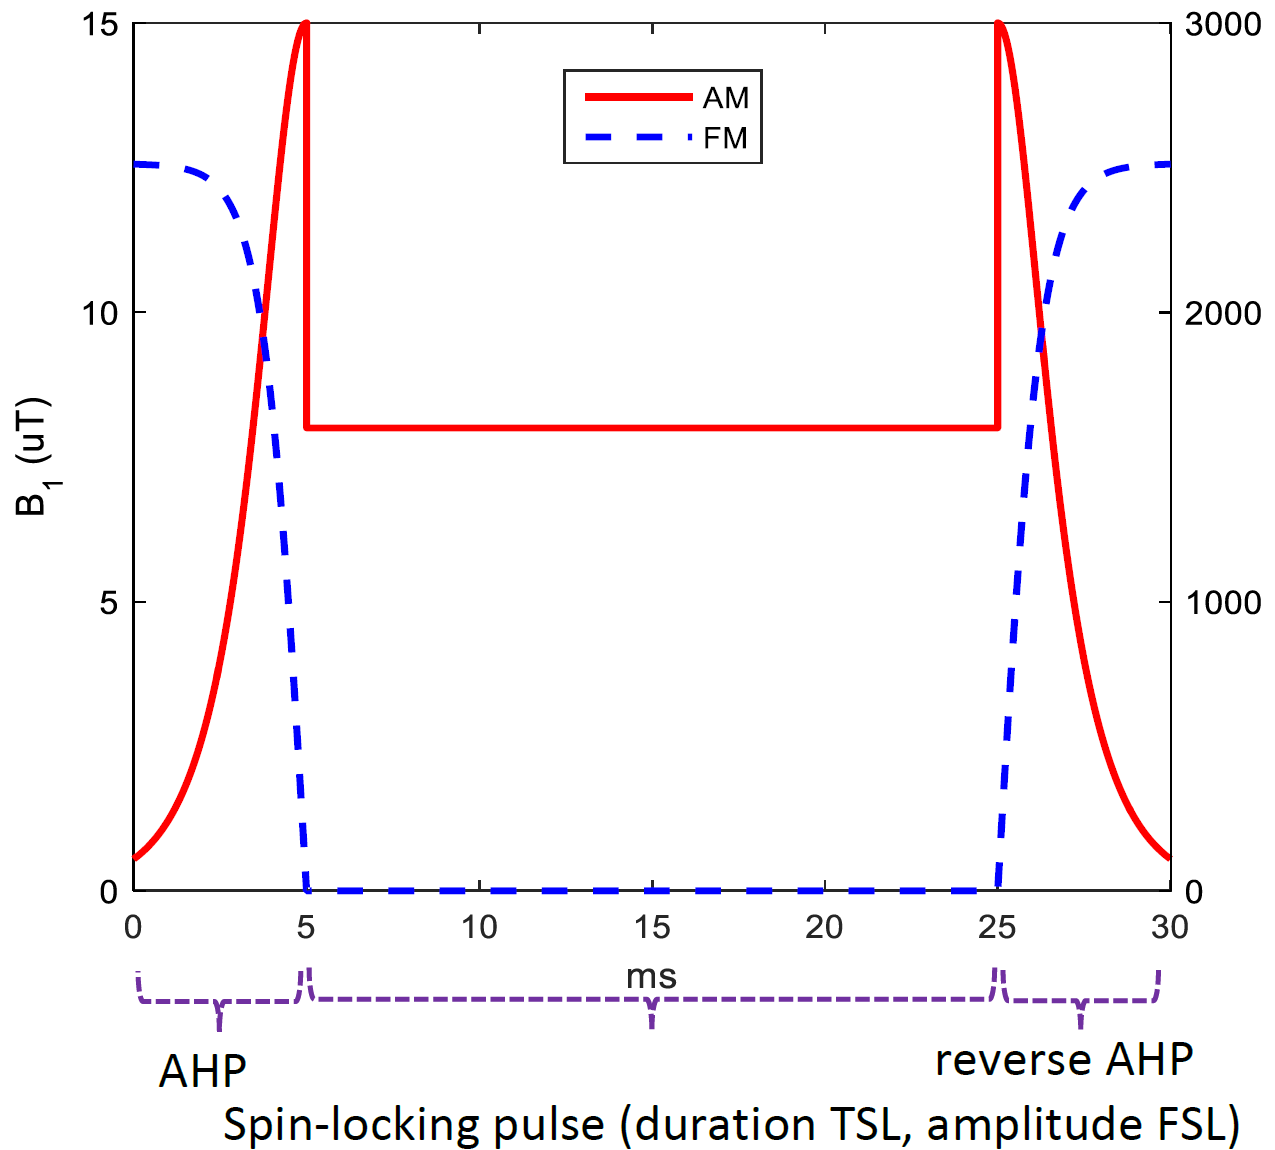
The study was conducted on a Philips 3T Achieva scanner (Philips Healthcare, Best, the Netherlands) and two volunteers were tested by a 16-channel torso coil (Philips Healthcare) with breathhold (duration: 21s) to control respiration motion. R1ρ imaging was performed with an adiabatic half passage (AHP) based on Hyperbolic Secant functions (Figure 1) combined with volume shimming to overcome field inhomogeneities. Other parameters: FOV = 322x378mm2, pixel size = 2x2mm2, single slice was acquired at a thickness of 4mm, spin-locking time (TSL) = [1, 21, 41, 61]ms, spin-locking frequency (FSL) = 300Hz. TSE (turbo spin echo) sequence was used for data acquisition, with TR/TE = 3000ms/10ms, TSE factor = 15 (low-high profile), fat suppression (SPAIR) was applied, and SENSE factor = 2, NSA = 1, resulting in a scan time of 01m 24s. R1ρ data was calculated by fitting the signal to a mono-exponential model S = A·exp(-TSL·R1ρ), where S is the acquired MR signal, and A the signal intensity without locking pulse.
To investigate R1ρ dispersion in kidney cortex, a simple scheme based on one single TSL = 40ms and different FSLs (=100Hz, 300Hz, 500Hz) was utilized to estimate ΔR1ρ as described below:
S = A·exp(-TSL·R1ρ), [1]
The division of the signal intensities between the low and high FSLs is
Slow/Shigh = exp[-TSL·(R1ρlow - R1ρhigh)] = exp(-TSL·ΔR1ρ), [2]
then the dispersion ΔR1ρ = -1/TSL · ln(Slow/Shigh). [3]
Results
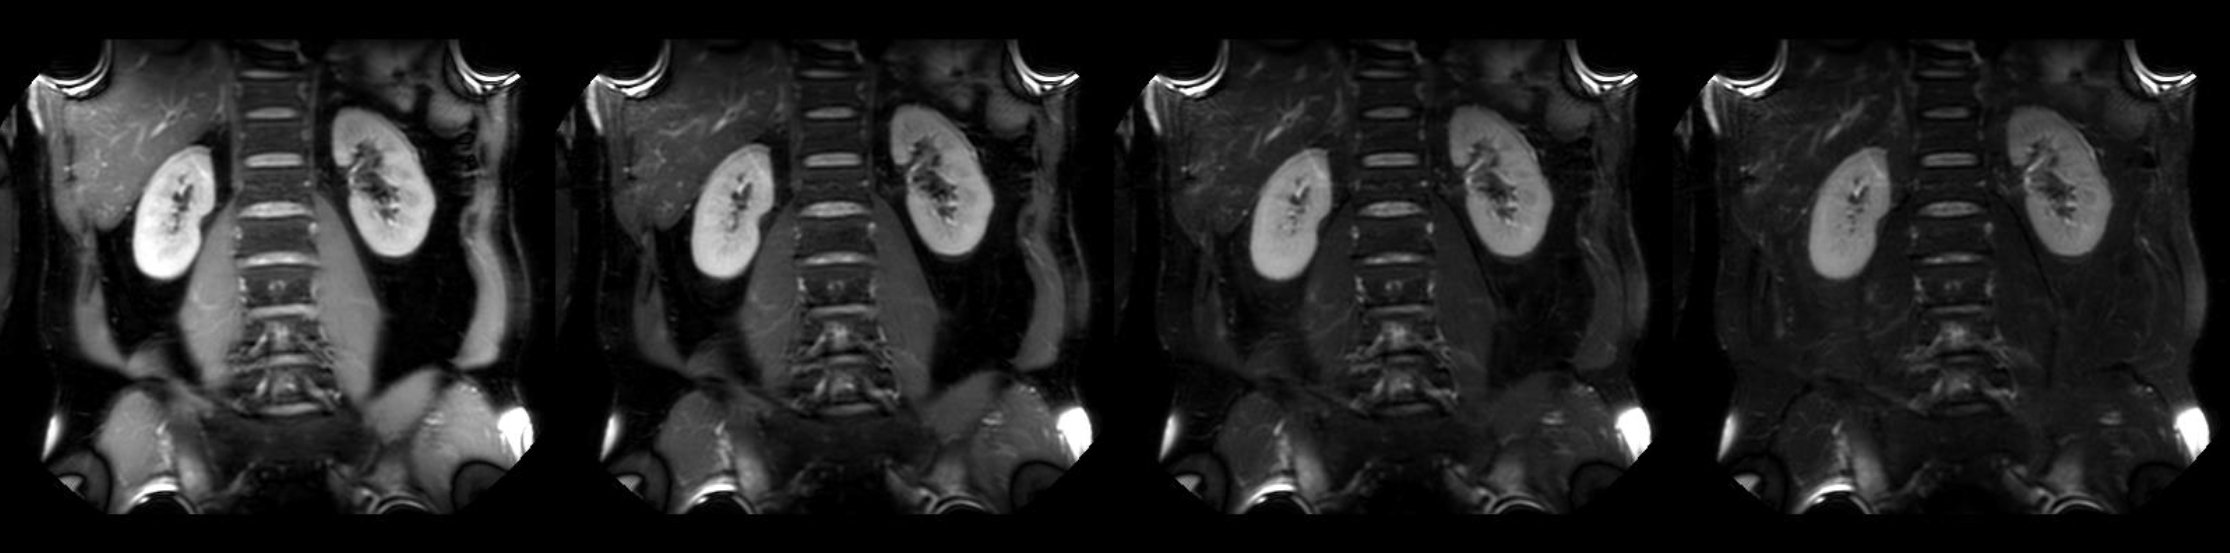
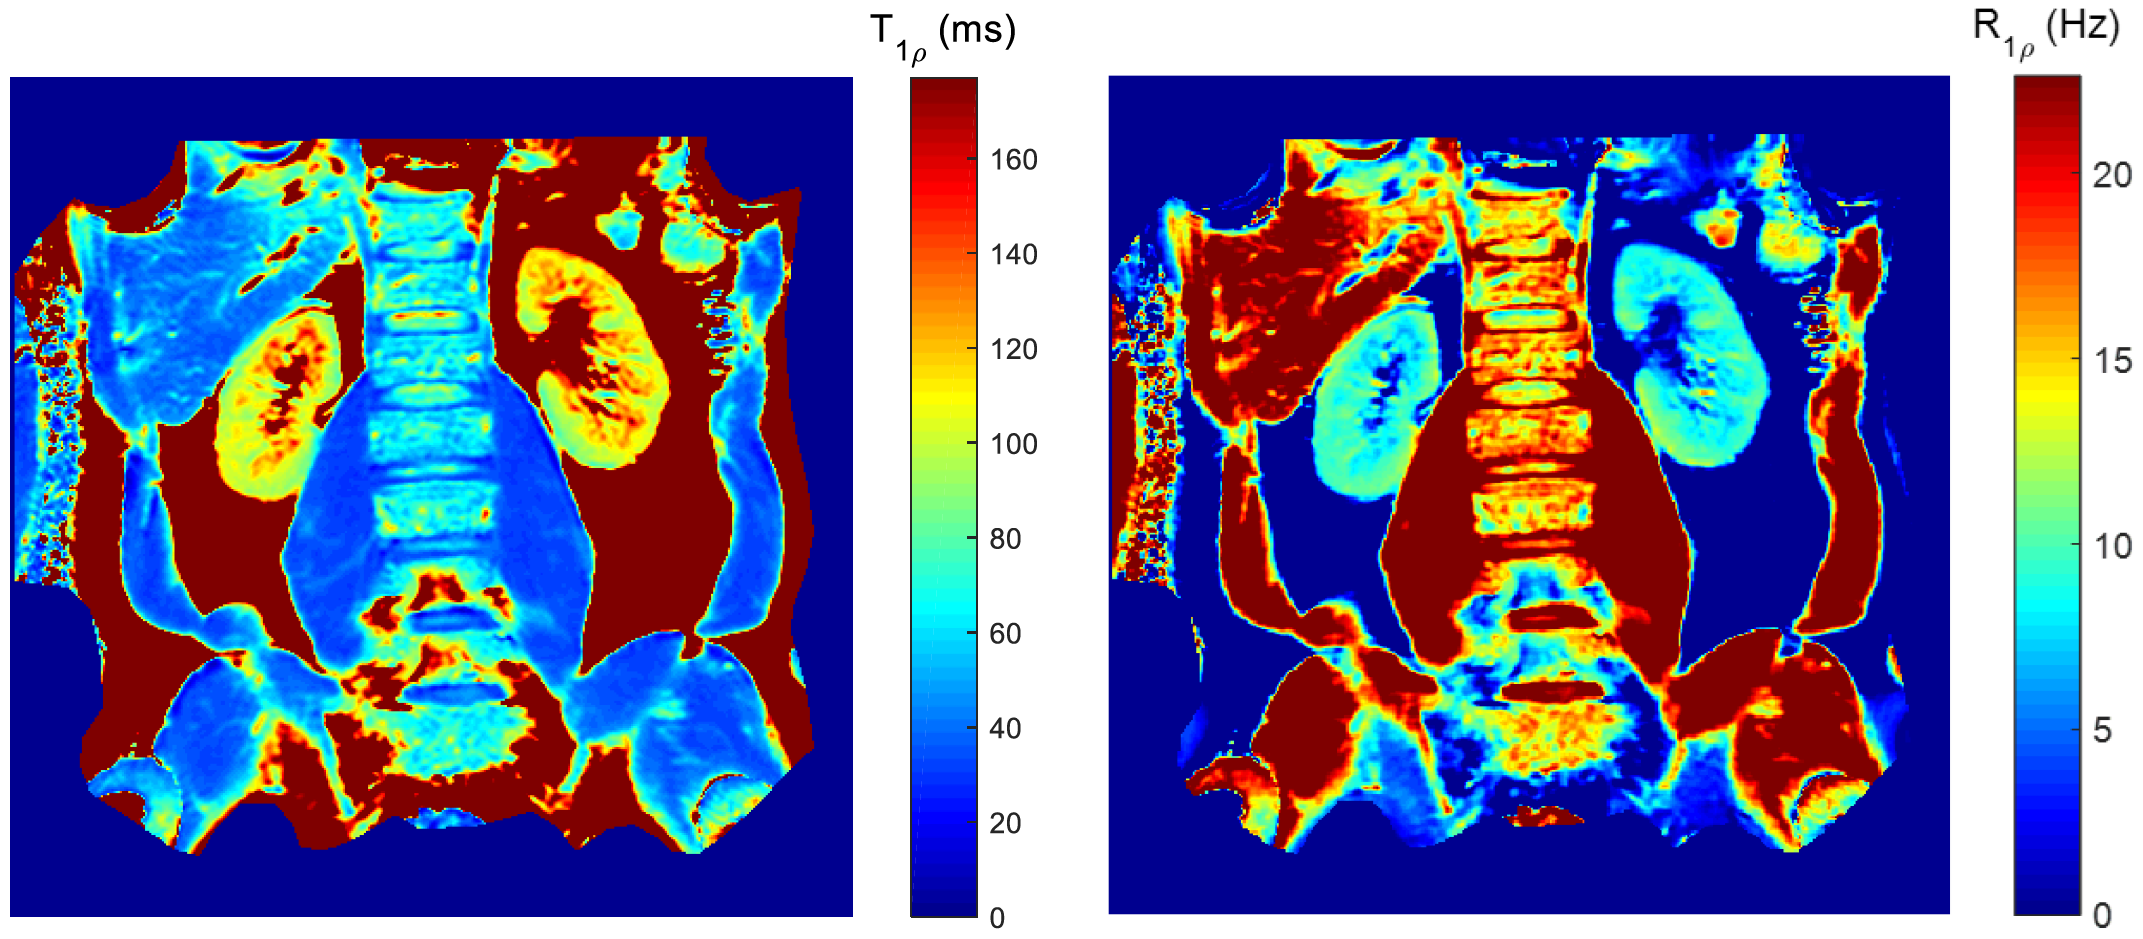
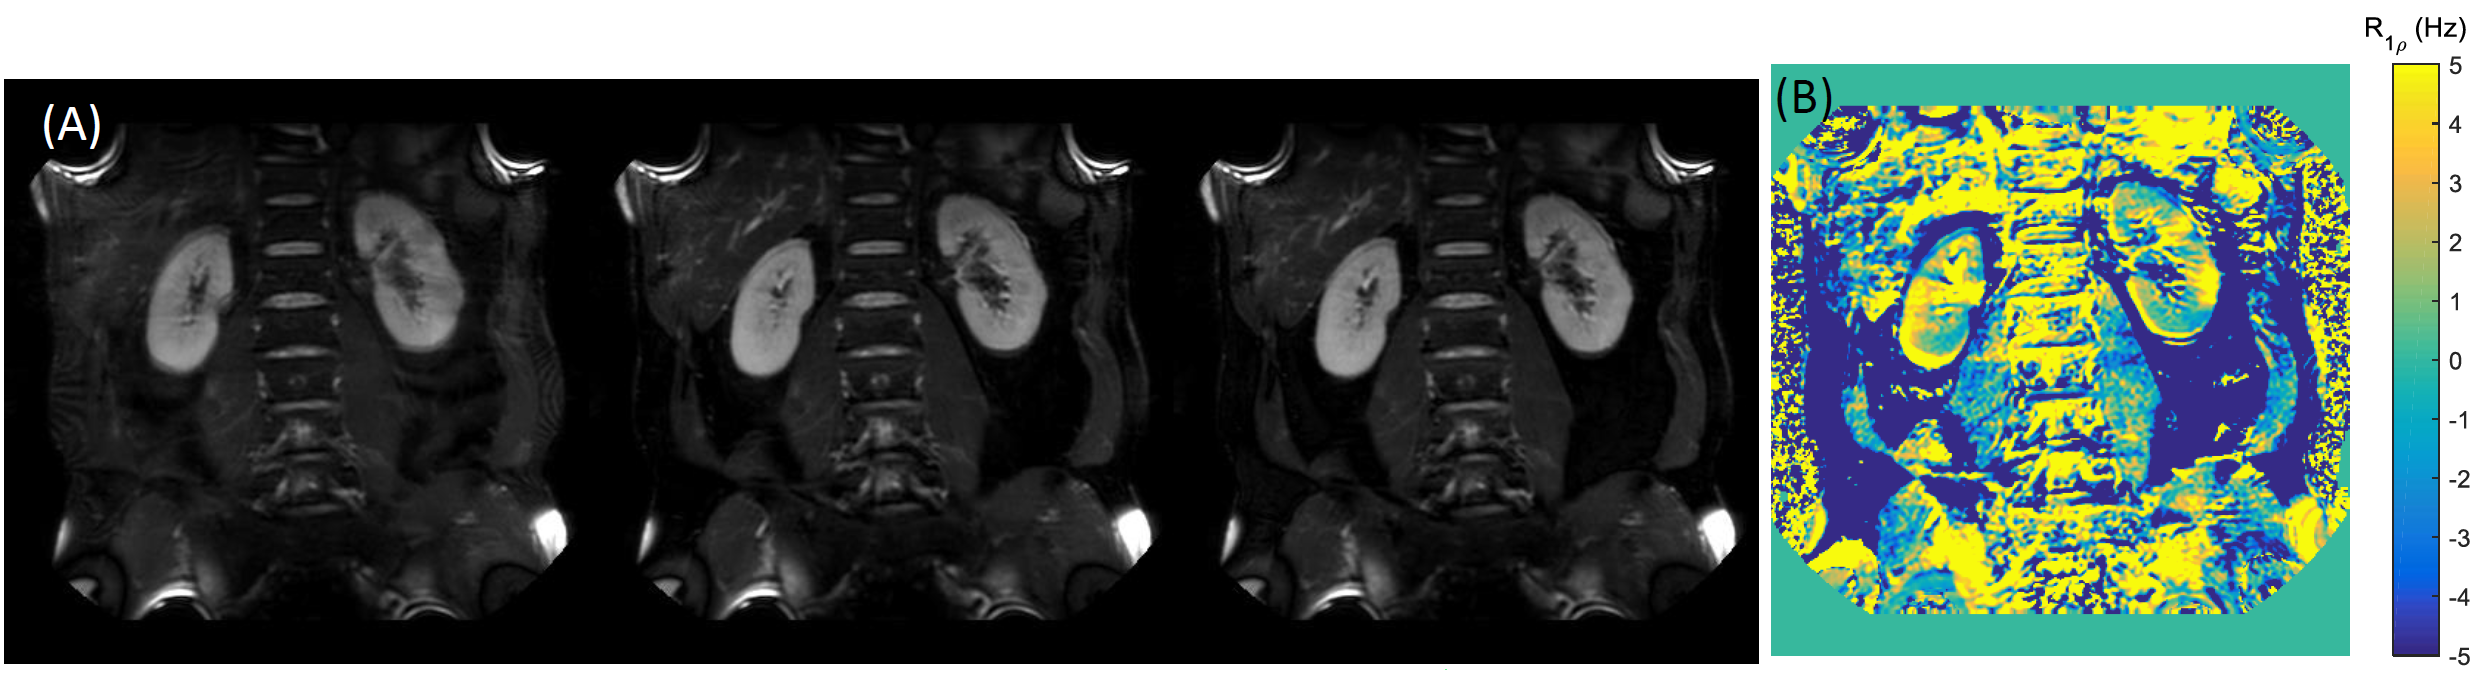
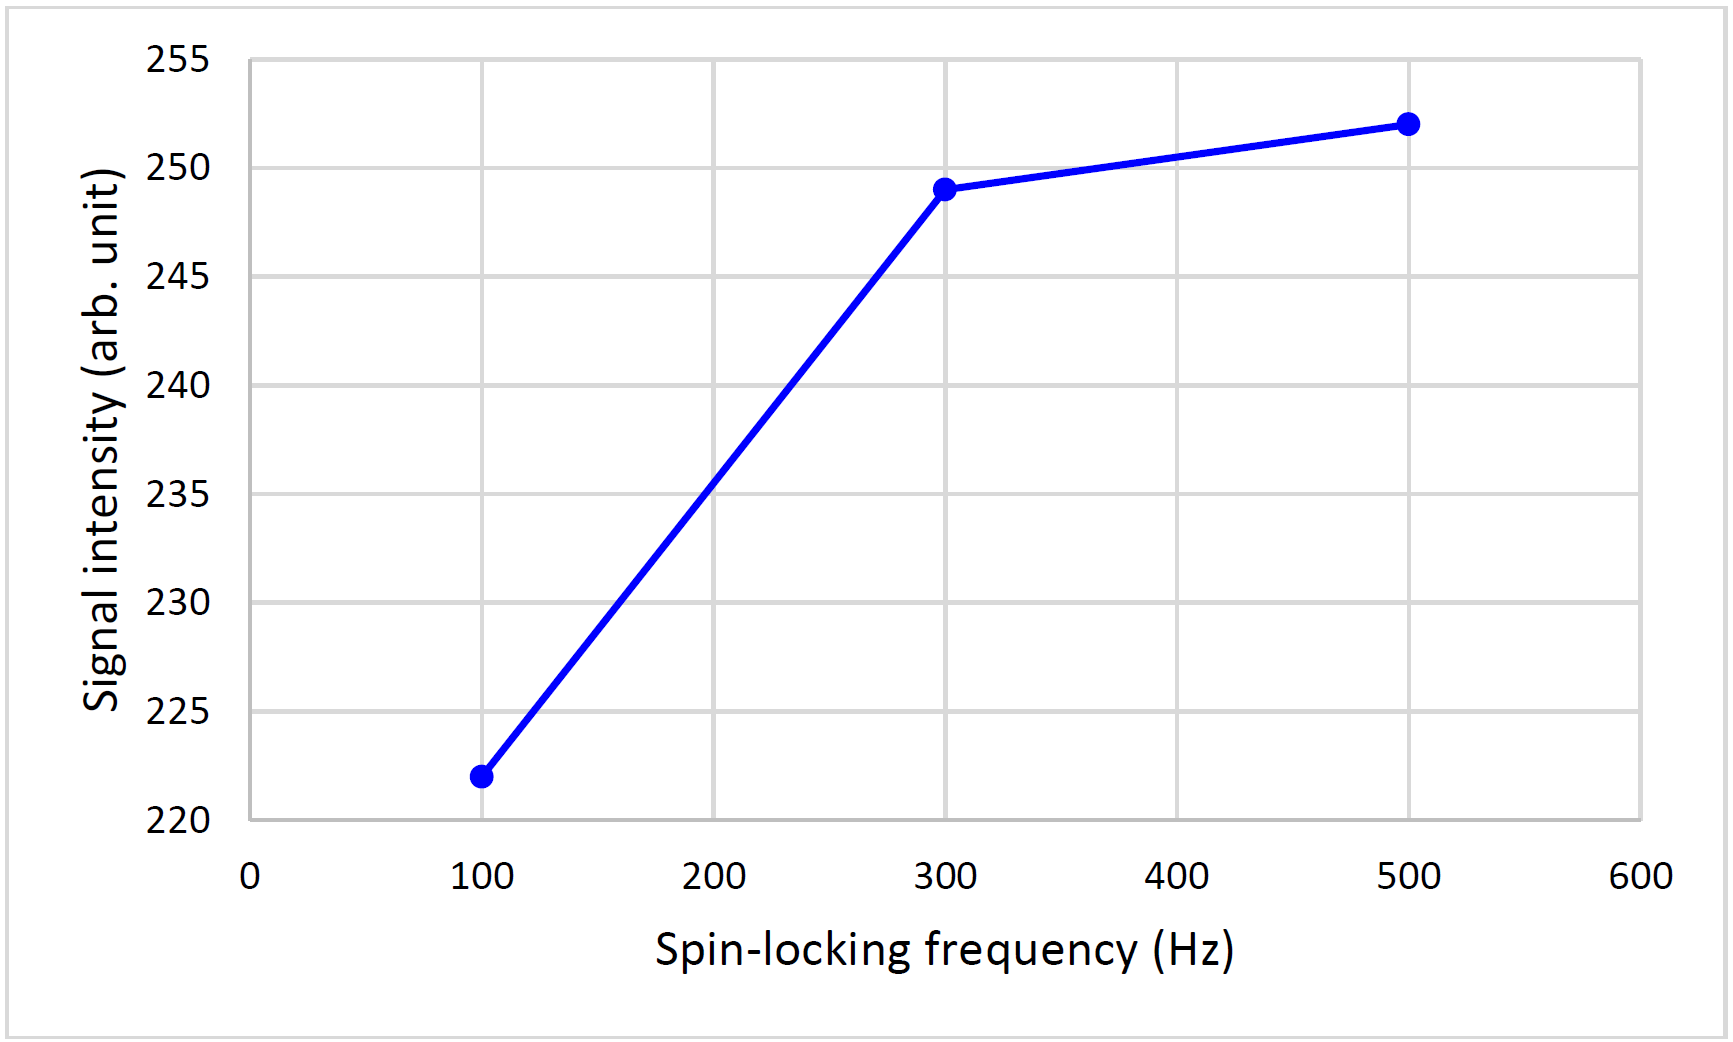
Figure 2 shows the representative T1ρ weighted images for kidneys, the corresponding T1ρ and R1ρ maps are displayed in Figure 3. The measured values (Mean ± SD) in kidney cortex are T1ρ = 110.4 ± 6.0ms, and R1ρ = 9.1 ± 0.5Hz. Figure 4 displays the T1ρ weighted images at one fixed TSL = 40ms and three different FSLs (= 100Hz, 300Hz, 500Hz), the R1ρ dispersion (ΔR1ρ) calculated from Eq. [3] is also shown. Finally, the signal intensity change over kidney cortex at different FSLs is plotted in Figure 5. It is seen that signal intensities increased about 12.2% from FSL = 100Hz to 300Hz, resulting in a ΔR1ρ ~ 2.3Hz based on Eq. [3], however, there was nearly no signal change above FSL = 300Hz (only 1.2% increase from FSL = 300Hz to 500Hz).Discussion
We developed an R1ρ imaging protocol that utilized AHP pulse combining with volume shimming to overcome field inhomogeneities. This imaging scheme was shown to be able to characterize kidney R1ρ value and R1ρ dispersion in a very short time, which potentially enables its applications in clinical kidney diseases. The greater R1ρ dispersion at lower FSL may reflect there may be more exchangeable protons associated with amides and/or amines than with hydroxyls in kidney cortex.Acknowledgements
No acknowledgement found.References
1. Cobb J, Xie J, Gore J. Contributions of chemical and diffusive exchange to T1ρ dispersion. Magn Reson Med. 2013; 69(5): 1357-1366.
2. Spear J, Gore J. New insights into rotating frame relaxation at high field. NMR Biomed. 2016; 29(9): 1258-1273.
3. Wang P, Block J, Gore J. Chemical Exchange in Knee Cartilage Assessed by R1ρ (1/T1ρ) Dispersion at 3T. MRI. 2015; 33(1): 38-42.
4. Wang p, Zhu H, Kang H, Gore JC. R1ρ dispersion and sodium imaging in human calf muscle. MRI. 2017; 42: 139-143.
Figures