2494
Application of T1rho and T1 mapping MRI in Tracking Renal Ischemia Reperfusion Injury Process in Rats1Medical Image Center, Zhujiang Hospital, Southern Medical University, Guangzhou, China, 2Radiology Department, Shenzhen Luohu People’s Hospital, Shenzhen, China, 3Philips Healthcare, Guangzhou, China, 4Philips Healthcare, Shanghai, China
Synopsis
Previous studies using T1rho and T1 mapping in the liver and heart demonstrated that T1rho value and T1 relaxation time can be used to assess acute injury and long-term tissue fibrosis1. However, to the best of our knowledge, these techniques have not been explored to evaluate acute kidney ischemia damage. In our study, we found that T1rho value and T1 relaxation time showed high specificity and sensitivity in a rat renal ischemia reperfusion injury (IRI) model.
Introduction
On one hand, MRI techniques such as arterial spin labeling (ASL), blood oxygen level dependent (BOLD) imaging and diffusion weighted imaging (DWI) have been employed to evaluate renal IRI, but their reliability needs to be further tested. On the other hand, T1 relaxation time in a rotating frame (T1rho) is highly specific and sensitive in acute liver injury1 and is superior to ASL, BOLD, DWI in evaluating lupus nephritis2. Also T1 mapping shows great promise in diagnosing cardiomyocyte edema and interstitial fibrosis in myocardial infarction and cardiomyopathy3.Therefore, we propose to use T1rho and T1 mapping techniques to investigate the renal IRI process in rats and the temporal variations of T1rho value and T1 relaxation time.Method
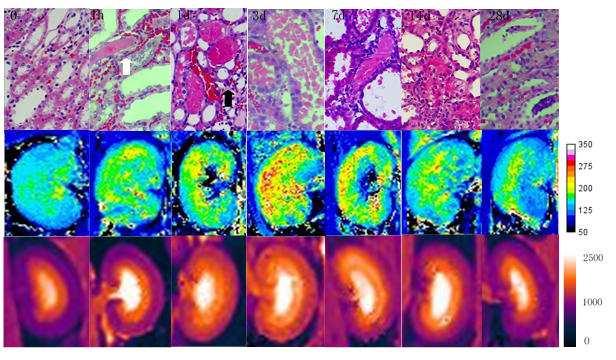
Rat renal IRI models were induced by clamping bilateral renal arteries for 45 min. 42 rats were divided into 7 groups. Each group included 6 rats and 12 kidneys. These groups were each scanned at a different time point: day 0 (baseline before IRI) and on days 1h, 1d, 3d, 7d, 14d, 28d after IRI. Venous blood was immediately withdrawn from 4 rats of each group and pathological examinations (bilateral kidney) were performed after MR scan. T1rho and T1 mapping images were acquired on a 3.0T MR scanner (Ingenia, Philips, Netherlands) using a 50mm rat coil (Suzhou ZHONGZHI Medical Technologies Co. Ltd).T1rho was implemented using a turbo-field-echo sequence with stretched adiabatic as the spin lock pulse type and the scanning parameters were as follows: TR/TE=4.9 ms/2.4 ms; FOV=60 mm×60 mm; flip angle=40˚; matrix=100×100; slice thickness=3 mm; number of slices=5; spin lock frequency=500 Hz; spin lock time=0,27,and 54,respectively.T1-mapping was carried out using Look-Locker with 19 inversion delay time points varying from 78 ms to 2200 ms; flip angle=7˚; FOV=60 mm×60 mm; acquired matrix=140×100; scan duration=15 ms. T1rho values were obtained by fitting different spin lock data with a mono-exponential decaying function using a IDL based software, and T1 maps were generated with MRmap software V1.4. Eight Regions of interest (ROIs) were placed on parenchyma to calculate mean T1rho values and 4 ROIs on renal cortex and medulla respectively to obtain T1 relaxation times of cortex (T1cortex) and medulla (T1medulla).Semi-quantitative kidney injury was evaluated by Jablonski score of renal pathological sections stained with hematoxylin and eosin. One-way analysis of variance (ANOVA),receiver operating characteristic(ROC) curve analysis and Spearman correlation test were performed to determine diagnostic accuracy.Results
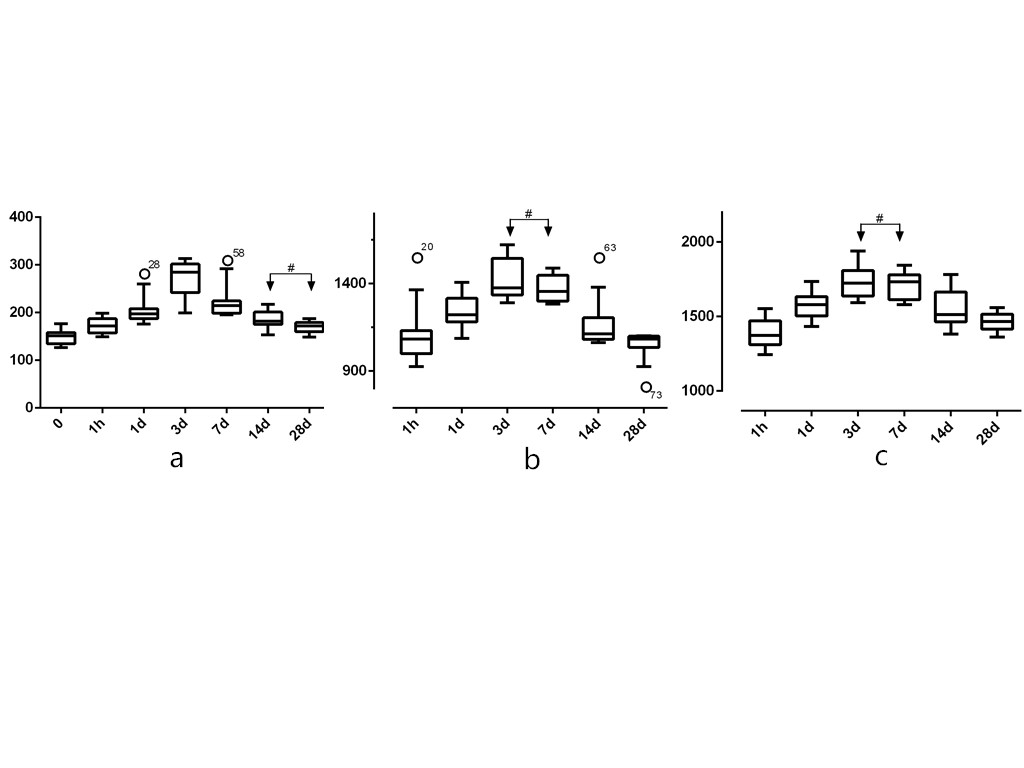
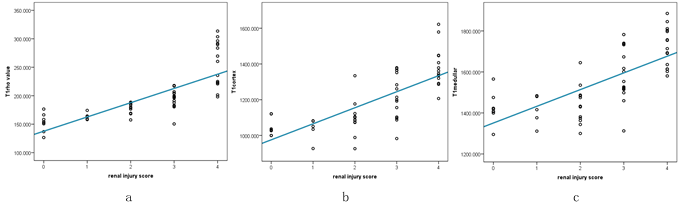
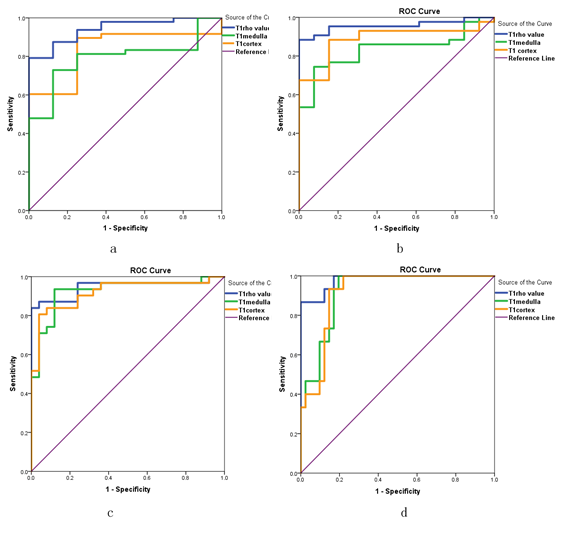
HE staining results show that from 1h to 7d after IRI the numbers of tubular epithelial detachment, tube cast and inflammatory cells slowly increased, whereas tubular epithelial cells continued to repair and tube cast and inflammatory cells gradually disappeared (Figure 1). T1rho values of the baseline group were significantly different from any of the IRI group. Moreover, T1rho values of the IRI groups at two adjacent time points all showed significant differences except when comparing the 14d and 28d groups (Figures 1 and 2). All the rats were differentiated into 5 groups based on the Jablonski score, and Figure 4 demonstrated a highly positive correlation between T1rho value and renal injury score (r = 0.893, P <0.01) (Figure 3). T1cortex and T1medulla of the baseline group were significantly different from 1d, 3d, 7d, 14d groups. T1 relaxation times of the IRI groups at two adjacent time points again showed significant differences except when comparing the 3d and 7d groups (Figures 1 and 2). Similar to T1rho, T1 relaxation time was also positively correlated with renal injury score and increased with increasing renal injury in both the cortex and medulla (cortex correlation coefficient r = 0.787, P <0.01, and medulla r = 0.769, P <0.01)(Figure 3). Analysis of ROC curves for renal injury scoring showed that AUC of T1rho, T1cortex, T1medulla are 0.934-0.980, 0.836-0.919 and 0.792-0.925 respectively (Figure 4).Discussion and Conclusion
In this study, we confirmed that T1rho value and T1 relaxation times reflected different stages of renal injury in a rat IRI model. As the injury progressed in 1h-7d rats, both T1rho value and T1 relaxation times increased correspondingly. In contrast, T1rho value and T1 relaxation times gradually decreased as the kidney rehabilitated in 7d-28d rats. Both T1rho value and T1 relaxation times showed high specificity and sensitivity for evaluating renal injury. Thus, T1rho and T1-mapping MRI techniques have great potential in monitoring rat renal IRI process and accessing renal injury.Acknowledgements
No acknowledgement found.References
1.Hu G, Zhang X, Liang W, et al. Assessment of liver fibrosis in rats by MRI with apparent diffusion coefficient and T1 relaxation time in the rotating frame[J]. J Magn Reson Imaging,2016,43(5):1082-1089.
2. Rapacchi S, Smith R X, Wang Y, et al. Towards the identification of multi-parametric quantitative MRI biomarkers in lupus nephritis[J]. Magn Reson Imaging,2015,33(9):1066-1074.
3. Montgomery J A, Abdallah W, Yoneda Z T, et al. Measurement of diffuse ventricular fibrosis with myocardial T1 in patients with atrial fibrillation[J]. J Arrhythm,2016,32(1):51-56.
Figures