2493
A Preliminary Study of the Longitudinal Changes in a Reversible Unilateral Ureteral Obstruction Rat Model using Intravoxel Incoherent Motion and Arterial Spin Labeling ImagingGenwen Hu1, Xianyue Quan2, Jianmin Xu1, Liangping Luo3, Yingjie Mei4, and Siying Wang5
1Department of Radiology, The Second Clinical Medical College of Jinan University, Shenzhen People's Hospital, Shenzhen, China, 2Zhujiang Hospital, Southern Medical University, Guangzhou, China, 3The First Affiliated Hospital of Jinan University, Guangzhou, China, 4MR Clinical Science, Philips Healthcare, Guangzhou, China, 5MR Clinical Science, Philips Healthcare, Shanghai, China
Synopsis
The longitudinal changes of intravoxel incoherent motion (IVIM) and arterial spin labeling (ASL) imaging in a RUUO model
Introduction
Unilateral ureteral obstruction (UUO) is a commonly used experimental model to study obstructive nephropathy and renal fibrosis.[1] However, this model is not suitable for long-term investigations as it causes irreversible acute kidney injury and the renal parenchyma would be completely damaged in a few weeks.[2] Recently, a reversible unilateral ureteral obstruction (RUUO) model has been proposed which allows serial assessments of the functional, structural and molecular changes to be performed simultaneously after kidney injury.[3] In this study, we evaluated the longitudinal changes of renal perfusion and diffusion in a rat RUUO model.Purpose
To measure and evaluate the longitudinal changes of intravoxel incoherent motion (IVIM) and arterial spin labeling (ASL) imaging in a RUUO model which has been thought to induce fibrosis and chronic functional deficiencies.Materials and Methods
This investigation was performed on a 3.0T whole body MR scanner (Ingenia, Philips). The experimental setup was illustrated in Figures 1 and 2. Each of the eight rats was scanned at seven different time points, namely on days 0, 1, 3, 5 after UUO, and on days 4, 7, 12 after release of 5 days of obstruction. The IVIM images were acquired with nine b-values (0, 25, 50, 75, 100, 150, 300, 700, 1000s/mm2) to estimate the apparent diffusion coefficient (ADC), pure molecular diffusion (D) and perfusion fraction (f) (Figure 3). For quantification of renal perfusion, a combination of flow-alternating inversion-recovery (FAIR) labeling scheme and EPI readout was carried out with following parameters for both global (control) and slice-selective (label) inversion: TR/TE: 3000/35ms; TI: 1200ms; FOV: 60×60mm2; matrix: 76×58; slice thickness: 4mm; NSA: 10. We chose the cortex (COR), outer (OSM) and inner (ISM) stripes of the medulla as the regions of interest (ROI) throughout the study.Results
In general, ADC, D and f obtained from IVIM decreased with time after UUO, but increased after releasing the obstruction. RBF obtained from ASL showed the same trend (Figure 4-5). Changes of the D value in the ISM was considerable before and after RUUO. The f values in the COR, OSM and ISM were substantially reduced after obstruction. Obstruction kidney is 43.5%, 58.1% and 43.1% of contralateral (control) kidneys on 5 days after the obstruction. And that is 69.6%, 48.5% and 51.8% of contralateral kidneys on 12 days after release obstruction. RBF decreased gradually with the time of obstruction, Obstruction kidney is 31.4% of contralateral kidneys on 5 days after the obstruction. And that is 82.4% of contralateral kidneys on 12 days after release obstruction.Conclusion
In this study, we confirmed that IVIM and ASL can reflect the functional changes associated with kidney perfusion and diffusion. Thus these imaging techniques can be useful for long-term tracking of obstructive nephropathy progression as well as assessment of therapeutic outcomes.Acknowledgements
No acknowledgement found.References
[1]. Chevalier, R.L., M.S. Forbes and B.A. Thornhill, Ureteral obstruction as a model of renal interstitial fibrosis and obstructive nephropathy. Kidney Int, 2009. 75(11): p. 1145-52.
[2]. Yao, Y., et al., Interferon-γ Improves Renal Interstitial Fibrosis and Decreases Intrarenal Vascular Resistance of Hydronephrosis in an Animal Model. Urology, 2011. 77(3): p. 761.e8-761.e13.
[3]. Haque, M.E., et al., Longitudinal changes in MRI markers in a reversible unilateral ureteral obstruction mouse model: preliminary experience. J Magn Reson Imaging, 2014. 39(4): p. 835-41.
Figures
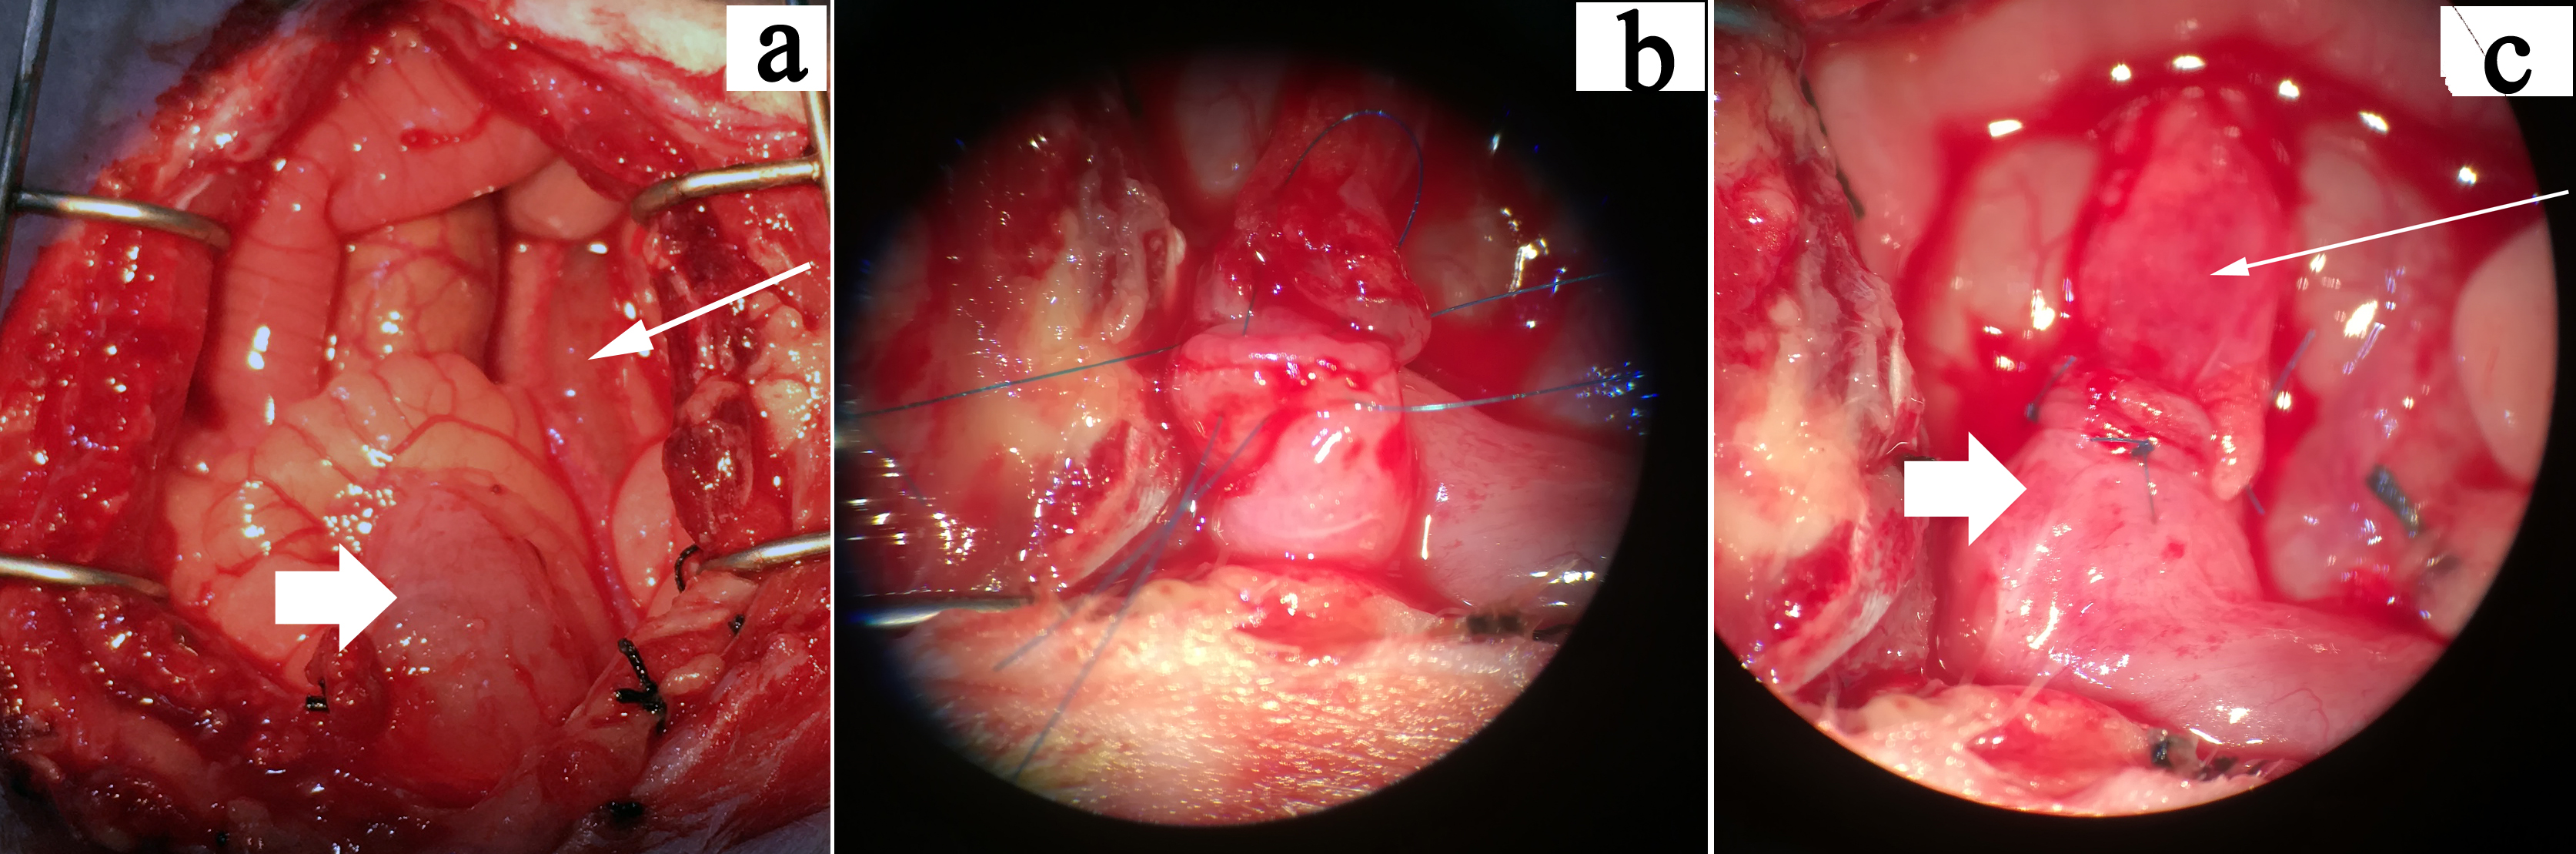
Figure 1. (a) Day 5 after obstruction of the left lower ureter. The
obstructed ureter (thin arrows) and urinary bladder (thick arrows) were
identified and freed from adhesions. (b)To relieve the obstruction, a ureteral
bladder anastomosis was made under a microscope. (c) Left ureteral (thin
arrows) and bladder (thick arrows) after anastomosis.
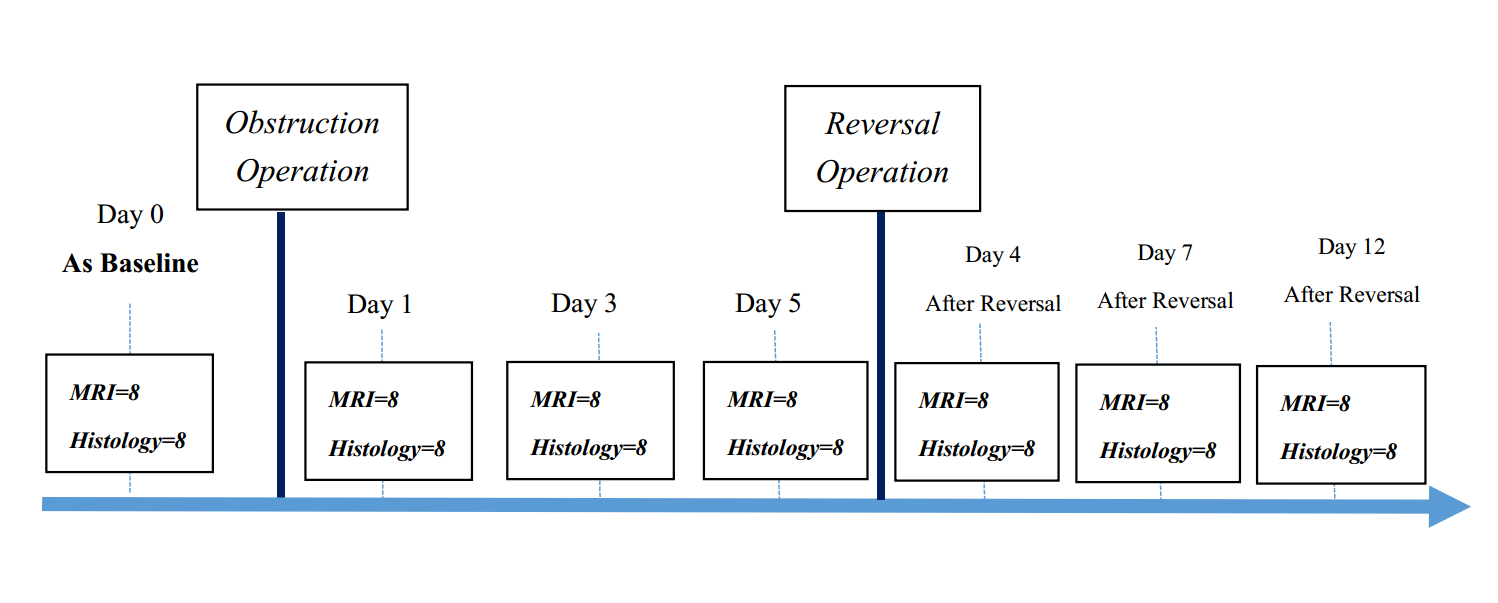
Figure 2. Experimental setup of this
study. eight rats with IVIM and ASL images were acquired at seven different
time points, namely on days 0, 1, 3, 5 after UUO, and on days
4, 7, 12 after release of 5 days of obstruction
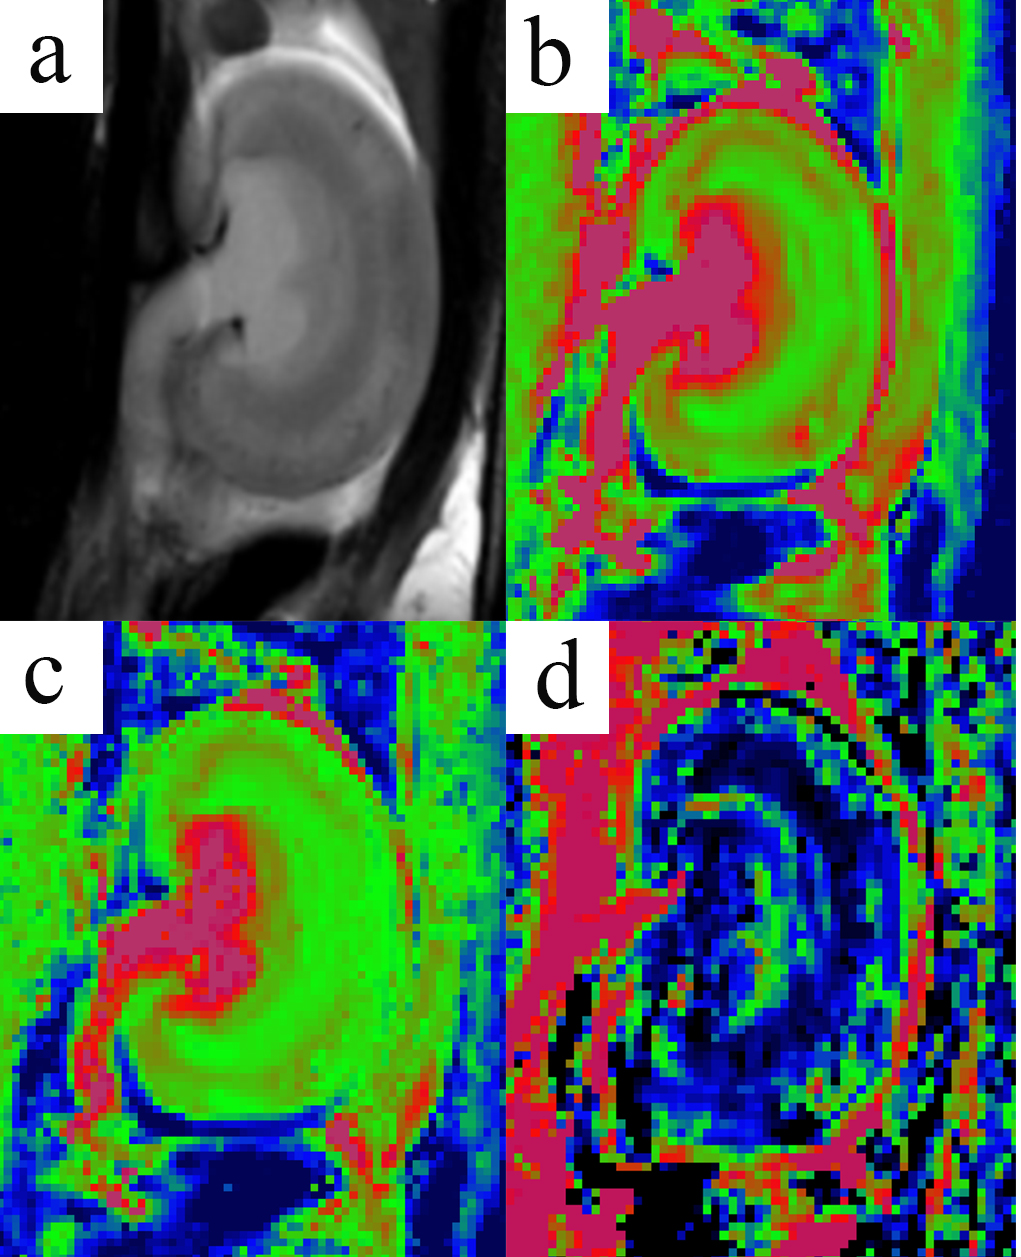
Figure 3. A rat on day 5 after UUO. (a)
Coronal T2-weighted image; (b)
apparent diffusion coefficients (ADC) map (c) pure molecular
diffusion-D map (d) perfusion fraction-f map.
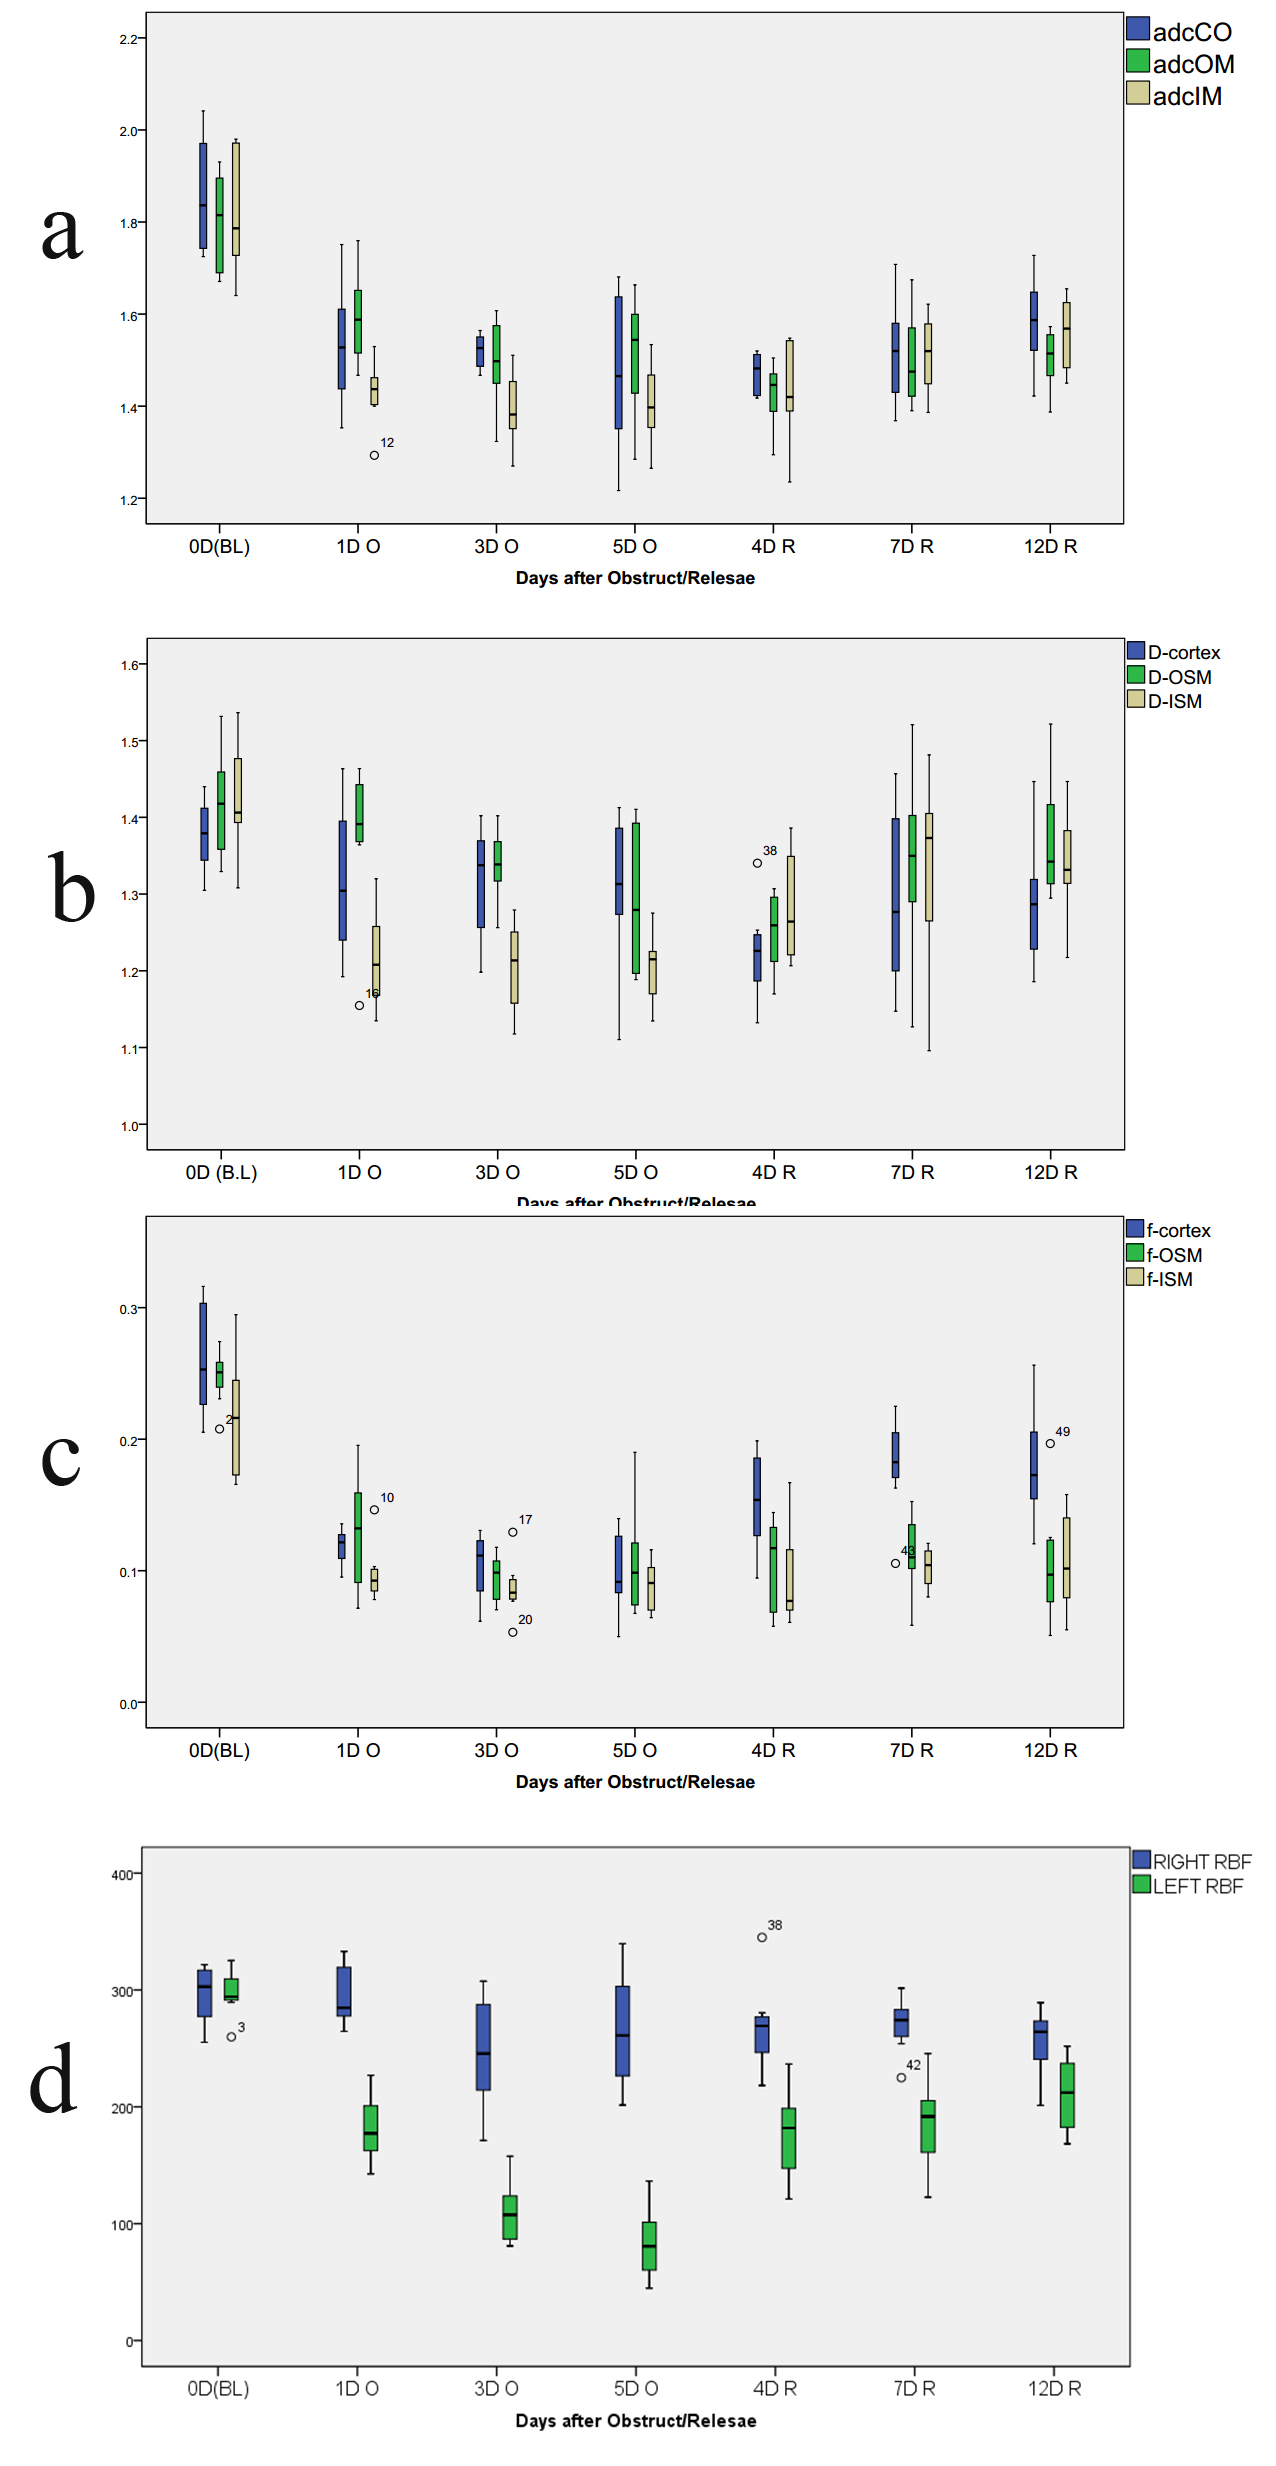
Figure 4. Box plots of
parameters on days 0, 1, 3, 5 after UUO, and on days 4, 7, 12 after release of
5 days of obstruction. (a) apparent diffusion coefficients, ADC. (b) pure molecular diffusion, D. (c)
perfusion fraction, f. (d)renal
blood flow (RBF) from ASL.
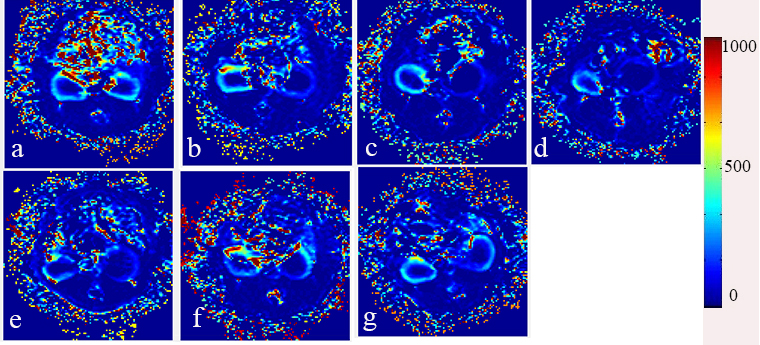
Figure 5. Renal blood flow
(RBF) maps (ml/100g/min). a-g
correspond on days 0, 1, 3, 5 after UUO, and on days 4, 7, 12 after release
of 5 days of obstruction.