2488
Assessment of Colonic Motility Using Magnetic Resonance Imaging: Reproducibility of a Macrogol Challenge1Nottingham Digestive Diseases Centre, University of Nottingham, Nottingham, United Kingdom, 2National Institute for Health Research (NIHR) Nottingham Biomedical Research Centre, Nottingham University Hospitals NHS Trust and University of Nottingham, Nottingham, United Kingdom, 3Motilent Ltd, London, United Kingdom, 4Sir Peter Mansfield Imaging Centre, University of Nottingham, Nottingham, United Kingdom, 5Centre for Medical Imaging, University College London, London, United Kingdom, 6Division of Primary Care, University of Nottingham, Nottingham, United Kingdom
Synopsis
This study assessed the reproducibility of a previously developed diagnostic test using a macrogol stimulus and MRI measures to assess colonic motility. This test was performed twice on healthy volunteers and the results were compared. The data showed some variability across visits representing both variability in baseline data and the physiological response of the colon to the stimulus. Correlation data suggested that although intra-subject variability existed the maximum measured MRI parameters all increased post stimulus. This colonic stimulus test allows us greater insight into potential pathologies behind GI disorders and as such may be of value here.
Introduction
Previous work developed a novel diagnostic test using magnetic resonance imaging (MRI) to assess the colonic response (volume, motility and movement within lumen) to a macrogol challenge drink in order to define the underlying mechanisms of severe constipation1,2. However, the reproducibility of this test has not been assessed.
Aim
To measure the intra-subject reproducibility of the measures used to assess colonic function in constipation.
Methods
Study Population
Subjects were aged ≥18 and were excluded if they had history of GI disorder, contra-indication to MRI, inability to cease use of medication affecting gut function, lifestyle factors likely to disrupt gut function or inability to comply with the protocol. Prior to each study day they were asked to keep a bowel habit diary for 3 days and were excluded if they had <2 or >10 bowel movements in this time. The study was approved by the University of Nottingham Ethics Committee and all subjects gave written consent.
Intervention
Each participant attended for MRI on two occasions (identical protocols, with minimum 1 week separation). Subjects were asked to fast from the night before and avoid alcohol, caffeine and strenuous exercise for the preceding 24hrs. They underwent a fasting scan and then were given a macrogol drink (10 mL per kg of bodyweight rounded to the nearest 100 mL with a maximum of 1000 mL, polyethylene glycol 3350 with electrolytes) consumed at a rate of 2.5 mL/kg per 15 minutes. Participants then had two 30 minute scans at 60 and 120 minutes after starting the drink. The time to first bowel movement was also recorded.
MRI Acquisition and Analysis
Analyses were performed with automated and semi-automated image analysis software (Analyze9® (Mayo Clinic, Rochester, USA), and software written using Matlab® (The MathWorks Inc, Natick, USA) and IDL®(Research Systems Inc., Boulder, USA). Colonic volumes were measured as previously described3. Movement of fluid within the colon was assessed using the average coefficient of variance for the colonic region of interest inthe tagged cine MRI data4. The untagged cine data was non linearly registered across the time course using GIQuant®5 (Motilient Ltd, London, UK) and then changes in luminal diameter with time (due to contractions) along the AC and DC were calculated using software written in Matlab6 and used to estimate motility indices.
Statistical Analysis
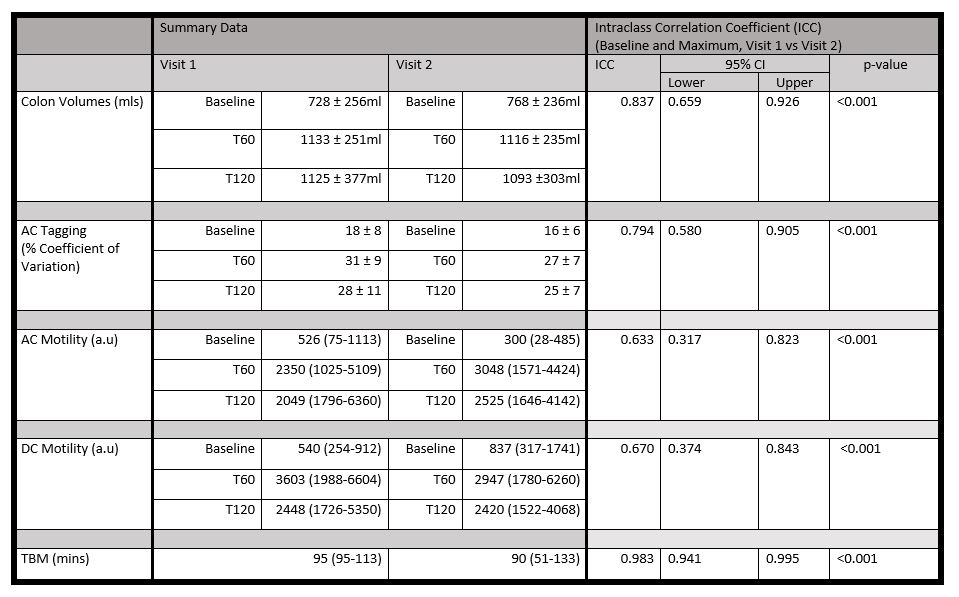
The baseline and maximum value after the drink for the volume, tagging or motility measures were determined for each subject. The maximum value was used to allow for different oro-caecal transit times of the macrogol drink over the two visits. Intra-class correlation coefficient between visits was assessed from the combined baseline and maximum post-stimulus data.
Results
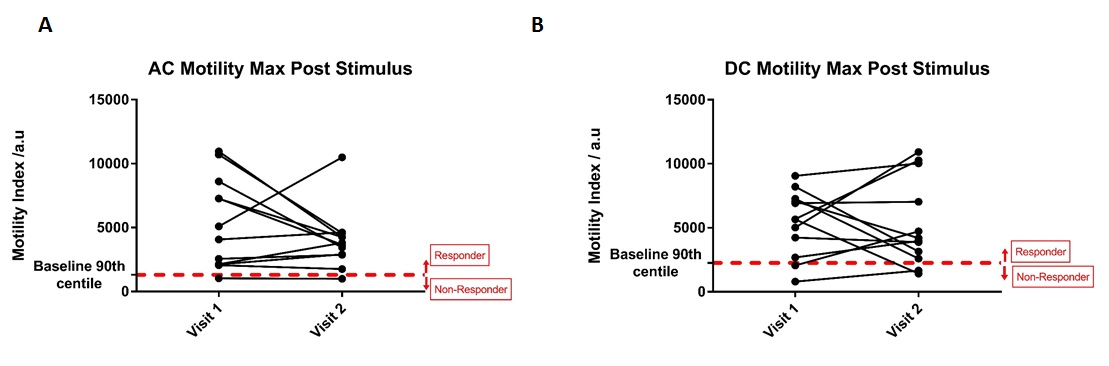
12 healthy volunteers completed the study: 9 female, 3 male, mean age 26 years (SD± 5) and body mass index 24.8 (±3.2) kg/m2. Examples of tagged and un-tagged cine MRI data are shown in Figure 1. Plots of the individual baseline data, maximum post stimulus data and maximum change from baseline for all MRI measures are shown in Figure 2. Correlations between visit 1 and visit 2 are shown in Figure 3. Using the definition of a motility responder as above 90% of baseline, Figure 4 shows the individual peak data responses. The summary data for each time point and correlation analyses are given in Figure 5.Discussion
Figure 2 and 3 indicate that colonic volumes, fluid flow and motility all consistently increased above baseline post stimulus. The colonic volume and AC tagging data had good intra-subject reproducibility (ICC volume = 0.84, tagging = 0.79, p<0.001), but larger inter-subject variability. AC and DC motility were reasonably repeatability at baseline but the response to the challenge was variable between study days resulting in a lower ICC overall (AC = 0.63, DC = 0.67, p<0.001) and indicating variability in the physiological response to the stimulus due to the irregular nature of colonic contractions following the macrogol drink. However with our definition of responder, all subjects kept the same status for AC motility and only 2 changed for DC motility across visits. At present there is no gold standard to compare these measures against. The time to first bowel movement showed low variability across the two visits (ICC TBM = 0.98, p<0.001).Conclusion
The colonic response to the macrogol stimulus as assessed by MRI is heterogeneous but large compared to baseline data making it a suitable test to study potential pathologies underlying GI disorders such as constipation. More data is needed to better define the normal range for comparison with patient groups who may have both hypo- and hyper-motile responses.Acknowledgements
Funded by MRC Experimental Medicine GrantReferences
1.Lam C, Chaddock G, Hoad C, et al. PTU-127 The Macrogol MRI Challenge Test: A Novel Non Invasive Colonic Function Test. Gut 2013;62:A98-A9.
2. Marciani L, Garsed KC, Hoad CL, et al. Stimulation of colonic motility by oral PEG electrolyte bowel preparation assessed by MRI: comparison of split vs single dose. Neurogastroenterol Motil 2014;26:1426-36.
3. Pritchard SE, Marciani L, Garsed KC, et al. Fasting and postprandial volumes of the undisturbed colon: normal values and changes in diarrhea-predominant irritable bowel syndrome measured using serial MRI. Neurogastroenterol Motil 2014;26:124-30.
4. Pritchard SE, Paul J, Major G, et al. Assessment of motion of colonic contents in the human colon using MRI tagging. Neurogastroenterol Motil 2017.
5. Menys A, Hamy V, Makanyanga J, et al. Dual registration of abdominal motion for motility assessment in free-breathing data sets acquired using dynamic MRI. Phys Med Biol 2014;59:4603-19.
6. Hoad CL, Menys A, Garsed K, et al. Colon wall motility: comparison of novel quantitative semi-automatic measurements using cine MRI. Neurogastroenterol Motil 2016;28:327-35.
Figures
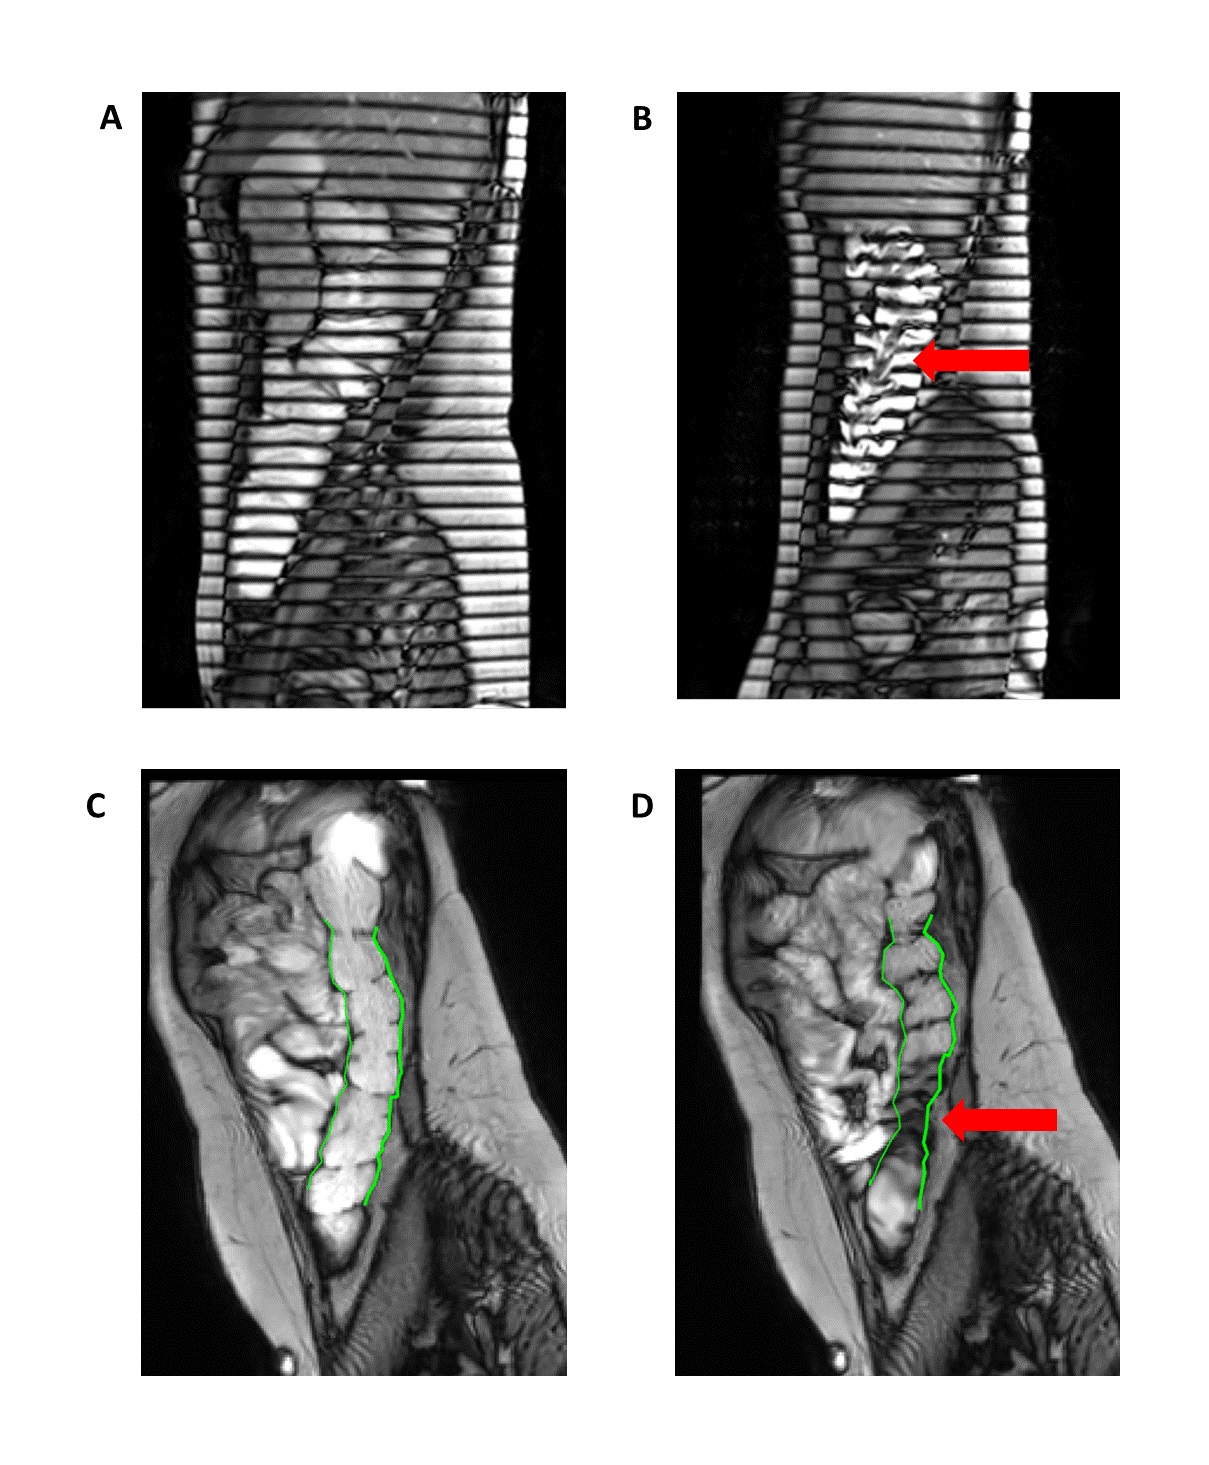
Figure 1a +b: Post stimulus tagging images of the AC, in Figure 1a the tagging lines remain horizontal whereas in 1b they are distorted by fluid flow in the AC (arrow).
Figure 1c+d: Images from motility analysis, vertical lines are drawn at the edge of the descending colon which move with contractions (arrow).
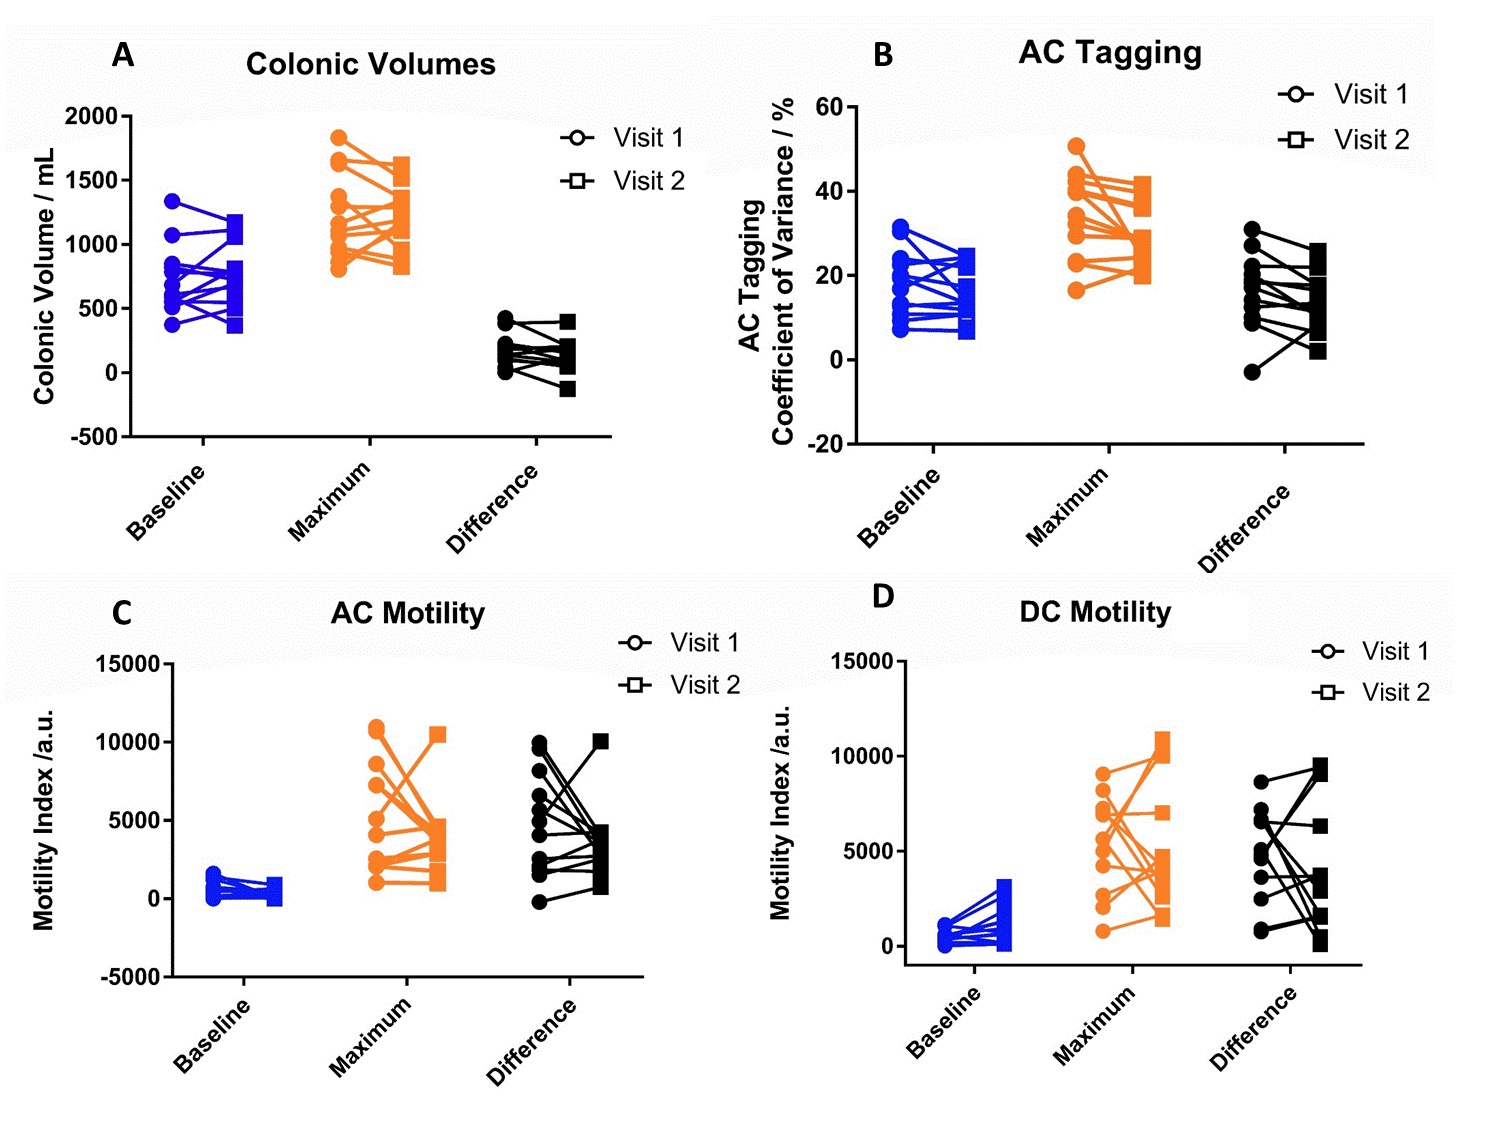
Figure 2a – Individual subject data of colonic volume at baseline, maximum and change.
Figure 2b – Individual subject data of AC tagging at baseline, maximum and change.
Figure 2c – Individual subject data of AC motility at baseline, maximum and change.
Figure 2d – Individual subject data of DC motility at baseline, maximum and change.
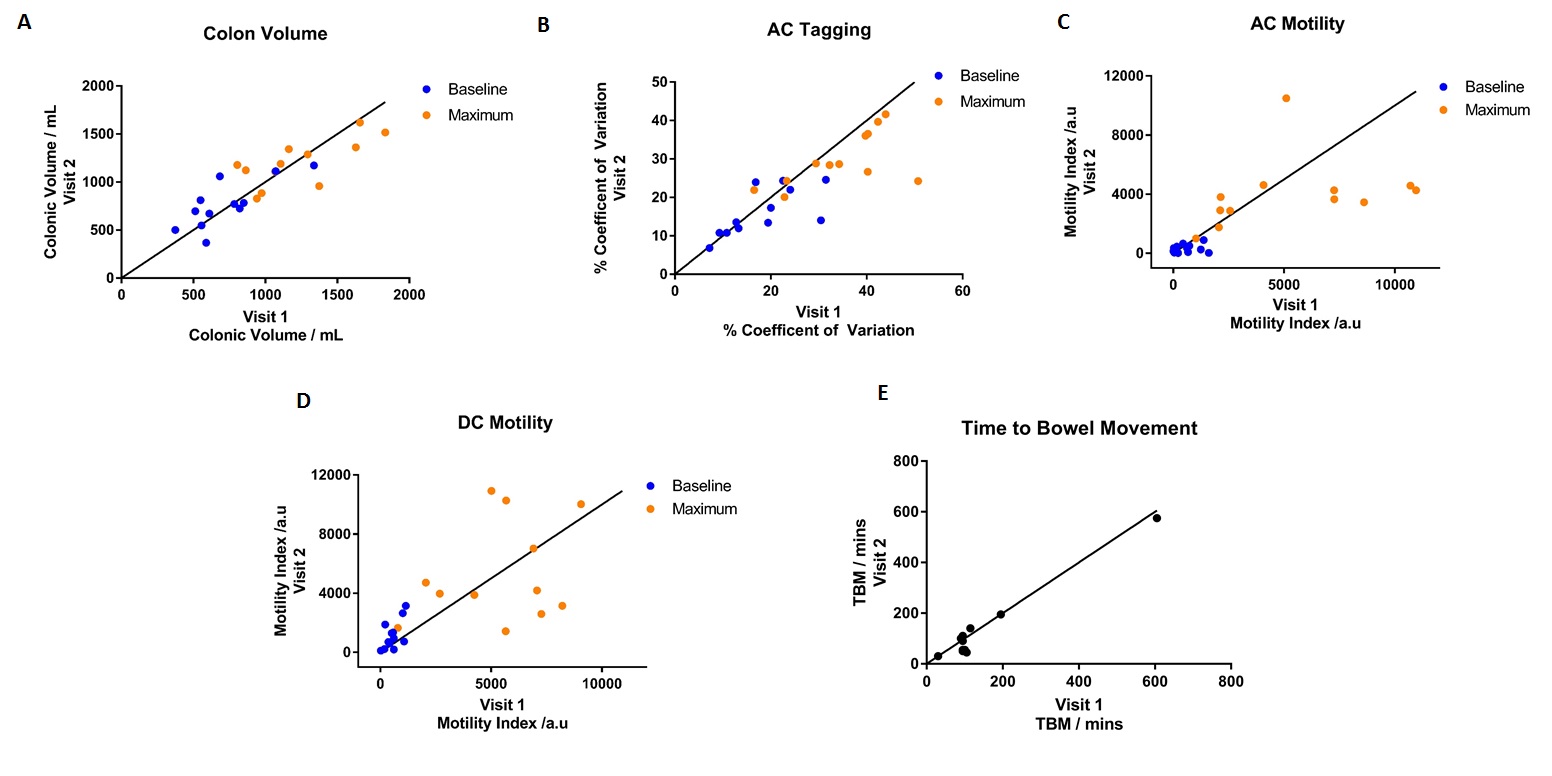
Figure 3a – Correlation of colonic volume values at baseline and maximum.
Figure 3b – Correlation of AC Tagging values at baseline and maximum.
Figure 3c – Correlation of AC Motility values at baseline and maximum.
Figure 3d – Correlation of DC Motility values at baseline and maximum.
Figure 3e – Correlation of Time to Bowel Movement.
Line of identity shown on all graphs.