2486
The value of IDEAL-IQ in evaluating pancreatic fat quantification in patients with non-alcoholic fatty liver disease(NAFLD)Qinhe Zhang1, Ailian Liu1, and Lizhi Xie2
1Department of Radiology, the First Affiliated Hospital of Dalian Medical University, Dalian, China, 2Department of Radiology, the First Affiliated Hospital of Dalian Medical University, Beijing, China
Synopsis
The study aims to assess the pancreatic fatty quantitation in NAFLD by use of IDEAL-IQ. It was concluded that IDEAL-IQ is a new way to evaluate the pancreatic fat quantification in patients with NAFLD. The fat fraction of the pancreas in patients with NAFLD is significantly higher than that in normal subjects, and the distribution of pancreatic fat in various regions of the pancreas in the NAFLD patients is well.
Purpose
To detect the correlation between NAFLD and pancreatic fat quantification by use of IDEAL-IQ.Introduction
Pancreatic fatty infiltration is closely related to obesity, type 2 diabetes, nonalcoholic fatty liver, abnormal glucose metabolism, metabolic disease,and meanwhile it is also a predisposing factor for pancreatic cancer, and it makes pancreatic cancer more prone to lymph node metastasis and increase the incidence of postoperative pancreatic fistula [1-2]. Therefore, the quantitation of pancreatic fat has important clinical significance. In this study, IDEAL-IQ is used to assess correlation between NAFLD and pancreatic fat quantification.Methods
Twenty-one patients with NAFLD,that underwent upper abdomen MRI at 1.5T(GE 1.5T Signa HDXT,America),which included IDEAL-IQ,were included(group A). At the same time,twenty normal subjects matched with age and BMI were collected (group B). Group A(NAFLD ,male 12,female 9,average age 56±11 years old,average BMI24.21(23.44,27.18)kg/m2);Group B(normal subjects,male 14,female 10,average age 60±12 years old,average BMI23.75(22.13,27.09)kg/m2 ). The images were reconstructed automatically by IDEAL Research software, and fat fraction, R2*, water phase and lipid phase were obtained. The fat fraction image was sent to the AW4.6 workstation and measured by compare software. Place three ROIs in the fat fraction image to measure the same level of the uncinate process, head and neck, body and tail of pancreas respectively.Then take three ROIs average for the certain position of the pancreatic fat value,and then take the average of the regions of the fat fraction to get the whole pancreatic average fat fraction.The images were analyzed and measured by two radiologists with double blind method. The data of two observers were analyzed with Spearman Test to assess inter-observer agreement. Shapiro-Wilk test was used to analyze the normality of the data. The difference in age between the two groups was examined by independent sample T test. The difference in BMI between the two groups was examined by non - parametric Mann-Whitney U test.The difference of sex between the two groups was compared by chi-square test. The non - parametric Mann-Whitney U test was used to compare the fat fraction of each part of pancreas and the mean fat fraction of pancreas between the two groups. The difference of fat content in each part of pancreas was compared by Friedman test within each group. The difference was statistically significant by P<0.05.Results
The data measured by the two observers were in good agreement. The difference in age, BMI, and gender between the two groups was not statistically significant (p>0.05). The fat fraction(%) of uncinate process, head and neck, body and tail of the pancreas of group A and group B were6.50(5.82,7.37),6.40(5.87,7.32),6.48(5.93,7.05),6.62(5.63,7.55),6.42(5.90,7.37);5.16(4.66,5.88),5.03(4.75,5.67),4.70(4.57,4.98),4.81(4.53,5.34),4.89(4.64,5.48),respectively,the difference between the two groups in different parts of the pancreas and pancreatic average fat fraction were statistically significant (p<0.05). There weren't significant differences in the fat fraction in each region of pancreas in groupA (p>0.05),but there were significant differences in the fat fraction in each region of pancreas in group B(P<0.05).Conclusion
IDEAL-IQ technique corrects many confounding factors that interfere with fat quantification, such as T2* decay, fat peak distribution, and so on,Finally, to generate accurate fat fraction image and R2* map. It has been applied to quantitative analysis of fat in several parts of the body[3-4].IDEAL-IQ is a new way to evaluate the pancreatic fat quantification in patients with NAFLD. The fat fraction of the pancreas in patients with NAFLD is significantly higher than that in normal subjects, and the distribution of pancreatic fat in various regions of the pancreas in the NAFLD patients is well, but it is uneven in the normal subjects with an average age 56 years old ,and the fat in uncinate process and head and neck is more than that in the body and tail of the pancreas.Acknowledgements
No acknowledgement found.References
1. Alempijevic T,Dragasevic S, Zec S,et al.Non-alcoholic fatty pancreas disease[J]. Postgraduate Medical Journal ,2017,93:226-230. 2.Tariq H, Nayudu S, Akella S,et al. Non-Alcoholic Fatty Pancreatic Disease: A Review of Literature[J]. Gastroenterol Res,2016,9:87-91. 3.Chiang HJ,Chang WP,Chiang HW,et al.Magnetic Resonance Spectroscopy in Living-Donor Liver Transpalntation[J].Transplant Proc,2016,48(4):1003-1006. 4.Idilman IS,Tuzun A,Savas B,et al..Quantification of liver,pancteas,kidney,and vertebral body MRI-PDFF in non-alcoholic fatty liver disease[J]. Abdom Imaging,2015: 1512–1519.Figures
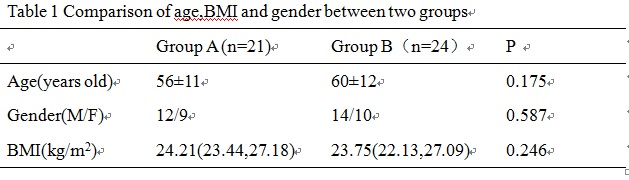
The difference in age, BMI, and gender between the two groups was not
statistically significant (p>0.05)
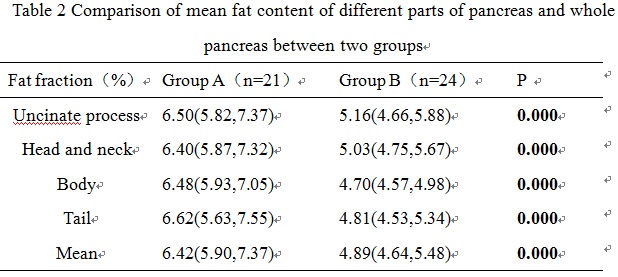
The difference between the two groups in different parts of the pancreas
and pancreatic average fat fraction were statistically significant.
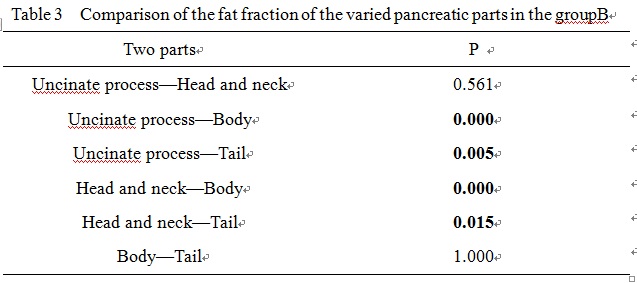
There were significant differences in the fat fraction in each region of
pancreas in group B.
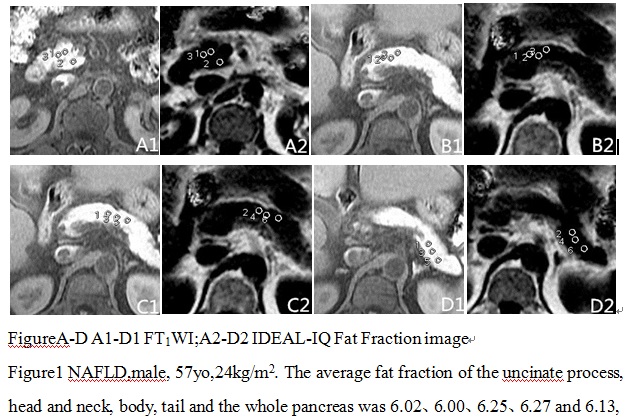
FigureA-D A1-D1 FT1WI;A2-D2 IDEAL-IQ Fat
Fraction image
Figure1 NAFLD,male, 57yo,24kg/m2.
The average fat fraction of the uncinate process, head and neck, body, tail and
the whole pancreas was 6.02、6.00、6.25、6.27 and 6.13, respectively.