2483
MRI assessed small bowel dysmotility and its relationship with patient reported symptoms: An exploration of automated vs subjective assessment techniques1Centre for Medical Imaging, University College London (UCL), London, United Kingdom, 2Radiology and Nuclear Medicine, Academic Medical Center (AMC), Amsterdam, Netherlands, 3Quantitative Imaging Group, Delft University of Technology, Delft, Netherlands
Synopsis
The pathophysiology of chronic abdominal symptoms in Crohn’s disease (CD) is complex. Recent pilot data using automated quantification of motility MRI suggests reduced variation in apparently normal bowel may underpin symptoms, including pain and diarrhoea. This two-centre validation study tests this association and compares automated measurements with subjective radiologist bowel motility assessment. We confirmed that reduced spatial variation of motility is significantly associated with the severity of abdominal symptoms, although the correlation was not strong. Automated measurement had superior inter-reader variability than subjective radiologist assessment, and showed a stronger association with patient symptoms.
Introduction
Crohn’s disease (CD) is a lifelong inflammatory bowel disease that causes debilitating symptoms1–3. Symptoms can be recorded using a questionnaire e.g. the Harvey-Bradshaw Index (HBI) which sums abdominal pain, impaired feeling of wellbeing and severity of diarrhoea4.
Results from symptom questionnaires are however highly variable and subjective. Many existing tests (e.g. endoscopy, blood tests and structural imaging) correlate poorly with symptoms with often low sensitivity/specificity for CD. An objective marker for the underlying mechanisms which cause patient symptoms, alongside disease specific measures of inflammation, would be valuable as a clinical tool to direct treatment.
Recently, single-site data in 53 CD patients using software-quantified MRI bowel motility reported an association between reduced spatial motility variation in normal small bowel, and abdominal symptoms5. The purpose of the current study is to examine in greater depth what quantified bowel motility might be able to tell us about patient symptoms based on multi-centre data. We derive several metrics along with experienced radiological assessment for comparison.
Methods
Subjects: 114 CD patients (55 male, 16-68 years old) underwent MR enterography at two sites (UCL, UK and AMC, Netherlands)
Scanning: Patients completed a HBI symptom questionnaire the day before scanning. Motility was imaged using a cine series of 2D coronal, balanced (BTFE) sequences acquired during breath-holds to cover the whole small bowel volume using routine motility imaging parameters6.
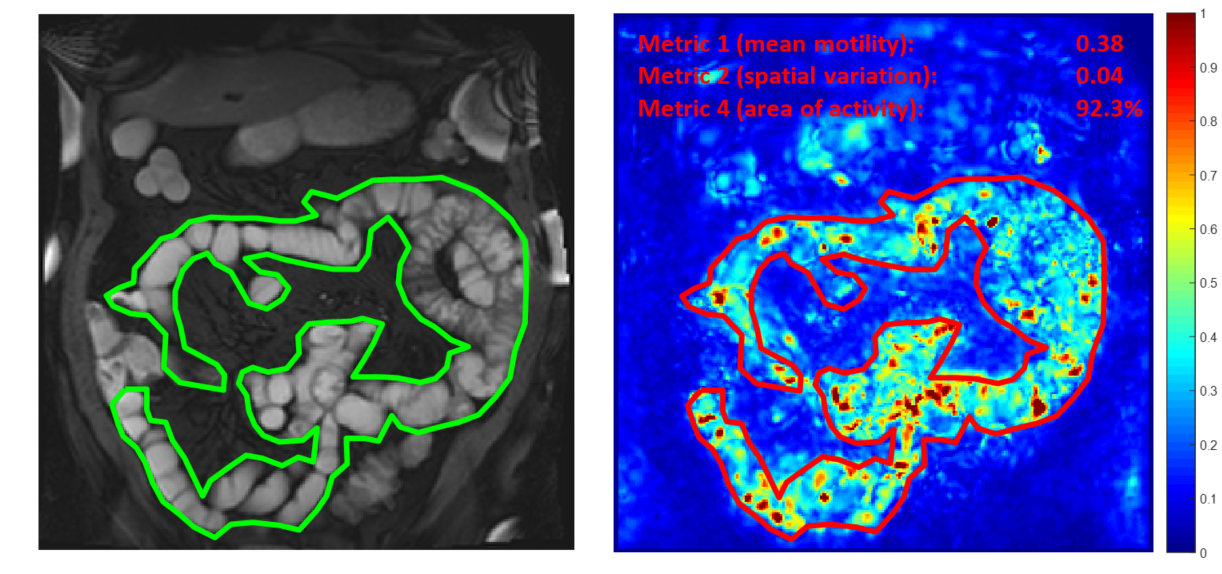
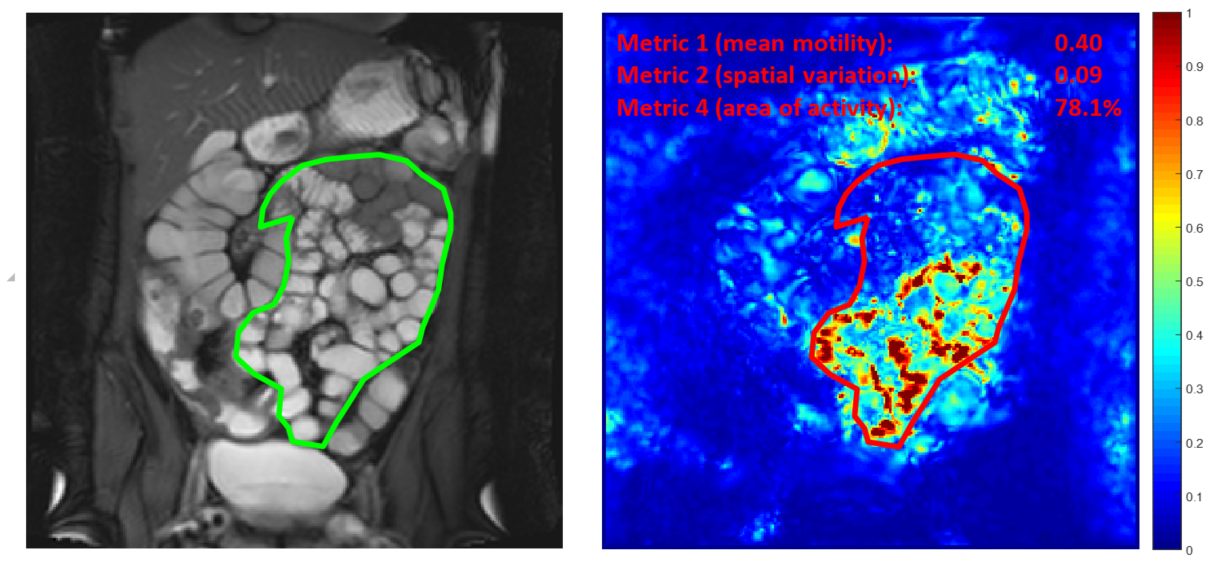
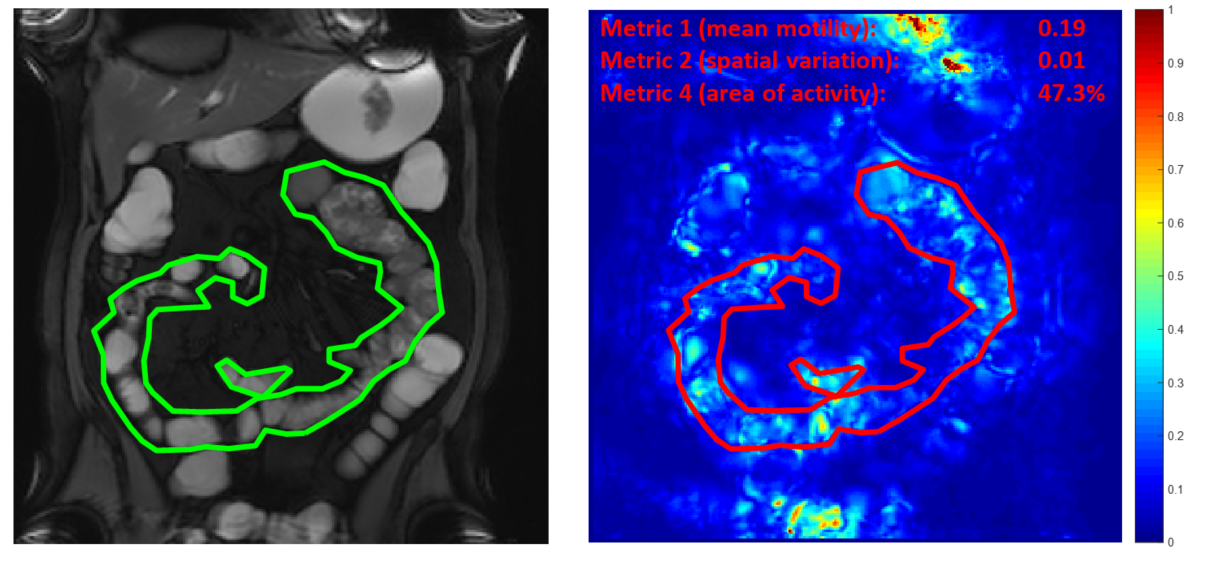
Generation of the motility index (MI): Frames from a 2D cine sequence were registered using an optic-flow based registration technique7. MI was calculated from the standard deviation of the Jacobian determinant of the deformation fields. This summarises the variations in local expansion and contraction on a per pixel basis (figure 1-3).
Motility analysis: Regions of interest (ROIs) were drawn to encompass all morphologically normal small bowel.
A total of 5 motility metrics were developed; 1) mean motility, 2) spatial variation (variability across the bowel volume), 3) temporal variation (variability over time), 4) area of activity (area of bowel showing motility above a threshold from previous literature5) and 5) bowel distension. Metrics 1,2 and 4 were based on the motility index (figure 1-3).
For comparison, two gastrointestinal radiologists viewed the cine MRI and subjectively graded the same 5 small bowel motility metrics on a 10-point scale from low to high providing a semi-quantitative Radiologist reference standard for comparative purposes.
Statistical analysis: Multivariable linear regression tested the associations between total HBI score (dependent variable) and both the 1) automated motility metrics and 2) radiologists’ grading (radiologist 1, radiologist 2 and combined mean radiologist score).
Models comprising combinations of independent variables were tested to derive the most predictive. Models were rejected if the F-statistic was insignificant. Further models were rejected if the confidence intervals of the standardised coefficient estimates contained both negative and positive values. For the remaining models, the larger the absolute value of the standardised coefficient, the higher the importance of the variable in predicting HBI.
Results
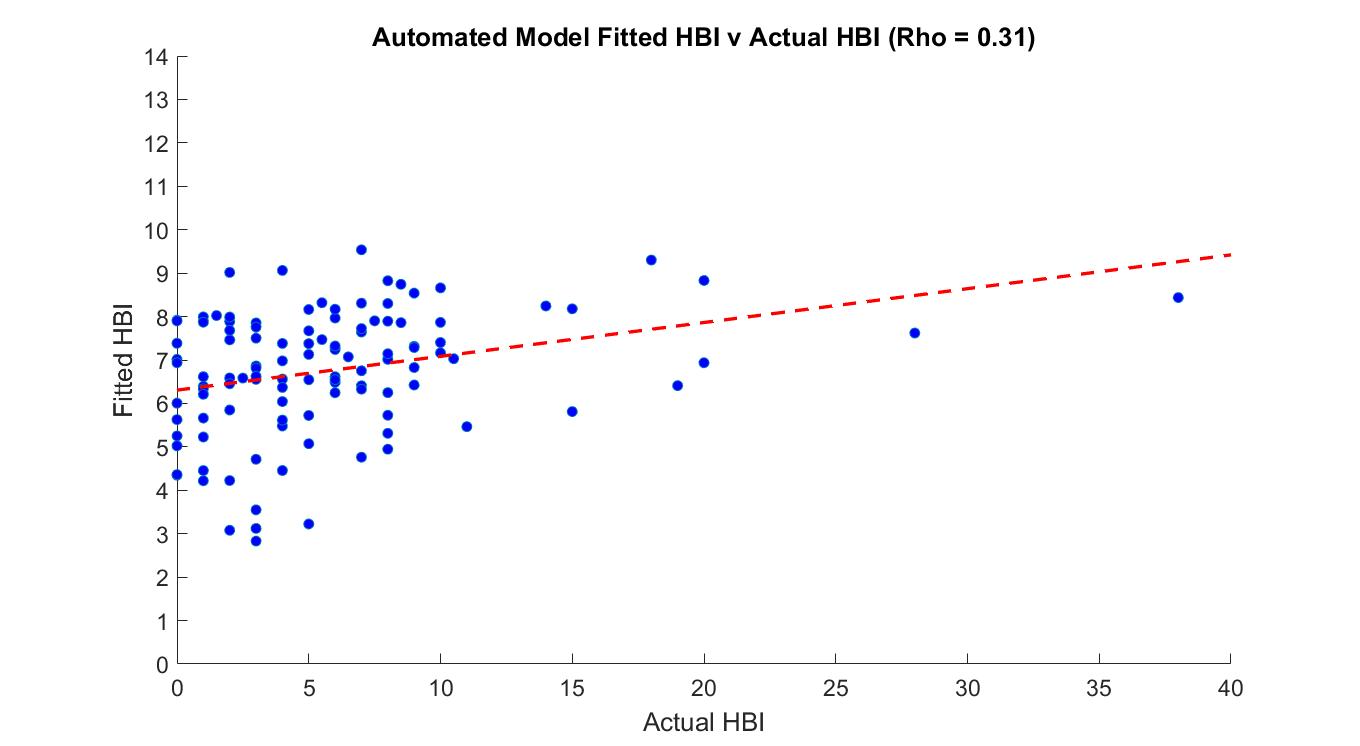
For automated metric quantification, 12 models had a significant F-statistic (P<0.05). Metrics 1 (mean motility), 2 (spatial variation) and 4 (area of activity) were the only significant predictors in these models (P<0.05). The best automated model consisted of a negative mean motility and a positive area of activity association with HBI (Adjusted R2 = 0.08) (figure 4). A model consisting of a negative spatial variation also showed an association with HBI (Adjusted R2 = 0.04).
This was also confirmed with a statically significant negative Spearman’s correlation between spatial variation and HBI (rho=-0.224, P = 0.02).
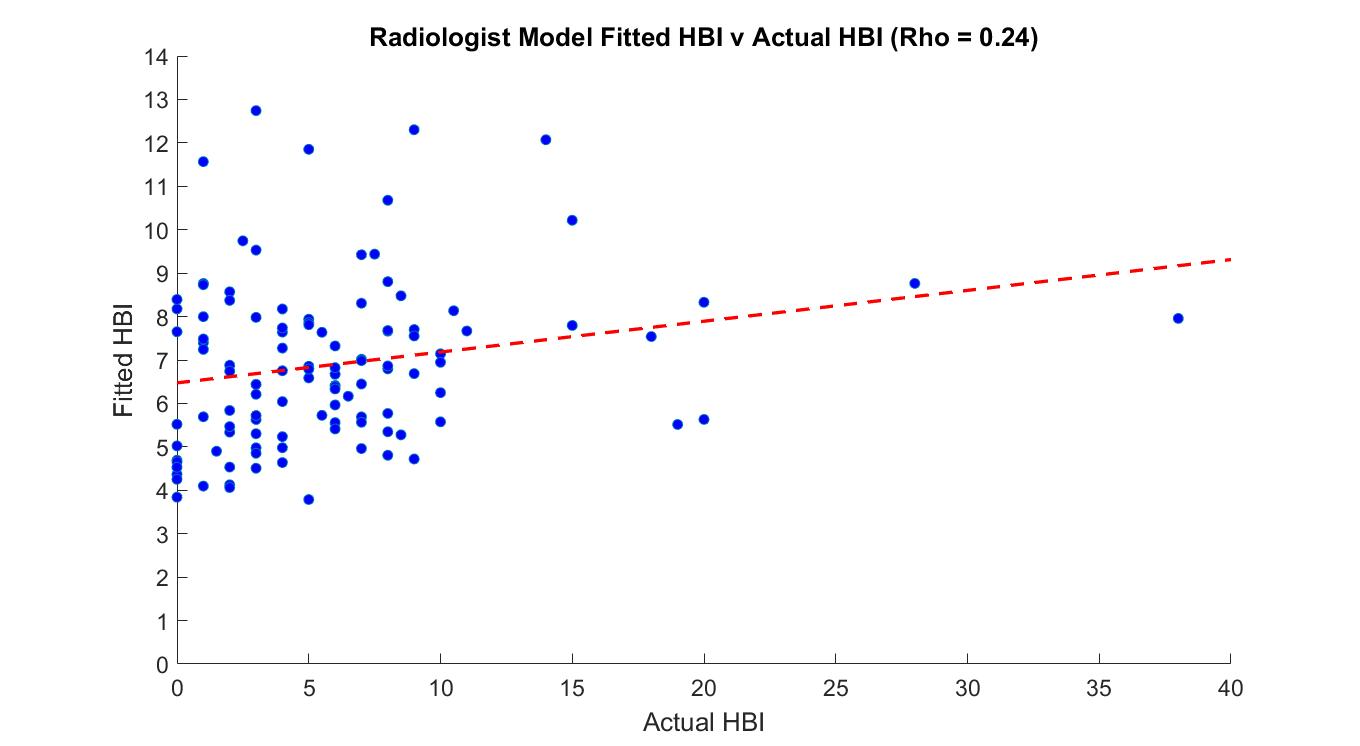
Using gradings of radiologist 1, 6 models had a significant F-statistic (P<0.05). Metrics 2 (spatial variation) and 3 (temporal variation) were the only significant predictors in these models (P<0.05). The best performing radiologist model included a negative spatial variation and a positive temporal variation association with HBI (Adjusted R2 = 0.01) (figure 5).
None of the models from radiologist 2 or combined radiologist score demonstrated a significant relationship against HBI score.
Conclusion and Discussion
Spatial variation (metric 2) was confirmed as predictor for HBI, both when subjectively graded (radiologist 1) and when automatically quantified by software. This partially validates previous single-site data5, and lends support to the observation that impaired coordination in the bowel is linked to abdominal symptoms.
The “goodness of fit” was better for automated than radiologist models (figure 4-5), but neither were particularly strong. A new observation was that mean motility (metric 1) and area of activity (metric 4) in combination were linked to symptoms suggesting an interaction between both metrics could predict symptom scores better than an individual metric alone could.
Acknowledgements
This work is supported by the EPSRC-funded UCL Centre for Doctoral Training in Medical Imaging (EP/L016478/1) and the Department of Health’s NIHR-funded Biomedical Research Centre at (University College London Hospital)
EU VIGOR++ funding
References
1. Peyrin-Biroulet, L., Loftus, E. V, Colombel, J.-F. & Sandborn, W. J. The natural history of adult Crohn’s disease in population-based cohorts. Am. J. Gastroenterol. 105, 289–297 (2010).
2. Gomollón, F. et al. 3rd European Evidence-based Consensus on the Diagnosis and Management of Crohn’s Disease 2016: Part 1: Diagnosis and Medical Management. J. Crohn’s Colitis 11, 3–25 (2017).
3. Makanyanga, J. C. et al. Evaluation of Crohn’s disease activity: initial validation of a magnetic resonance enterography global score (MEGS) against faecal calprotectin. Eur. Radiol. 24, 277–287 (2014).
4. Harvey, R. F. & Bradshaw, J. M. A simple index of Crohn’s-disease activity. Lancet 315, 514 (1980).
5. Menys, A. et al. Aberrant Motility in Unaffected Small Bowel is Linked to Inflammatory Burden and Patient Symptoms in Crohn’s Disease. Inflamm. Bowel Dis. 22, 424–432 (2016).
6. Naziroglu, R. E. et al. Semi-automatic bowel wall thickness measurements on MR enterography in patients with Crohn’s disease. Br. J. Radiol. 90, 20160654 (2017).
7. Odille, F. et al. Quantitative assessment of small bowel motility by nonrigid registration of dynamic MR images. Magn. Reson. Med. 68, 783–793 (2012).
Figures