2481
Tumor necrosis factor (TNF) antagonist therapy in small bowel Crohn’s disease (CD): association of the apparent diffusion coefficient (ADC) with treatment response.1Radiology, LSUHSC New Orleans, New Orleans, LA, United States, 2Internal Medicine, LSUHSC New Orleans, New Orleans, LA, United States, 3School of Medicine, LSUHSC New Orleans, New Orleans, LA, United States, 4LSU, Baton Rouge, LA, United States, 5Gastroenterology, LSUHSC New Orleans, New Orleans, LA, United States
Synopsis
Diffusion weighted imaging (DWI) has proven beneficial in the assessment of disease activity and therapeutic response in a myriad of pathology. Studies have shown an inversely proportional correlation between bowel inflammation in Crohn’s disease (CD) and apparent diffusion coefficient (ADC) values of involved bowel wall. This beckons an intriguing opportunity for gauging treatment response, particularly with respect to some of the most commonly used agents, tumor necrosis factor (TNF) antagonists. This study retrospectively measured the ADC value of affected small bowel segments before and after anti-TNF infusion therapy and compares it to the clinical response in patients with active CD.
INTRODUCTION
TNF antagonist therapy has transformed the
treatment of CD yielding a better quality of life for a great number of
patients. As such, the preservation and monitoring of a favorable treatment
response is essential in effective disease management. 1 MR enterography
(MRE) has become a key clinical tool in CD surveillance. Diffusion weighted
imaging (DWI), in particular, has been a focal point in the investigation of
its utility as a metric for disease activity in both contrast enhanced and
noncontrast MR exams. 2,3 Nonetheless, evaluation of ADC values in
association with TNF antagonist therapy is scarce within the literature. 4
Therefore, the purpose of our study was to evaluate the performance of ADC
values in affected small bowel segments in prediction of disease response to
TNF antagonist treatment in patients with CD. METHODS
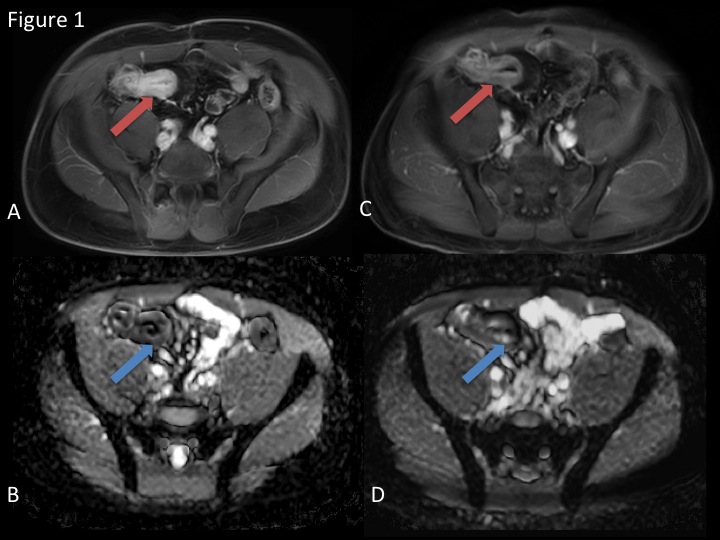
Eight patients (mean age 45.5 year, M=4, F=4) with CD who underwent MRE before and following TNF antagonist therapy were identified retrospectively by a non- image interpreting investigator through the electronic medical record. After standard oral preparation using VoLumen (E-Z-Em), patients underwent MR imaging at 3 T (Ingenia, Philips) using steady state free precession, single shot fast spin echo state, fat suppressed T2-weighted, DWI (0, 500, and 1000 sec/mm 2), and pre- and post dynamic contrast enhanced TI-weighted (THRIVE) sequences. Two body-trained radiologists reviewed the THRIVE sequences and identified the most actively inflamed segment of small bowel by virtue of greatest relative mural thickness and enhancement, in consensus. Segments were then localized on the ADC map and intramural ADC values were recorded. ADC values were compared before and following treatment for statistical significance. Post-treatment values were also compared to outcomes as verified by the endoscopic and clinical findings of the caring gastroenterologist.RESULTS
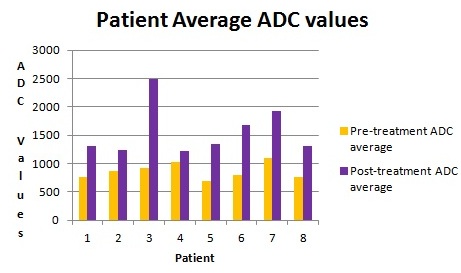
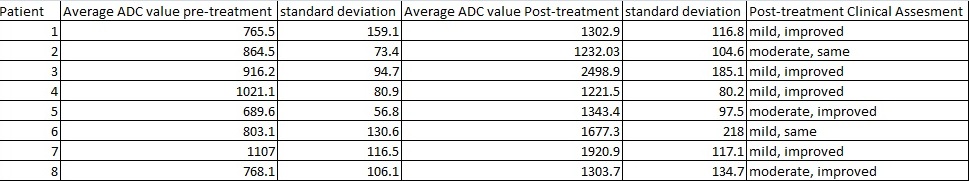
All eight patients had a statistically significant increase in ileal intramural ADC value between pre- and post-treatment MRE scans (see Tables 1 & 2). Six of eight patients were determined to have improved clinically, and the two other patients had no change clinically (see Table 2). The data accurately predicted an improvement in patients’ clinical manifestations of disease 75% of the time.DISCUSSION
There is a statistically significant difference between pre- and post- treatment ADC values within the wall of distal small bowel affected by active CD. However, due to the limited number of patients included in this study it is difficult to make claims regarding the response to treatment clinically.
CONCLUSION
In this preliminary study, intramural ADC was significantly different between distal ileal segments of bowel affected by Crohn's disease before and following tumor necrosis factor antagonist therapy. These results may have merit in validating ADC value as a biomarker for disease activity in Crohn’s patients treated with anti- tumor necrosis factor agents.
Acknowledgements
We would like to thank University Medical Center New Orleans' Inflammatory Bowel Disease Clinic and multidisciplinary team for providing the care necessary to conduct this research.References
1. Lopetuso LR, Gerardi V, Papa C, et al. Can We Predict the Efficacy of Anti-TNF agents?. Int J Mol Sci 2017; 18(9):1973.
2. Dohan A, Taylor S, Hoeffel C, et al. Diffusion-weighted MRI in Crohn's disease: Current status and recommendations. J. Magn. Reson. Imaging 2016; 44:1381 – 1396.
3. Park SH. DWI at MR Enterography for Evaluating Bowel Inflammation in Crohn Disease. Am J Roentenol 2016; 207: 40 – 48.
4. Bhatnagar G, Dikaios N1, Prezzi D, et al. Changes in Dynamic Contrast-Enhanced Pharmacokinetic and Diffusion-Weighted Imaging Parameters Reflect Response to Anti-TNF therapy in Crohn’s Disease. British Journal of Radiology 2015; 88(1055): 20150547.
Figures