2480
Quantifying Regional Lung Function in Interstitial Lung Disease with Hyperpolarized Xenon-129 3D SB-CSI1University of Virginia, Charlottesville, VA, United States, 2University of Florida, Gainesville, FL, United States, 3University of Missouri, Columbia, MO, United States
Synopsis
In this study, lung ventilation and gas uptake/exchange was assessed in healthy and interstitial lung disease (ILD) subject populations using 3D Single-Breath Chemical Shift Imaging, a combination of MR spectroscopic imaging and hyperpolarized xenon-129 gas imaging. By probing metrics such as Tissue/RBC, Tissue/Gas, RBC/Gas, T2* and chemical shifts in lung parenchyma and red blood cells, we find statistically significant distinctions in the lung physiology between healthy and ILD subjects.
Introduction
Lung ventilation, as well as gas uptake and exchange, can be assessed with MRI in a single breath hold on a voxel-by-voxel basis using 3D Single-Breath-hold Chemical Shift Imaging (3D SB-CSI) [1]. Three distinct spectral peaks - lung parenchyma/plasma (“tissue”), red blood cells (RBC), and gas are detected using MR spectroscopic imaging while a subject holds their breath after inhaling hyperpolarized xenon-129 gas (HP Xe-129). In addition, 3D-SB CSI images can be fused with proton MR images to quantify regional lung ventilation. Investigating T2* and chemical shifts of lung tissue and RBCs could lead to further insight into lung disease physiology. Unlike other dissolved-phase imaging techniques, 3D SB-CSI enables T2* and chemical shift parameters to be calculated for every lung voxel. This study compares quantified ventilation and 3D SB-CSI metrics between healthy subjects and subjects with interstitial lung disease (ILD).Methods
A total of 20 subjects, including 9 healthy (29±9 years old) and 11 ILD (66±12 years old), underwent pulmonary function tests (PFT) and MR imaging using 3D SB-CSI and 2D gradient echo imaging (GRE), with each subject inhaling a pre-calculated volume of HP Xe-129 and holding their breath during the <9 second acquisition. All images were acquired on a 1.5T clinical MR system (Avanto, Siemens Medical Solutions) with a transmit/receive RF coil (Clinical MR Solutions) tuned to the Xe-129 frequency. A commercial Xe-129 polarizer brought enriched (~86%) Xe-129 to ~35% polarization. The 3D SB-CSI sequence parameters were, TR/TE: 23.3ms/1.0ms, matrix: 128x128x8 voxels (after in-plane interpolation), FOV: 280-320mm2, and slice thickness: 20-25mm. 3D SB-CSI images were post-processed in MATLAB (Mathworks, Natick, MA) using the method described in [2], and the ANTs package was used to segment and analyze 2D GRE images [3]. Statistical significance was calculated using the Mann-Whitney U-test. This study used part of the data from a previous study [4], but also using a more thorough and robust post-processing technique.Results and Discussion
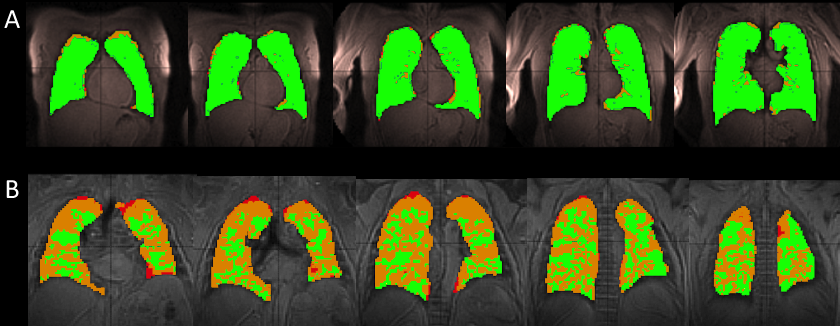
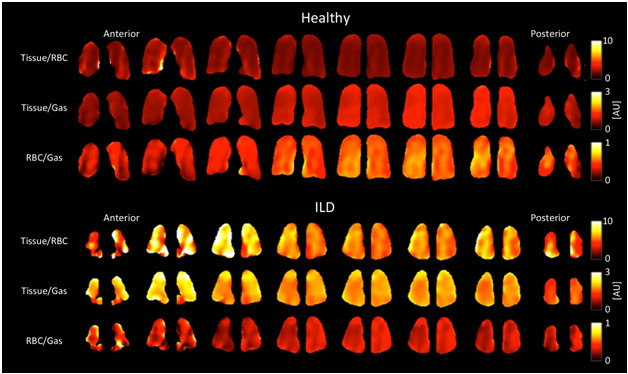
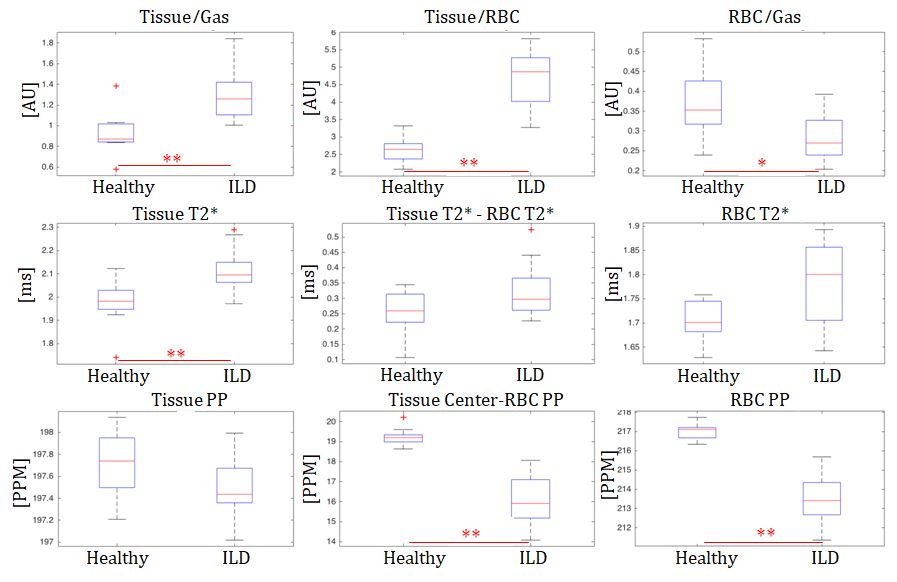
Ventilation analysis shows that ILD subjects had significantly larger volumes of ventilation defects (no ventilation or hypoventilation), comprising an average of 34.1 ± 6.4% of their total lung volume, than healthy subjects (p < 0.01) (Fig. 1). 3D SB-CSI image analysis shows that the average Tissue/Gas ratio was significantly higher in ILD subjects, 1.31 ± 0.26, than in healthy subjects, 0.93 ± 0.22, (p < 0.01). The average RBC/Gas ratio was significantly lower in ILD subjects, 0.28 ± 0.06, than in healthy subjects, 0.37 ± 0.09, (p < 0.01). The average Tissue/RBC was significantly higher in ILD subjects, 4.71 ± 0.81, than in healthy subjects, 2.63 ± 0.37, (p < 0.01) (Figs.2, 4).
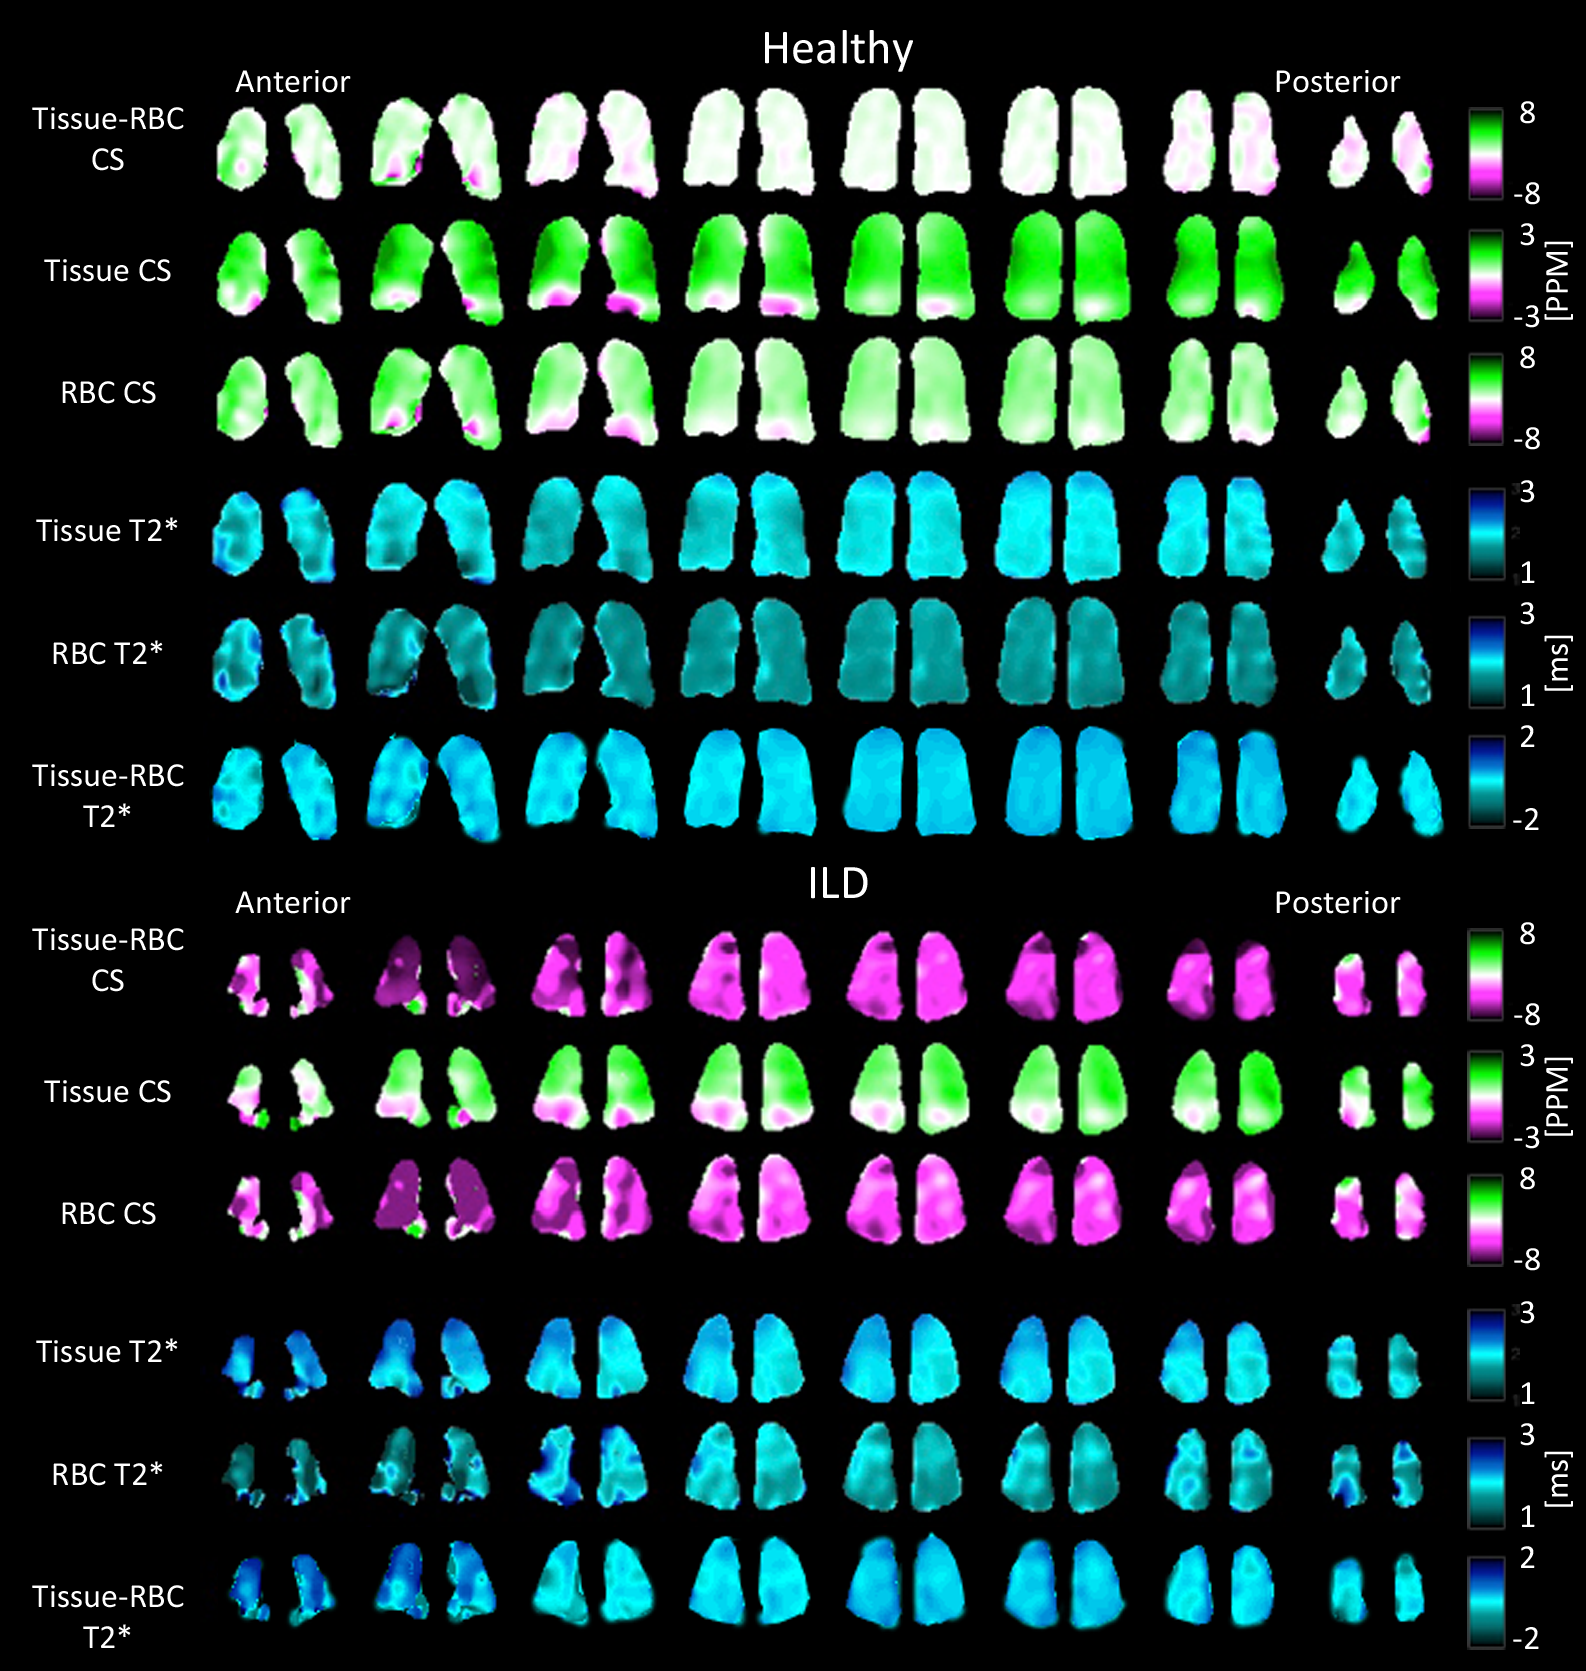
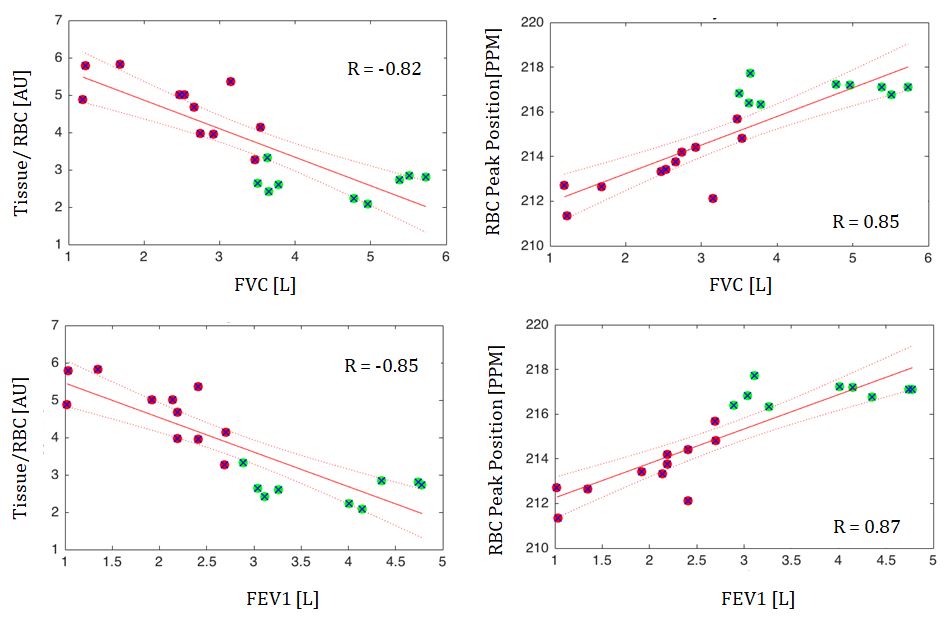
ILD subjects had a significantly larger average tissue T2*, 2.12 ± 0.09 ms, than healthy subjects, 1.97 ± 0.11 ms, (p < 0.01) (Fig 3). ILD subjects also had a significantly lower RBC peak position, 213.5 ± 1.3 ppm, than healthy subjects, 217.0 ± 0.4 ppm. The tissue peak position was not significantly different between ILD, 197.5 ± 0.3, and healthy, 197.7 ± 0.3, subjects (Figs. 3, 4), indicating that an ILD signature may be the shift of the RBC peak towards the tissue peak. It is interesting that the variances of most 3D SB-CSI metrics are larger in ILD subjects than healthy subjects, as illustrated in Figures 3 and 4 where heterogeneities appear more prominently in the ILD subject. Tissue/RBC and RBC peak position correlate strongly with PFT results (Fig. 5). The correlation coefficient between forced vital capacity (FVC) and Tissue/RBC is R=-0.82; between FVC and RBC peak, R=0.85; between forced expiratory volume in one second (FEV1) and Tissue/RBC, R =-0.86; and between FEV1 and RBC peak, R=0.87. The trends discussed here are consistent with other groups [5] as well as with our own previous analysis [4].
Conclusion
HP Xe-129 3D-SBCSI provides unique information, such as T2* and chemical shifts, for every voxel interrogated, which help assess regional lung ventilation and gas exchange non-invasively. A comparison between ILD and healthy subjects demonstrates statistically significant characteristic differences between the two groups. This method can be expanded to analyze regional distinctions and parameters in other pulmonary diseases, such as cystic fibrosis, asthma, and COPD.Acknowledgements
Supported by NIH grant R01 CA172595-01 and Siemens Medical Solutions.References
[1] Mata J. ISMRM, Stockholm, 2010. [2] Guan et al. ISMRM, Singapore, 2016. [3] Tustison, N. et al., MRI 2011. [4] Mata J. ISMRM, Honolulu, Hawai'i, United States, 2017. [5] Wang J. Thorax, 2017: 0:1-8.Figures