2478
Hyperpolarized 129Xe gas and ultra-short echo MRI for evaluation of structure-function correlates in cystic fibrosis lung disease: a comparison of analysis methods1Radiology and BioEngineering, University of Missouri, Columbia, MO, United States, 2Center for Pulmonary Imaging Research, Cincinnati Children's Hospital, Cincinnati, OH, United States, 3Radiology, Cincinnati Children's Hospital, Cincinnati, OH, United States, 4Pulmonary Medicine, Cincinnati Children's Hospital, Cincinnati, OH, United States
Synopsis
A number of techniques for analysis of hyperpolarized gas (HPG) images have emerged and demonstrated sensitivity to lung disease severity. However, the precise extent of lung function decline due to specific pathologies associated with obstructive lung disease has not been established. Here we have performed HPG 129Xe analysis using 3 common methods from the literature (mean-anchored, percentile-anchored, and k-means methods) in order to evaluate correlations with structural pathologies identified in ultra-short echo-time (UTE) images. The presence of bronchiectasis and mucus plugging correlated best with whole-lung ventilation defect percentage (VDP). Consolidation and air-trapping demonstrated weaker (though still significant) correlation with VDP.
Introduction
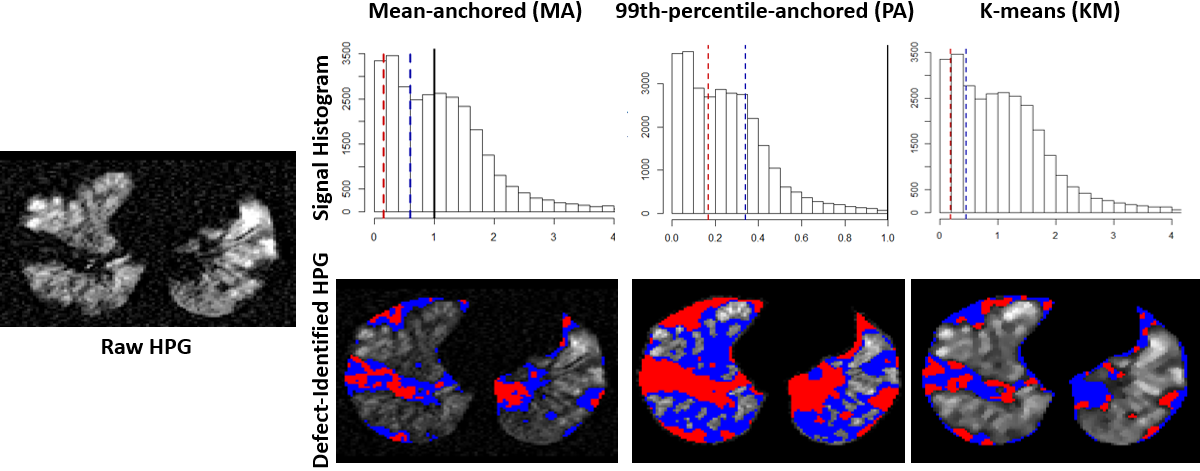
Regional pulmonary structure-function relationships can provide unique insight into disease physiology and pathogenesis, but methods of quantifying these relationships differ among different investigators. Hyperpolarized gas (HPG) MRI (3He and 129Xe) of the lung is a technique which can assess regional lung function with great sensitivity1. A number of clinical trials are underway, and HPG will likely soon become a more widely-used research modality with potential for clinical use2. Ultra-short echo-time (UTE) MRI has been shown to reveal structural abnormalities in lung disease with diagnostic sensitivity comparable to that of CT without ionizing radiation3,4. HPG and UTE MRI provide complementary regional structural and functional information and may be used together to assess the relationship between lung function decline and structural abnormalities. Cystic fibrosis (CF) is a well-understood genetic disease in which common structural abnormalities associated with obstructive lung disease develop and cause downstream impairment of lung function5. The information contained in UTE images present a unique opportunity to regionally attribute ventilation impairment to specific structural pathologies (Figure 1), but rigorous ventilation quantification is important to achieve physiological relevance. Several methods of HPG signal quantification have been proposed by experts in the field which segment signal intensity into bins deemed physiologically relevant6-9. In this work we performed 129Xe HPG defect analysis on 22 subjects (5 controls, 17 CF patients) using three common defect segmentation algorithms: mean-anchoring (MA), 99th-percentile-anchoring (PA), and k-means clustering (KM) – each of which yields signal intensity ‘bins’ used to define ‘complete’ and ‘incomplete’ defect percentages (CDP and VDP respectively). For each analysis method the number of identified pathologies for each subject was correlated with subject VDP and CD.Methods
5 control subjects (ages 6-16 years) and 17 CF patients (ages 6-46 years) were imaged via UTE MRI (TR/TE=5.78ms/0.2ms, Flip Angle=5°, Voxel Size=1.39x1.39x4mm3) and HPG MRI (FA=10°-12°, TR/TE=8ms/4ms, Voxel size=3x3x15 mm3). Two radiologists independently identified regions of bronchiectasis, bronchial wall thickening, mucus plugging, air trapping, and consolidation in the UTE images. HPG images were analyzed using 3 different methods. First, in the mean-anchored method (MA) parenchymal HPG signal was normalized to the whole-lung signal mean; VDP and CDP regions were defined as signal <60% and <15% of the mean respectively6. In the 99th-percentile-anchored method (PA) HPG lung and airway signal was normalized to the 99th-percentile value; signal below the control-group-mean minus 1 or 2 standard deviations defined VDP and CDP regions respectively7. In the third method 4-bin k-means (KM) clustering was used to segment HPG signal. The lowest of these 4 bins defined the VDP region; this bin was further k-means-clustered to find CDP (lowest 2 bins of another 4-bin segmentation)8,9. Figure 2 presents representative signal histograms of each method and corresponding HPG images with defects identified in the same image slice. The number of specific pathologies identified by radiologists (bronchiectasis, bronchial wall thickening, mucus plugging, air trapping, and consolidation) were compared with VDP/CDP from each method to identify Pearson correlates.Results
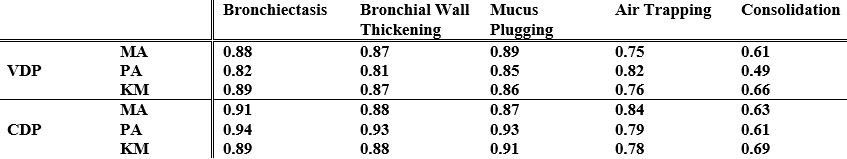
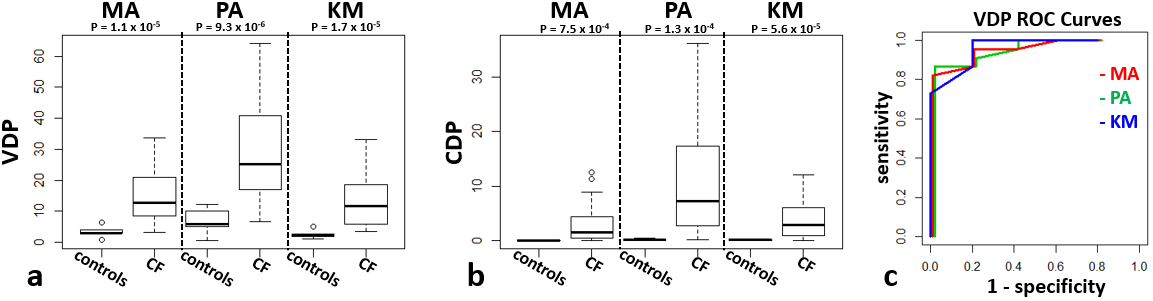
For the PA-method, mean±sd signal for controls was 0.52±0.17; thus the VDP and CDP thresholds were <0.34 and <0.17 respectively. All Pearson correlation data are given in Figure 3. Strong correlations were found between all 3 methods for VDP (rMA-PA=0.97, rPA-KM=0.96, rKM-MA=0.98) and CDP (rMA-PA=0.95, rPA-KM=0.97, rKM-MA=0.90); however PA demonstrated higher VDP and CDP on average than MA or KM (Figure 4). Each method showed significant differences between control and CF groups for VDP and CDP (Figure 5). The number of defects due to mucus plugs correlated best with VDP for MA and PA methods (rMA=0.89, rPA=0.85) but the number of defects due to bronchiectasis correlated best with KM method (rKM=0.89, all p-values <10-6). The opposite was true for CDP: MA and PA methods gave the best correlations between bronchiectasis and CDP (rMA=0.91, rPA=0.94), and mucus plugging correlated best with KM (rKM=0.91).Conclusions
HPG ventilation defects with regionally matched structural pathologies seen in UTE can be measured and are highly correlated. Bronchiectasis and mucus plugging demonstrated the best correlations with VDP and CDP; consolidation demonstrated weakest correlation to ventilation defects. All analysis methods gave significant correlations with whole-lung VDP and CDP, and differences between controls and CF patients were significant for each method. However, differences in pathology-specific correlations among methods may indicate differing sensitivity to related ventilation decline. For instance CDF correlations for consolidation pathologies (space-filling) were higher than VDP for all methods. This may prove useful in longitudinal monitoring of individual patients, development of patient-specific treatment regimens, and may also be used to assess the efficacy of emerging treatments for CF and other spatially heterogeneous obstructive lung diseases.Acknowledgements
This work was funded by grant T32 HL 7752-23References
1. Moller HE, Chen XJ, Saam B, Hagspiel KD, Johnson GA, Altes TA, et al. MRI of the lungs using hyperpolarized noble gases. Magn Reson Med. 2002;47(6):1029-51.
2. Walkup LL, Woods JC. Translational applications of hyperpolarized 3He and 129Xe. NMR Biomed. 2014;27(12):1429-38.
3. Roach DJ, Crémillieux Y, Fleck RJ, Brody AS, Serai SD, Szczesniak RD, et al. Ultrashort Echo-Time Magnetic Resonance Imaging Is a Sensitive Method for the Evaluation of Early Cystic Fibrosis Lung Disease. Annals of the American Thoracic Society. 2016;13(11):1923-31.
4. Roach DJ, Cremillieux Y, Serai SD, Thomen RP, Wang H, Zou Y, et al. Morphological and quantitative evaluation of emphysema in chronic obstructive pulmonary disease patients: A comparative study of MRI with CT. J Magn Reson Imaging. 2016;44(6):1656-63.
5. Thomen RP, Walkup LL, Roach DJ, Cleveland ZI, Clancy JP, Woods JC. Hyperpolarized 129Xe for investigation of mild cystic fibrosis lung disease in pediatric patients. J Cyst Fibros. 2017;16(2):275-82.
6. Thomen RP, Sheshadri A, Quirk JD, Kozlowski J, Ellison HD, Szczesniak RD, et al. Regional ventilation changes in severe asthma after bronchial thermoplasty with (3)He MR imaging and CT. Radiology. 2015;274(1):250-9.
7. He M, Driehuys B, Que LG, Huang YT. Using Hyperpolarized 129Xe MRI to Quantify the Pulmonary Ventilation Distribution. Acad Radiol. 2016;23(12):1521-31.
8. Kirby M, Heydarian M, Svenningsen S, Wheatley A, McCormack DG, Etemad-Rezai R, et al. Hyperpolarized 3He magnetic resonance functional imaging semiautomated segmentation. Acad Radiol. 2012;19(2):141-52.
9. Hughes PJC, Horn FC, Collier GJ, Biancardi A, Marshall H, Wild JM. Spatial fuzzy c-means thresholding for semiautomated calculation of percentage lung ventilated volume from hyperpolarized gas and 1 H MRI. J Magn Reson Imaging. 2017.
Figures