2477
SNR and Dose Requirements for Quantitative 6-Zone Analysis of Hyperpolarized (129)Xe Ventilation MRI1Department of Biomedical Engineering, Duke University, Durham, NC, United States, 2Department of Electrical and Computer Engineering, Duke University, Durham, NC, United States, 3Department of Medical Physics, Duke University, Durham, NC, United States, 4Department of Radiology, Duke University, Durham, NC, United States
Synopsis
Hyperpolarized (HP) 129Xe ventilation MRI can be used for non-invasive assessment of lung obstruction. However, the minimum 129Xe dose to obtain HP 129Xe ventilation MRI with sufficient signal-to-noise ratio (SNR) for reliable quantitative analysis has not yet been established. In this work, we introduced the reader-based six-zone analysis, which is used with 133Xe and 99mTc ventilation and perfusion scintigraphy, and applied to Rician noise degraded 129Xe ventilation MRI of COPD patients. We found that the minimum required SNR for 6-zone quantification of ventilation is 4.4±5.8 (mean±SD), which suggests a minimum required 129Xe dose equivalent of 89.2 ml for this resolution.
Introduction
Hyperpolarized (HP) 129Xe ventilation MRI is beginning to see wider adoption for non-invasive assessment of lung obstruction. Although much effort has been focused on optimizing acquisition strategies and image quality, little work has been directed towards establishing the minimum required 129Xe dose to obtain images with sufficient signal-to-noise ratio (SNR). For a given image resolution, the relationship between image 129Xe dose and image SNR is known 1. However, the required SNR depends on the diagnostic task. Here, we sought to test the SNR requirements for the simplest, yet most common quantitative analysis performed in routine clinical practice: the 6-zone quantification of relative function 2 that is used with 133Xe and 99mTc ventilation and perfusion scintigraphy to plan surgical procedures such as resections and transplants. Such 6-zone analysis can also readily be done using 129Xe ventilation MRI. This work thus seeks to evaluate the effects of 129Xe ventilation image SNR on reader-based 6-zone quantification.Methods
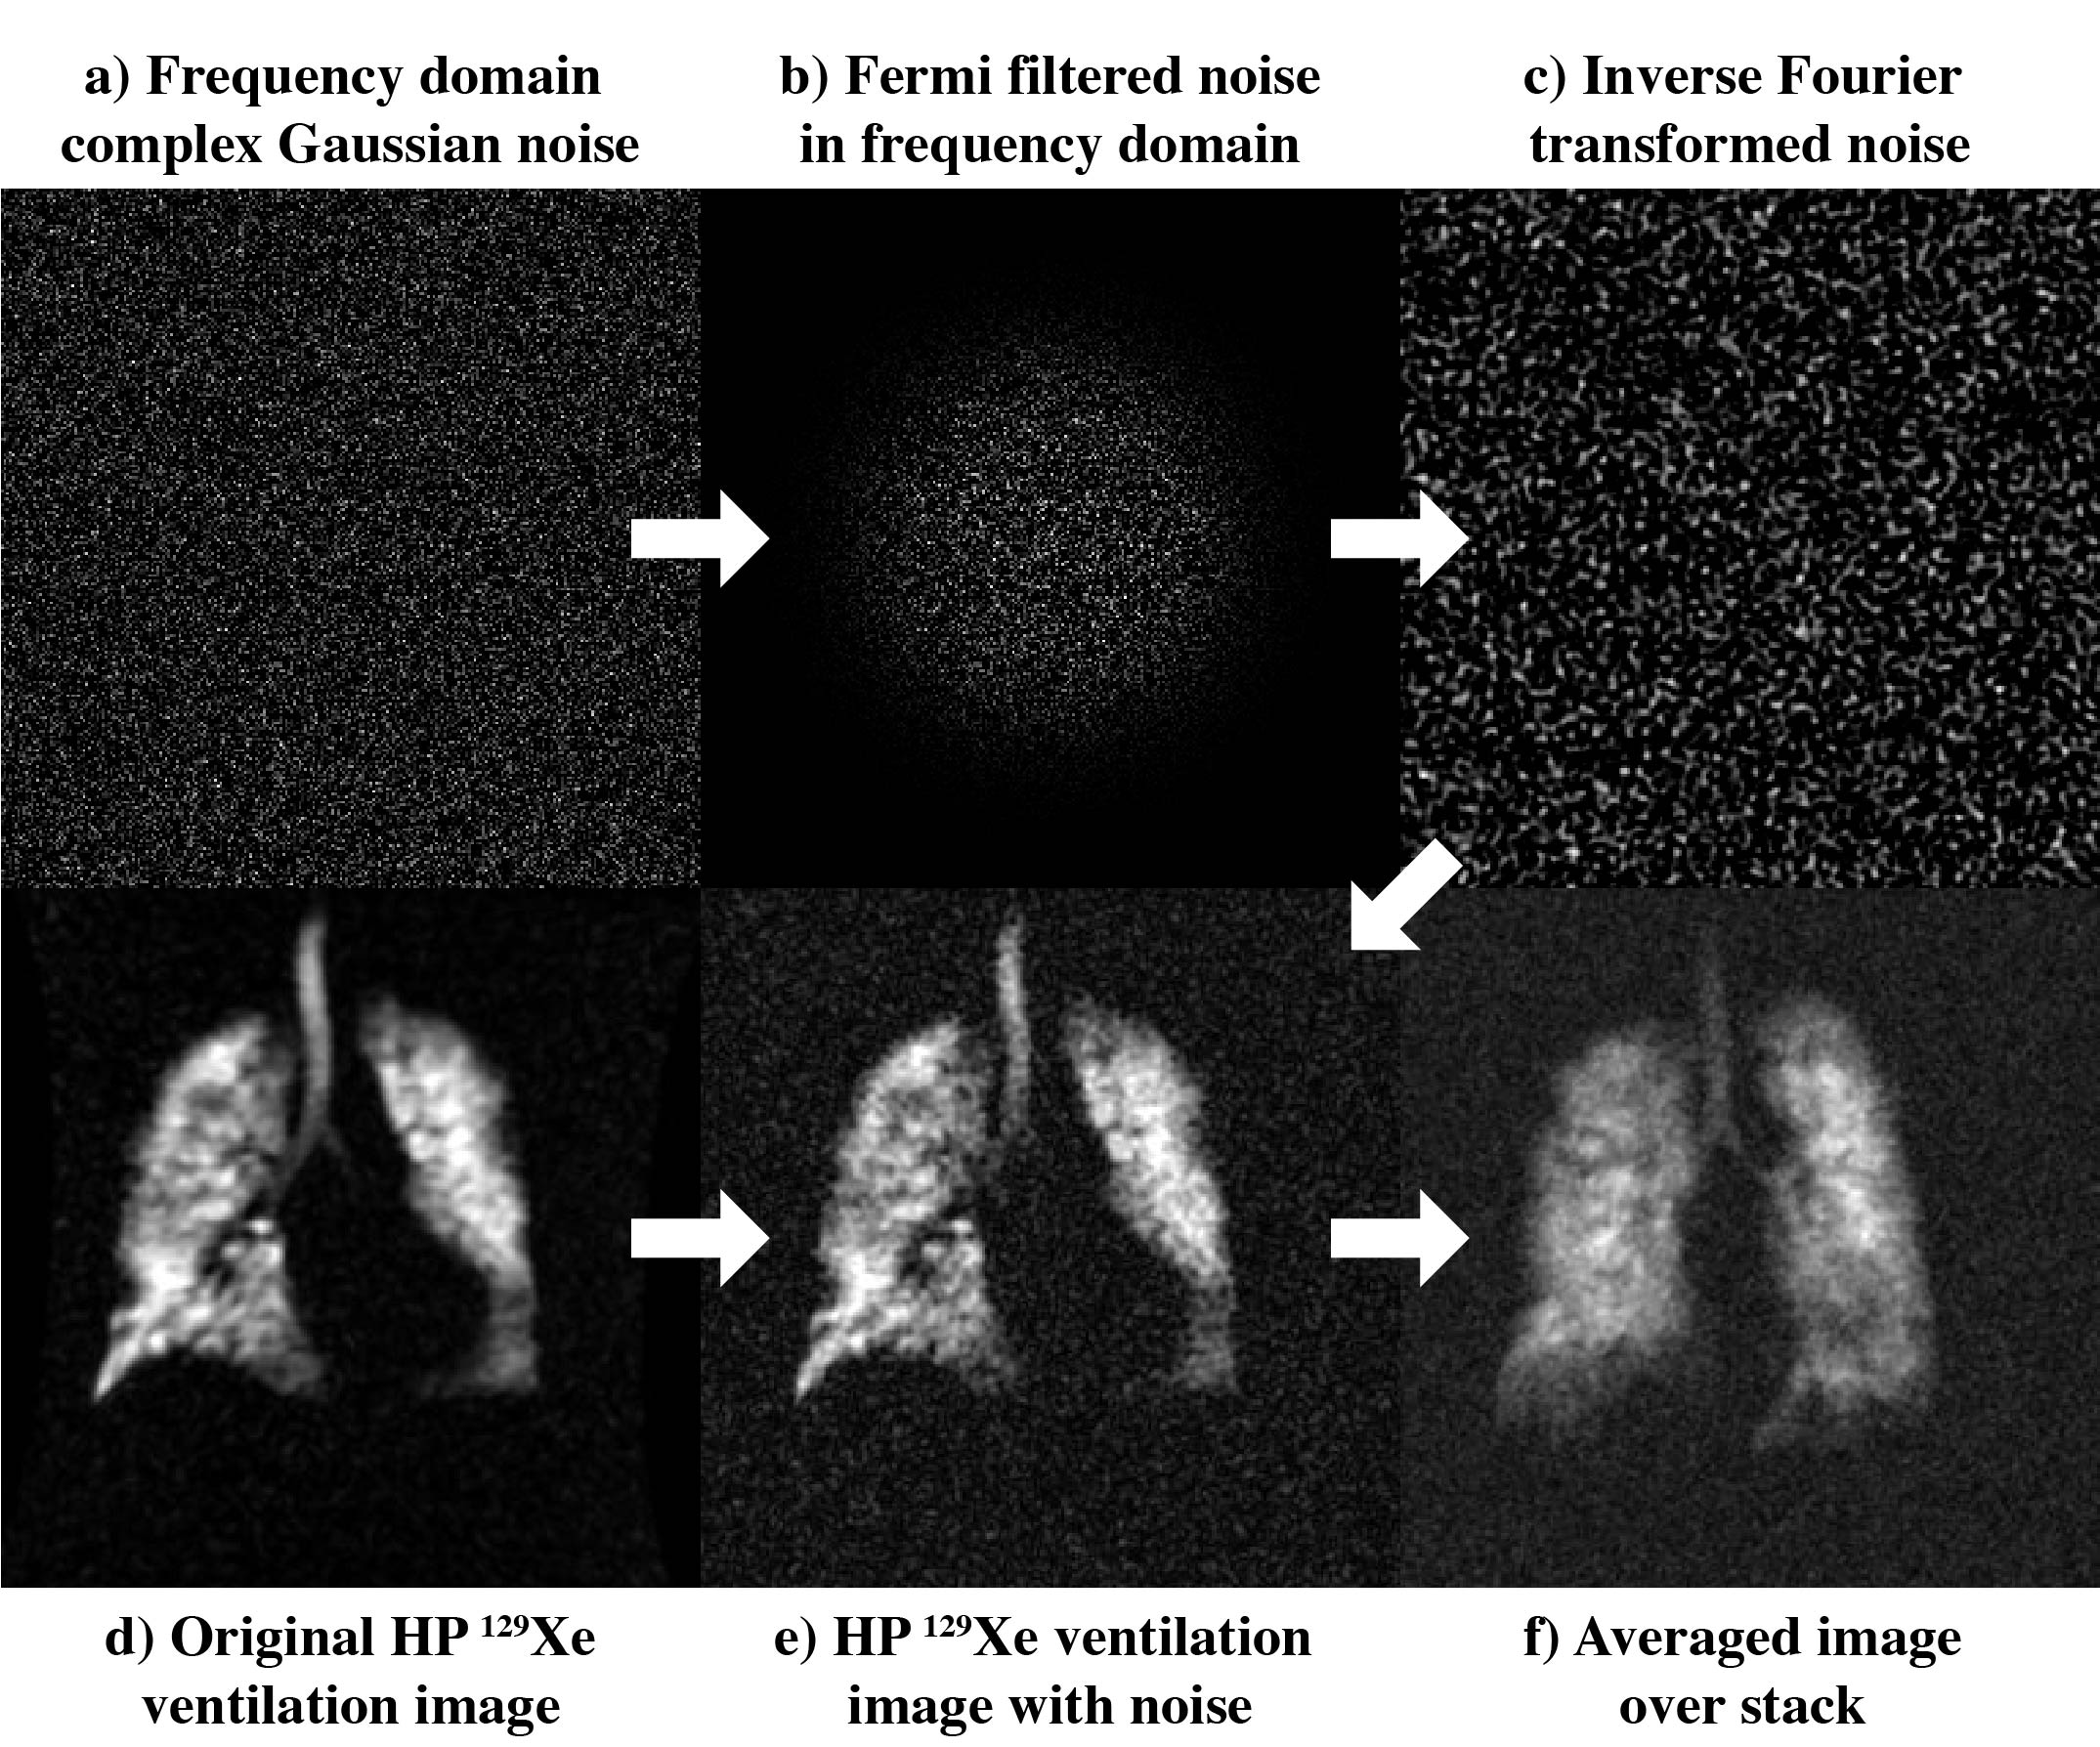
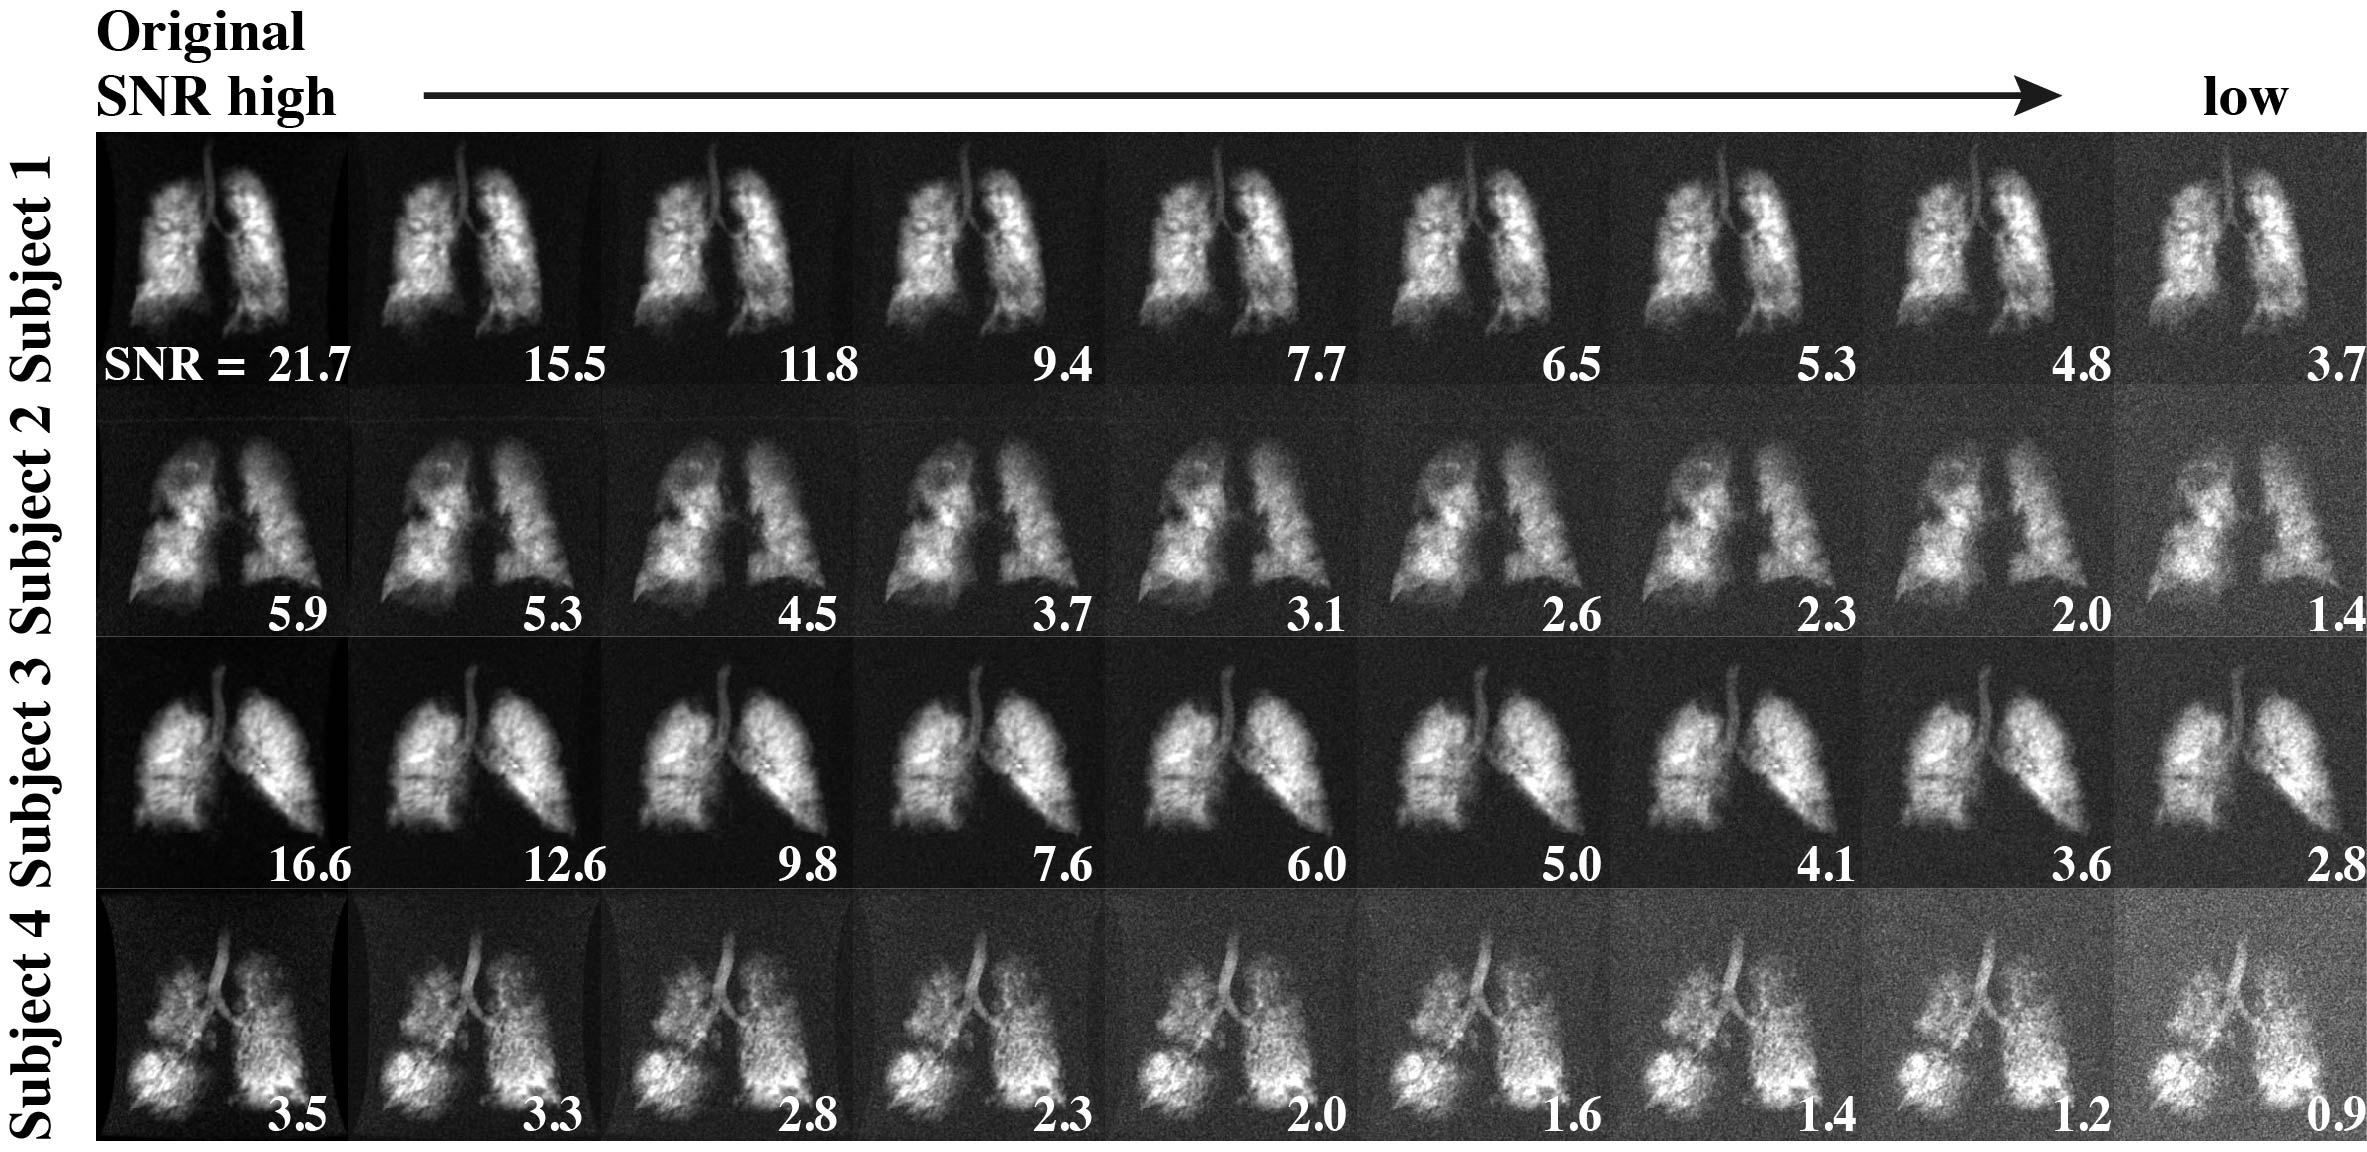
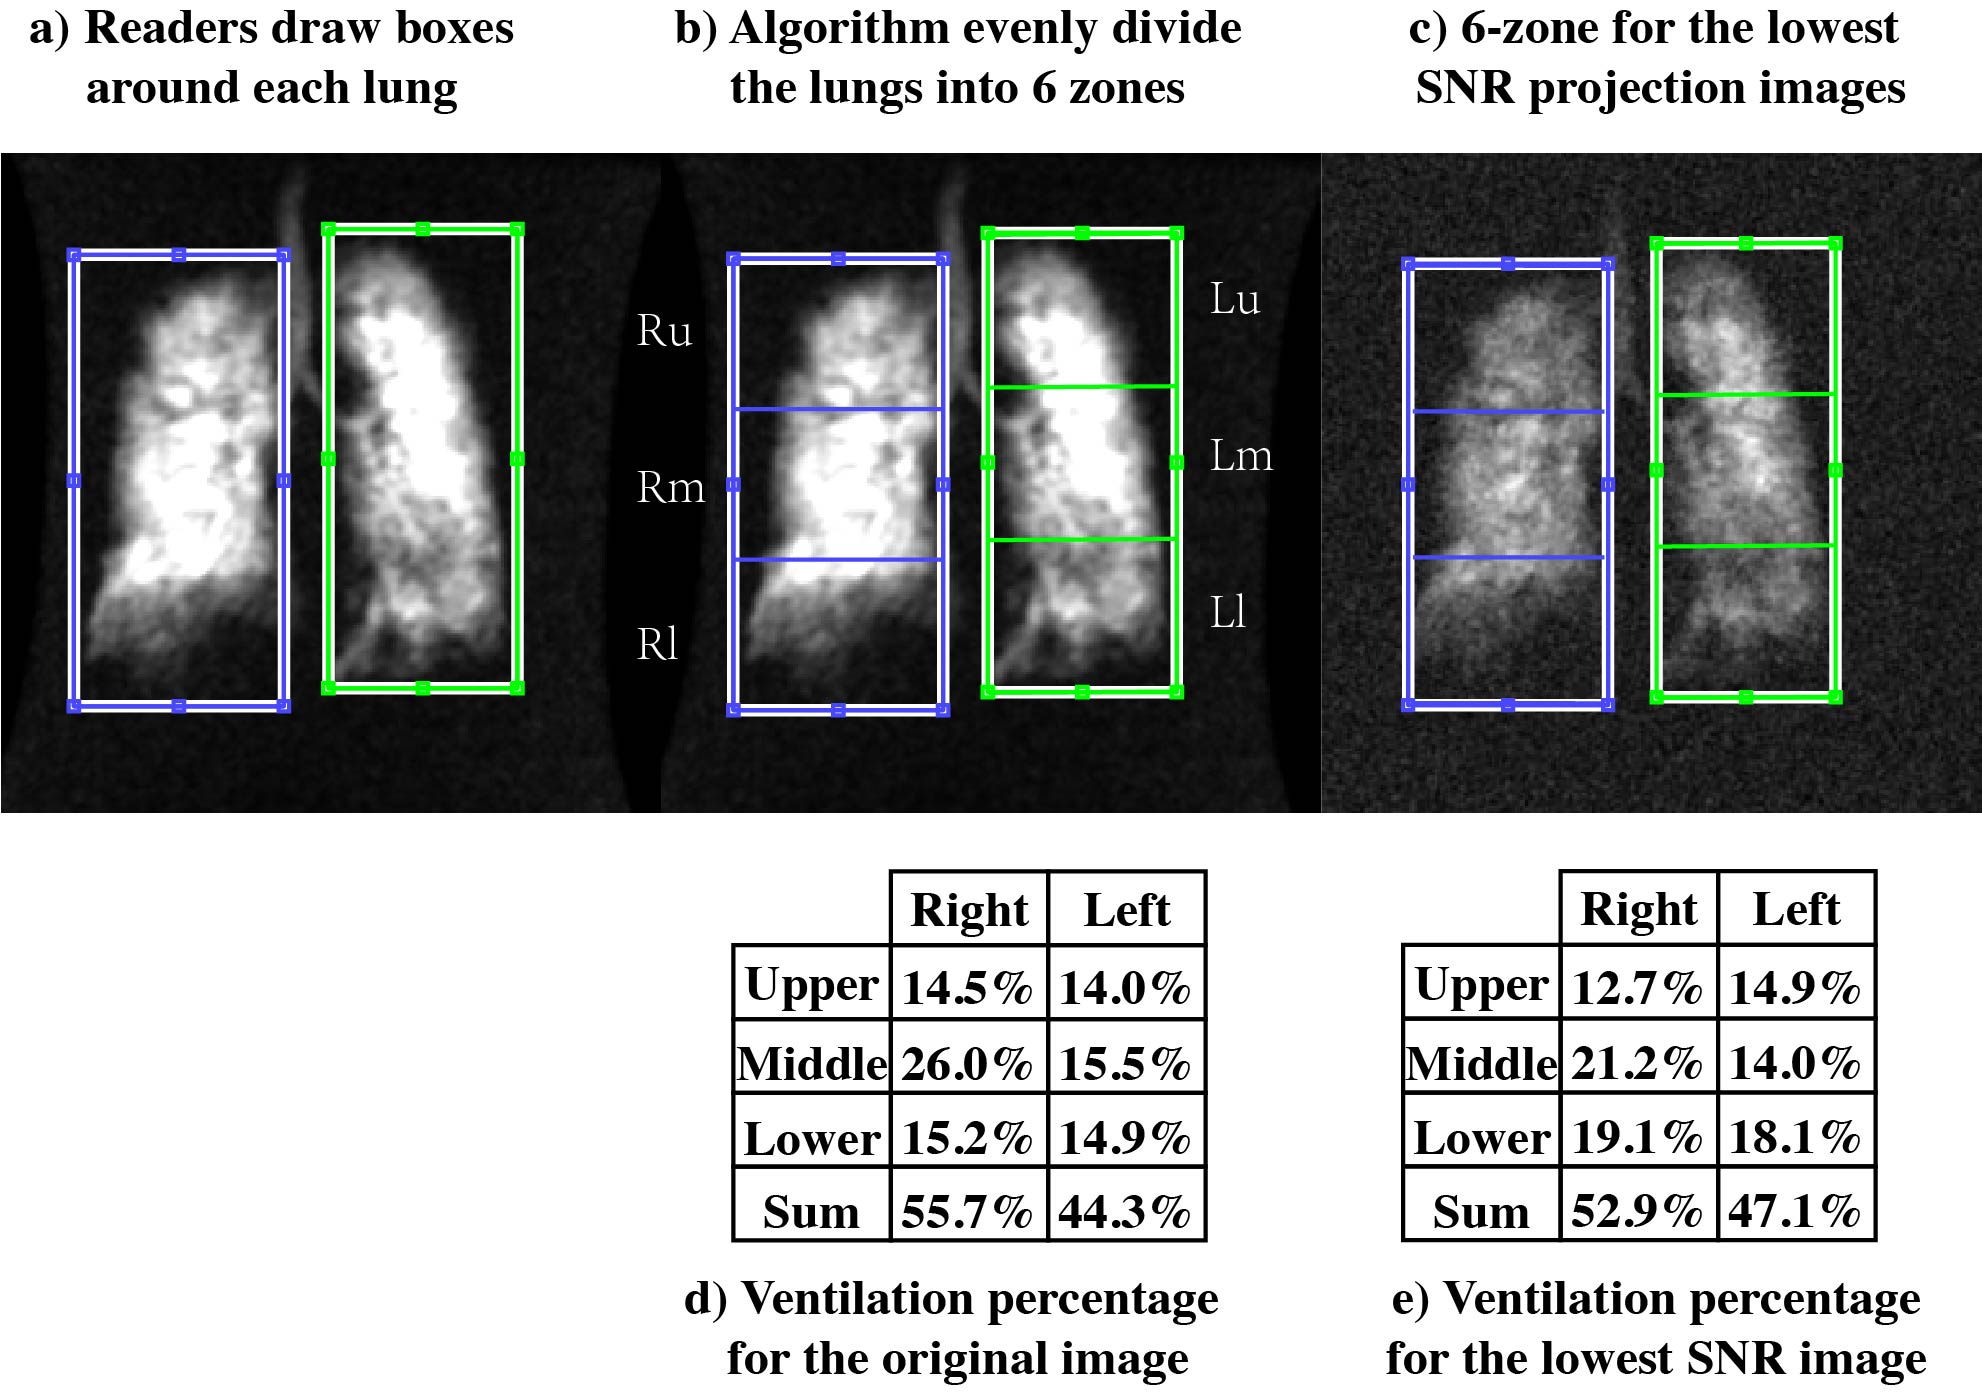
This study employed images from 8 subjects (two females, six males, mean age 66.4±4.9 years) with COPD who had undergone HP 129Xe ventilation MRI acquired with a fast, spoiled GRE sequence and a resolution of 3.1×3.1×15 mm. For each data set, 8 additional images were generated with progressively lower SNR. Given that the original images were magnitude reconstructions with a Rician noise distribution 3-5, a complex white Gaussian noise was added in the Fourier domain, with 0 mean and standard deviations ranging from 4% to 20% of the data full scale (8-bit) 6 (Fig. 1a). The noise was then Fermi-filtered with identical parameters to the original scanner reconstruction (radius 64/128, width 10/128) (Fig. 1b), Fourier transformed (Fig. 1c) and added to the original image (Fig. 1d), and a new magnitude reconstruction was generated (Fig. 1e). Because the standard 6-zone surgical quantification is based on a single coronal projection only, the image stacks were averaged (Fig. 1f). Each of the 8x9 datasets (Fig. 2) were randomized and one SNR-variant of each was distributed to 9 blinded readers who conducted the 6-zone quantification (Fig. 3a). As per the standard, readers positioned rectangular boxes encompassing the right and left lung. The algorithm then equally divided each lung into upper, middle, and lower regions (Fig. 3b-c). In this way, the percentage of ventilation contributed by each zone is calculated as well as the sum for the right and left lung (Fig. 3d-e). By convention, these add to 100%. The results for each reduced-SNR scan were compared to those from the original scan, which was considered the gold standard. When ventilation deviated by more than ±5% for any of the six zones, SNR was considered inadequate 7.Results
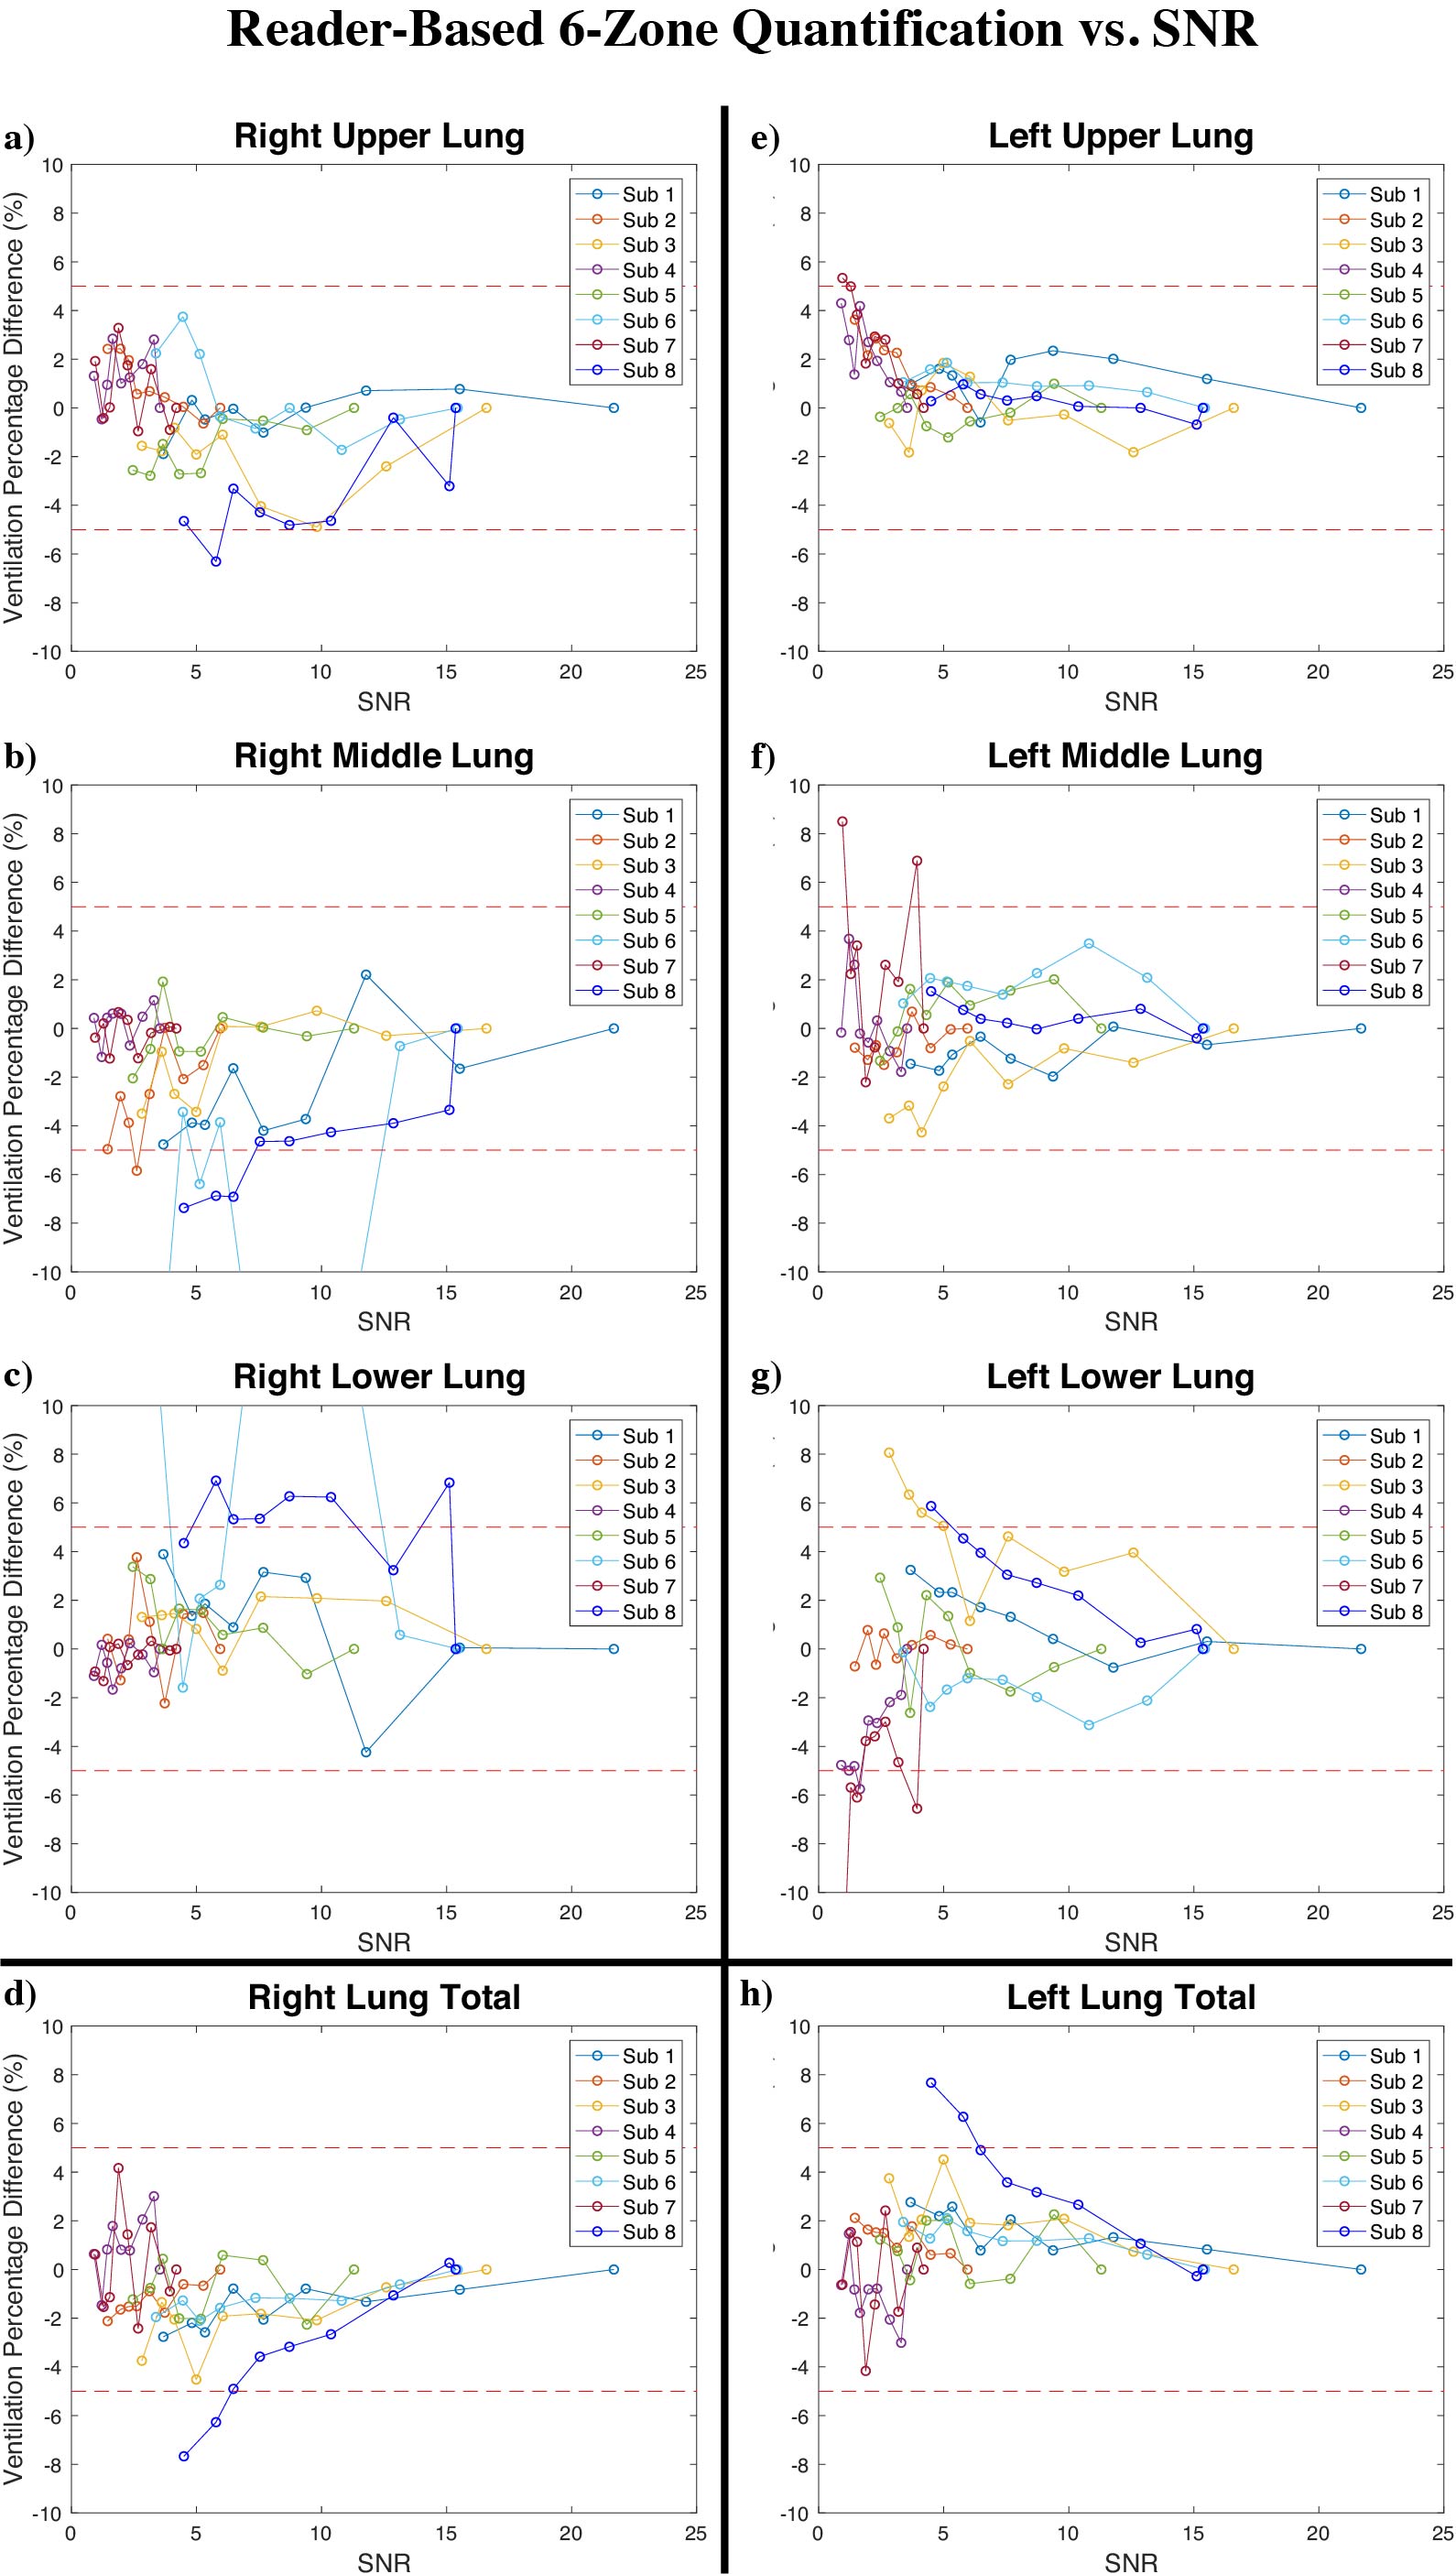
The original image stacks had a mean SNR = 11.8±6.6, and after degradation, the noisiest images had SNR = 2.5±1.3. The ventilation percentages of each zone range from a low of 6.6% to high of 35.5%, with the right middle lobe possessing the highest function with a mean of 21.7±9.3%. Figure 4 shows how the relative 6-zone ventilation percentage derived from each patient changes with SNR relative to the original image. As SNR decreases, the relative percentages begin to vary. By requiring quantification from each zone to fall within 5% of the original image, we find a minimum tolerable SNR of 4.4±5.8 among all the subjects. Taking the mean plus two standard deviations suggests an SNR threshold of 16.0.Discussion
This work introduces a means to determine the minimum SNR and dose required for 129Xe ventilation MRI to be used for the common clinical task of 6-zone quantification. For this task, the primary effect of reduced SNR is that it impairs the readers’ ability to identify the lung boundaries. This becomes particularly challenging in COPD subjects with poor ventilation in the upper or lower zones. As readers miss the lung boundaries, the ventilation percentage calculations become inaccurate. This appears to be somewhat less problematic in lungs where 129Xe signal is relatively homogeneously distributed. Thus, for the common clinical task of six-zone quantification, the SNR threshold is 16.0. Accounting for the previously reported normalized SNR of 1.9 ml-2 1 and the $$$\sqrt{2-\frac{\pi}{2}}$$$ Rician noise SNR scaling factor 4, a 129Xe dose equivalent of 89.2 ml is required for this resolution. Noticeably, readers used only the 129Xe ventilation scans to delineate lung boundaries. It is likely that lower SNR thresholds could be tolerated if the 129Xe MRI were registered to a thoracic cavity image as is commonly acquired.Acknowledgements
R01HL126771, R01HL105643, P41 EB015897, Gilead Sciences, Duke MITPReferences
1. He M, Robertson SH, Kaushik SS, Freeman MS, Virgincar RS, Davies J, Stiles J, Foster WM, McAdams HP, Driehuys B. Dose and pulse sequence considerations for hyperpolarized (129)Xe ventilation MRI. Magn Reson Imaging 2015;33(7):877-885.
2. Ball Jr W, Stewart P, Newsham L, Bates D. Regional pulmonary function studied with xenon133. Journal of Clinical Investigation 1962;41(3):519.
3. Henkelman RM. Erratum: Measurement of signal intensities in the presence of noise in MR images [Med. Phys. 12, 232 (1985)]. Medical Physics 1986;13(4):544-544.
4. Gudbjartsson H, Patz S. The rician distribution of noisy mri data. Magnetic Resonance in Medicine 1995;34(6):910-914.
5. Dietrich O, Raya JG, Reeder SB, Ingrisch M, Reiser MF, Schoenberg SO. Influence of multichannel combination, parallel imaging and other reconstruction techniques on MRI noise characteristics. Magnetic Resonance Imaging 2008;26(6):754-762.
6. Coupe P, Manjon JV, Gedamu E, Arnold D, Robles M, Collins DL. Robust Rician noise estimation for MR images. Med Image Anal 2010;14(4):483-493.
7. Keereman V, Holen RV, Mollet P, Vandenberghe S. The effect of errors in segmented attenuation maps on PET quantification. Medical physics 2011;38(11):6010-6019.
Figures