2476
Assessment of ventilation heterogeneity using hyperpolarized gas MRI histogram analysis1POLARIS, Academic Unit of Radiology, University of Sheffield, Sheffield, United Kingdom, 2Sheffield Children’s Hospital,Sheffield Children’s NHS Foundation Trust; and Sheffield Teaching Hospitals NHS Foundation Trust, Sheffield, United Kingdom
Synopsis
Development of sensitive imaging biomarkers to differentiate health from disease is an important research topic in pulmonary MRI. This work aimed to make use of the rich spatial and signal intensity information in hyperpolarized gas MR ventilation images to determine metrics of ventilation heterogeneity. Retrospective analysis was performed on 3He ventilation images acquired from healthy volunteers and patients with cystic fibrosis, asthma and chronic obstructive pulmonary disease.
Introduction
Sensitive methods for early detection of obstructive lung disease is key for patients with cystic fibrosis (CF), asthma and chronic obstructive pulmonary disease (COPD) as it enables early initiation of treatments to maintain lung health. Ventilation defect percentage (VDP) has become a widely adopted metric to assess lung disease using hyperpolarized (HP) gas and proton anatomical (1H) MRI1. However VDP is a global, binary metric reflecting the amount of unventilated lung. VDP does not make full use of the rich spatial and signal intensity information available within the ventilated lung. The coefficient of variation of signal intensity (CV) can be calculated from HP gas images as a measure of ventilation heterogeneity within the ventilated lung2. Average CV of the lungs has been shown to be lower in healthy adults than in adults with asthma2, and healthy children and children with mild CF3. We postulate that CV histogram analysis may provide additional instructive metrics of ventilation heterogeneity.Purpose
To apply standard histogram analysis methods to CV histograms derived from ventilation MRI, and assess whether histogram metrics can differentiate healthy control subjects from patients with CF, asthma and COPD.Methods
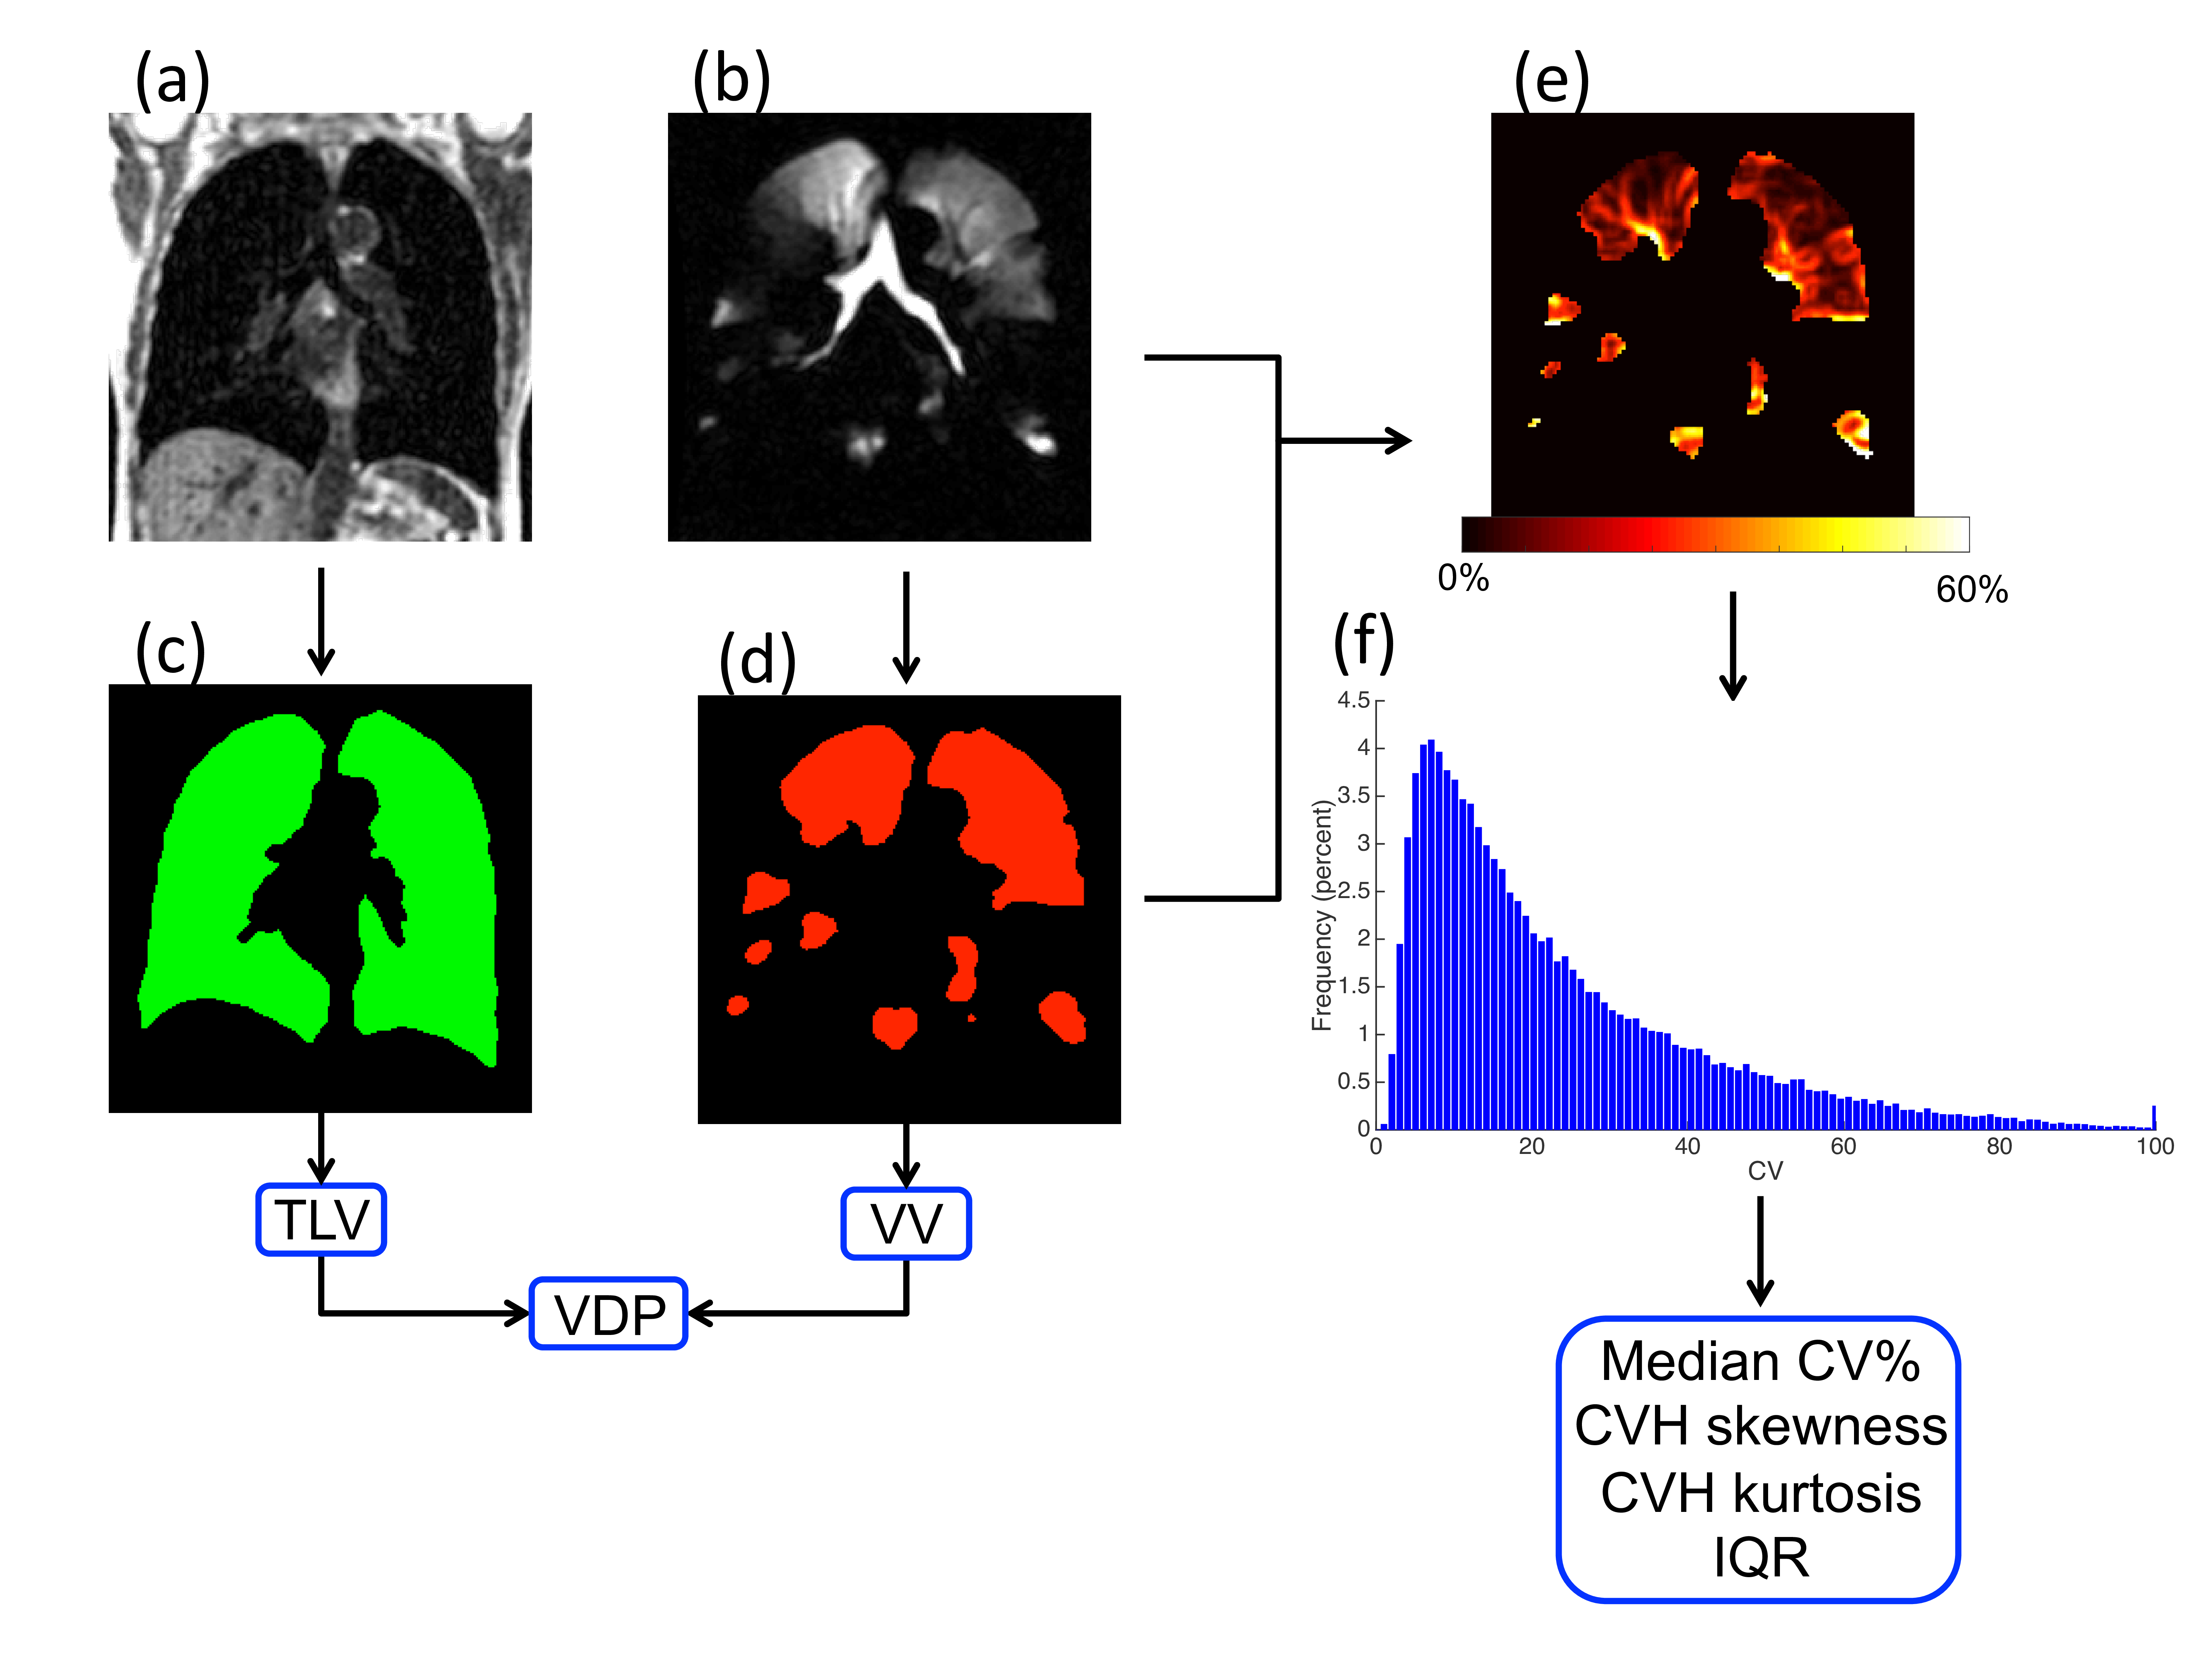
In this retrospective study, MRI data from 9 healthy children and 19 patients with mild CF (clinically stable, mild CTFR mutations and an FEV1 z-score >-2) was used. Additionally, data from 11 healthy adults, 34 patients with moderate-to-severe asthma (16 with FEV1 z-score >-2 – referred to as normal – and 18 with FEV1 z-score <-2 – referred to as abnormal) and 10 patients with COPD were analysed. Healthy children, and patients with asthma and CF, performed same-breath 2D hyperpolarized 3He MRI and 1H MRI at 1.5T4 (GE HDx, Milwaukee, WI) whilst healthy adults and patients with COPD underwent 3D same-breath hyperpolarized 3He MRI and 1H MRI at 1.5T5. Images were segmented, and VDP1 and median CV2,3 were calculated as the gold-standard methods of analysis against which histogram metrics were compared. CV histogram analysis was carried out using MATLAB following the workflow in Figure 1. For the analysis of CV, to account for partial volume effects at the edge of the lung, the 1H image mask was eroded by one voxel and the HP gas ventilation image mask was then multiplied by this eroded 1H mask. CV maps were created by sliding a 3x3 kernel across the ventilation images, thus calculating the CV of each pixel by considering the pixel itself and its 8 nearest neighbours. For each subject data set, a CV histogram was generated by defining 100 bins equally spaced between 0 and 100. CV histograms were then analysed for (i) skewness, (ii) kurtosis and (iii) interquartile range (IQR). Mann-Whitney tests were used to compare healthy children to children with CF whilst Kruskal-Wallis tests were used to compare healthy adults to patients with asthma and COPD. Adult and paediatric cohorts were separated as it is not yet clear how age affects the heterogeneity within the lung.Results
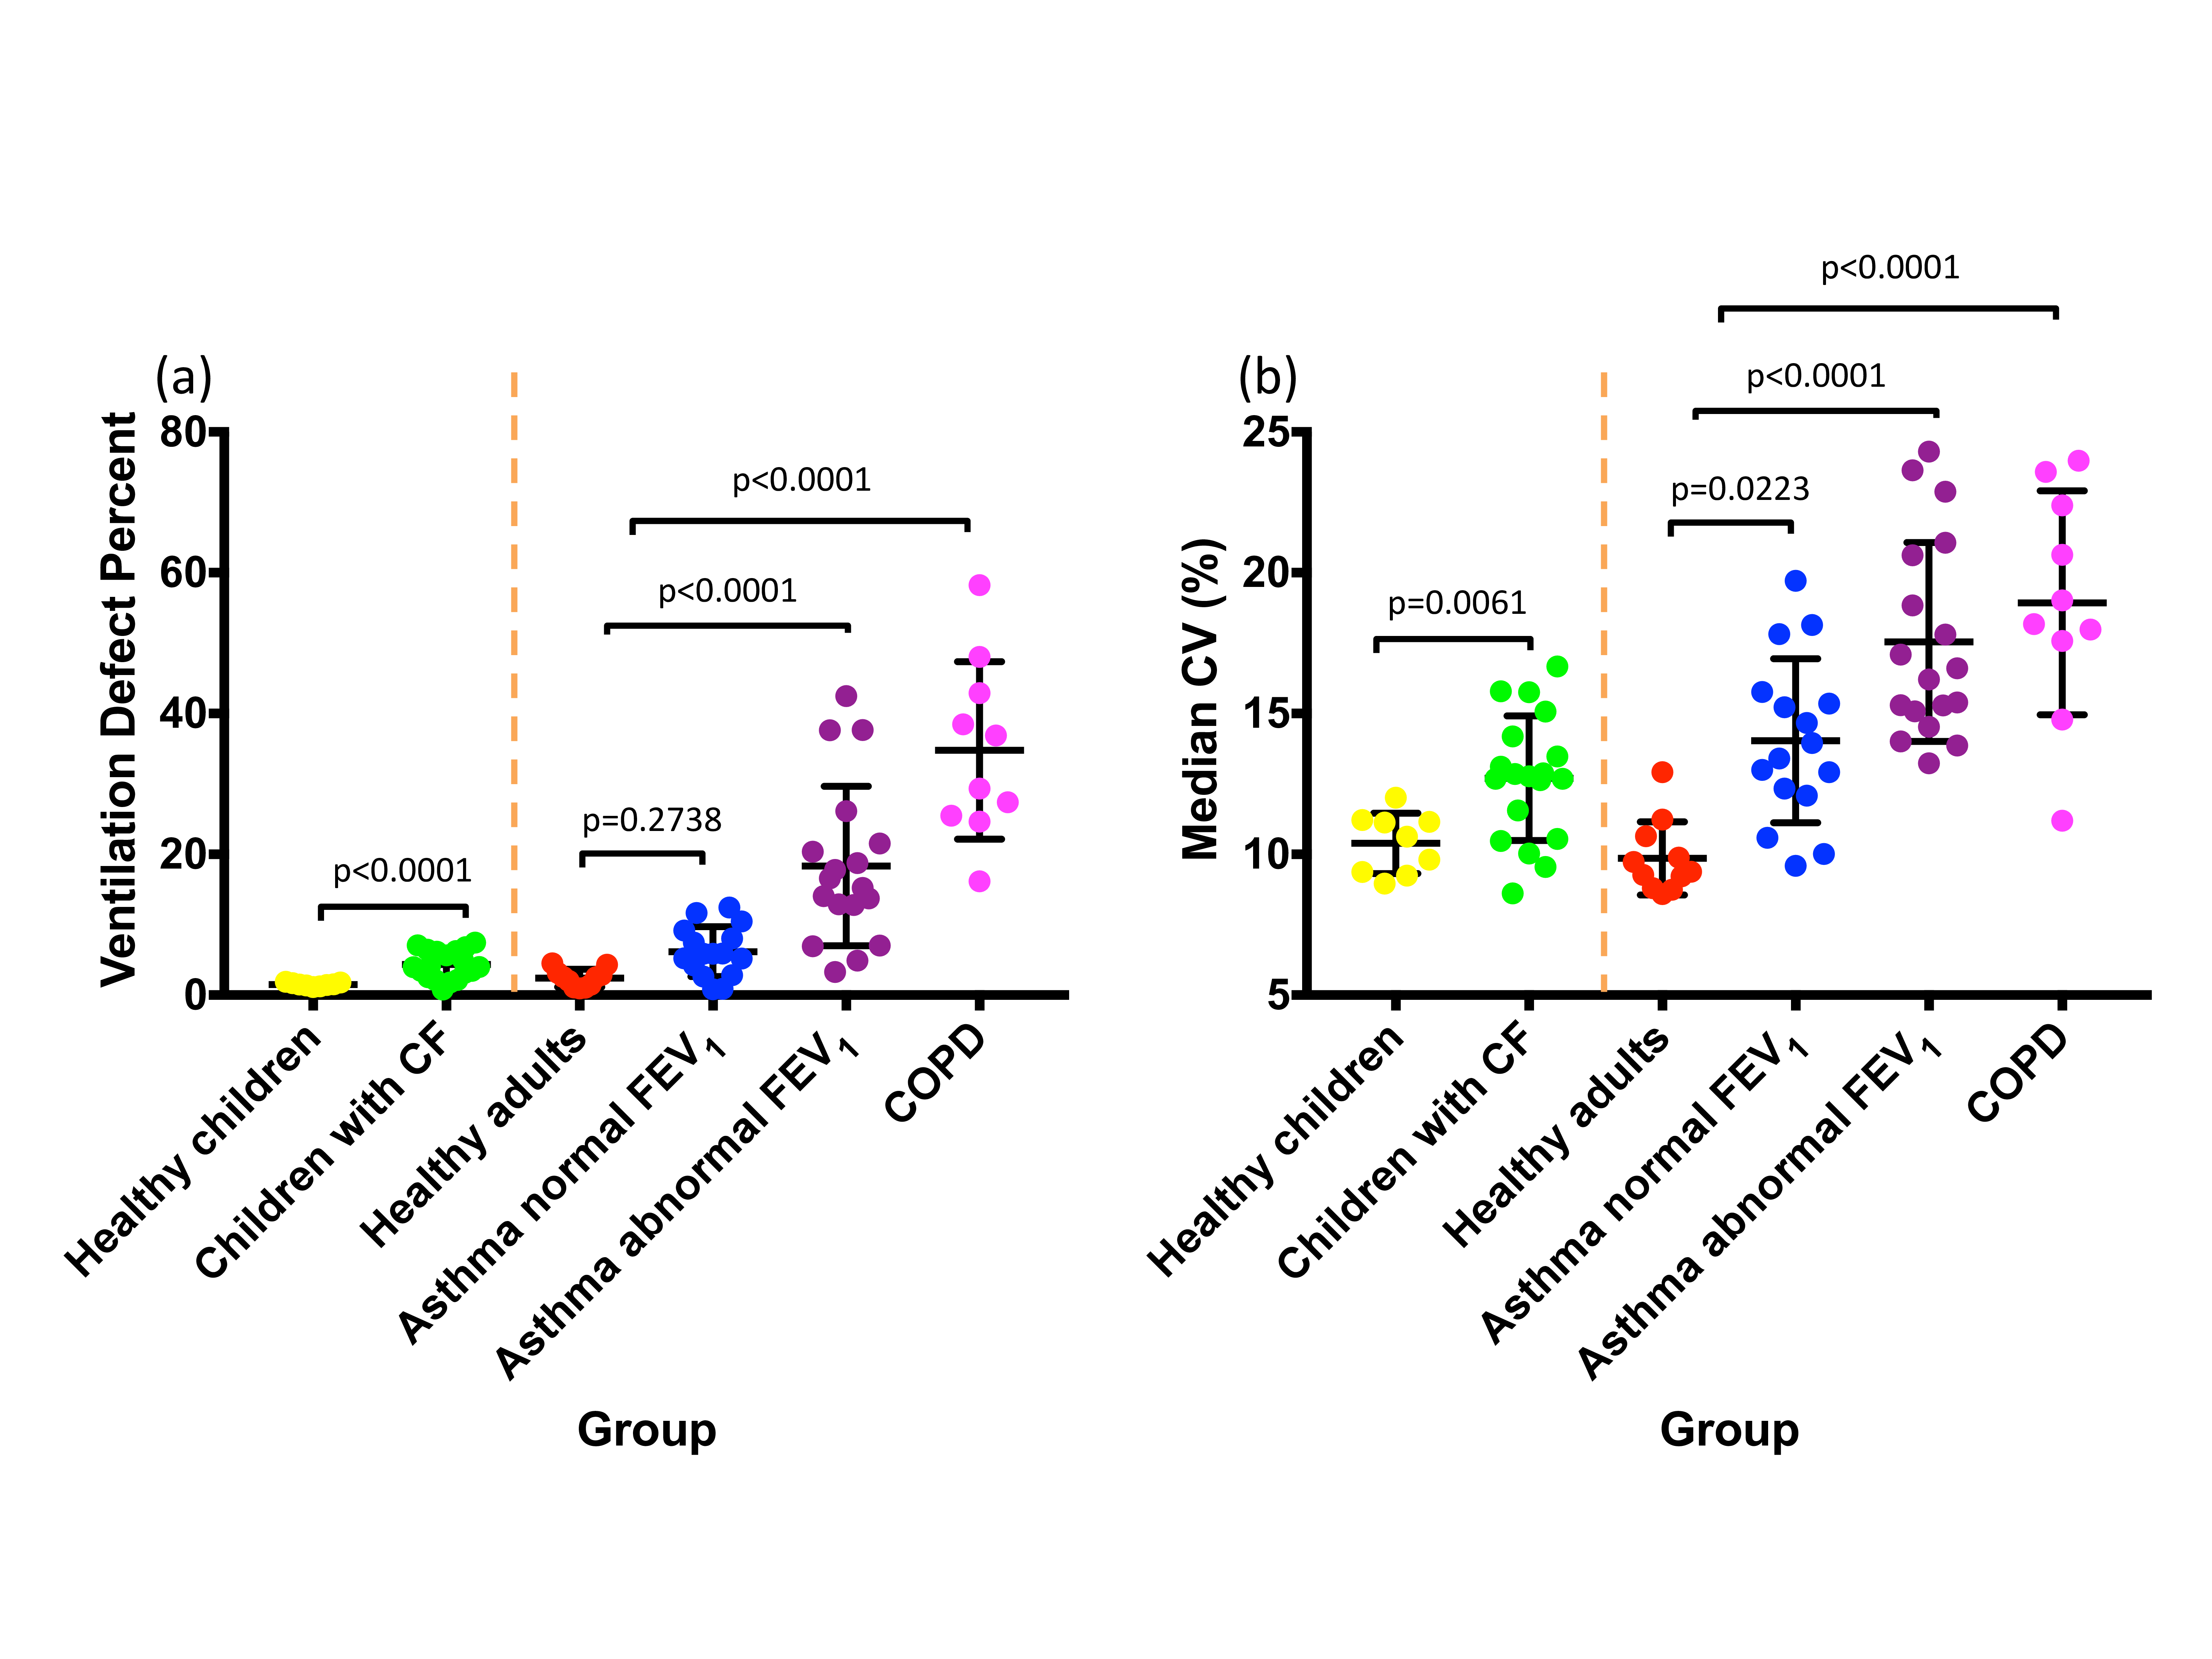
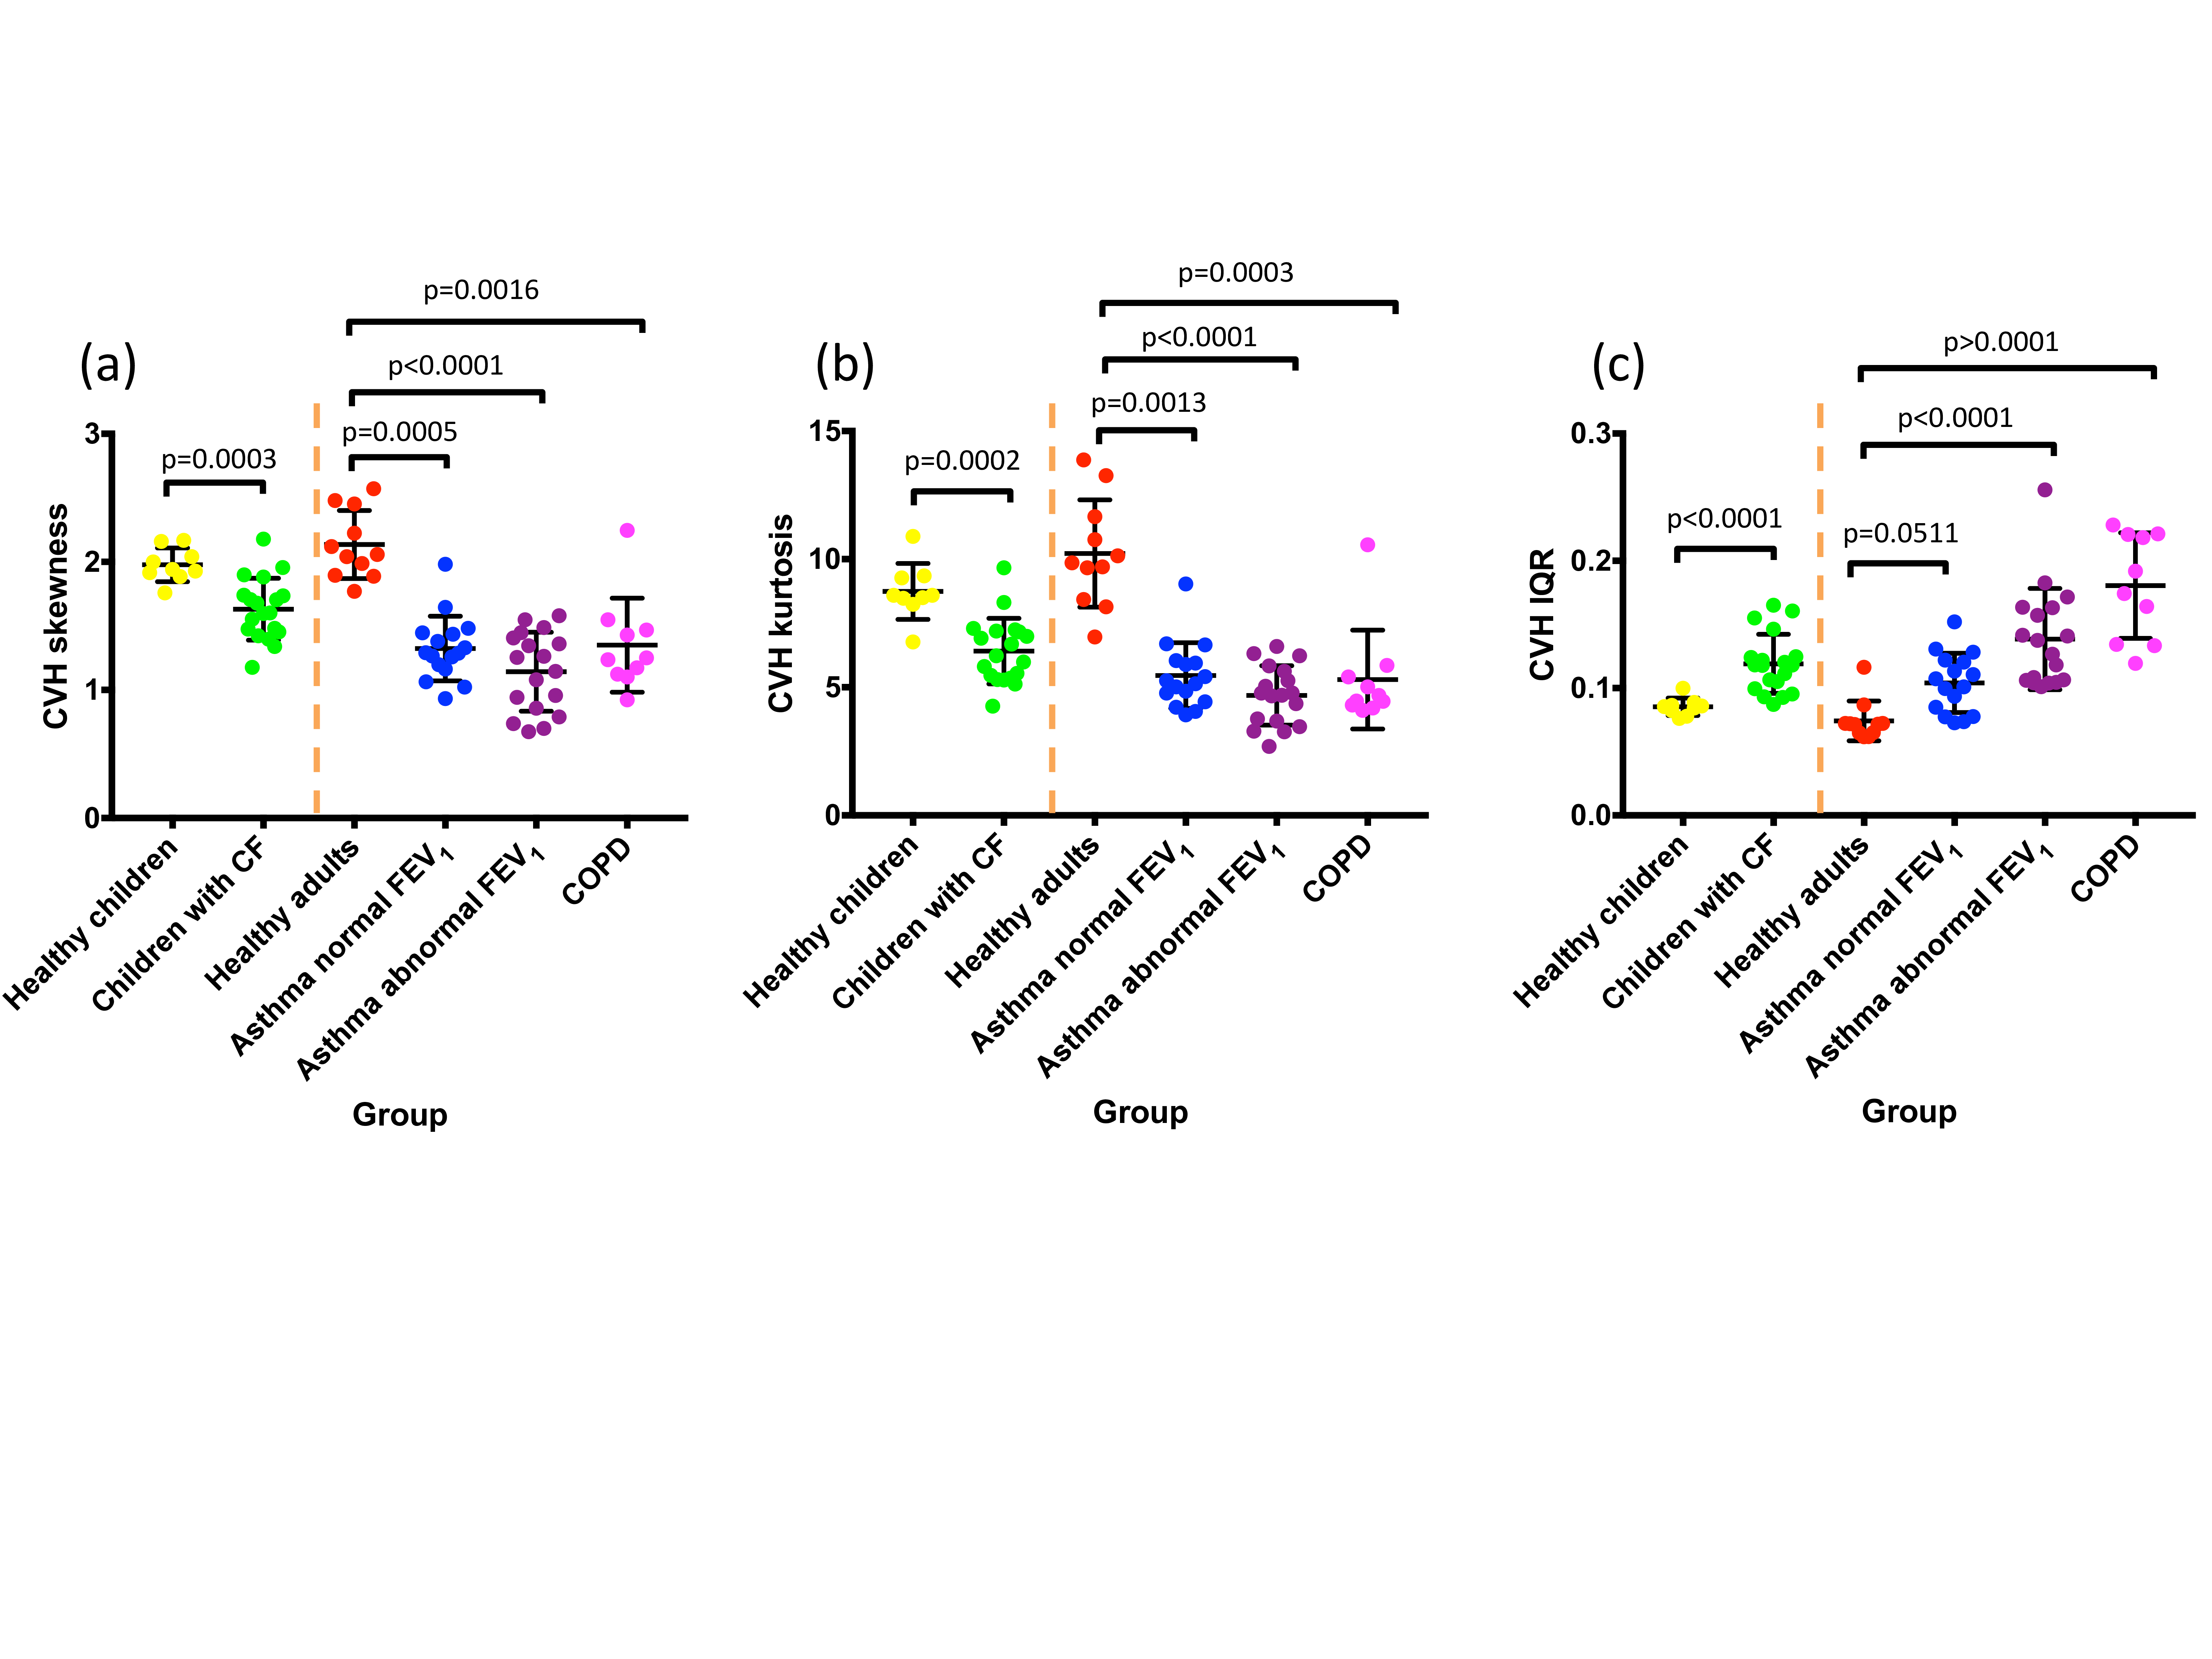
VDP was significantly different for healthy children vs. children with cystic fibrosis, healthy adults vs. patients with asthma and abnormal FEV1 z-score, and healthy adults vs. patients with COPD. VDP was not significantly different for healthy adults vs. patients with asthma and normal FEV1 z-score (Figure 2a). Median CV (%) (Figure 2b), CVH skewness (Figure 3a) and CVH kurtosis (Figure 3b) were significantly different between all pairs of groups. CVH IQR was significantly different between all pairs of groups except between healthy adults vs. patients with asthma and normal FEV1 z-score (Figure 3c). The differentiation between healthy adults vs. patients with asthma and normal FEV1 z-score was more statistically significant for CVH skewness (p=0.0005) and kurtosis (p=0.0013) than for median CV (p=0.0223).Discussion and conclusions
CV histogram metrics were found to differentiate health from several types of lung disease in young and old patients. A particularly interesting case is the differentiation of healthy adults and asthma patients with normal FEV1 z-score, for which the established VDP metric showed no statistical difference. Whilst the median CV showed statistical distinction between these groups, the CV histogram skewness and kurtosis showed a greater statistical significance, indicating that these ventilation heterogeneity metrics may be sensitive to early lung disease in asthma. We have shown that CV histogram metrics provide measures of ventilation heterogeneity that utilise the regional ventilation signal intensity distribution information, unlike VDP. Longitudinal follow-up studies would ascertain the sensitivity of these proposed metrics to short-term variation and long-term disease progression. The developed automated histogram analysis method can straightforwardly be used in conjunction with VDP analysis.Acknowledgements
NIHR, MRC, Cystic Fibrosis Trust and GlaxoSmithKline for fundingReferences
1. Woodhouse, N. et al. Journal of magnetic resonance imaging, 2005. 21(4): p. 365-369.
2. Tzeng, Y.-S. et al. Journal of Applied Physiology, 2009. 106(3): p. 813-822.
3. Marshall, H. et al. Thorax, 2017: p. thoraxjnl-2016-208948.
4. Wild, J.M. et al. NMR in Biomedicine, 2011. 24(2): p. 130-134.
5.
Horn, F. et al. NMR in Biomedicine, 2014. DOI: doi: 10.1002/nbm.3187.
Epub 2014 Sep 10.
Figures