2473
Mapping of Ventilation/Perfusion Ratios in the human lung using 19F MRI of Perfluoropropane1Institute for Diagnostic and Interventional Radiology, Hannover Medical School, Hannover, Germany, 2Biomedical Research in Endstage and Obstructive Lung Disease Hannover (BREATH), German Center for Lung Research (DZL), Hannover, Germany
Synopsis
In this work, the correlation between longitudinal relaxation time (T1), alveolar partial pressure and ventilation-perfusion ratio (V/Q) of an inhaled fluorinated gas is used to compute quantitative V/Q maps of the human lung. The trapping of inert Perfluoropropane (C3F8) in poorly ventilated regions of the lung (low V/Q) leads to an increase of its alveolar partial pressure which is detectable as an increase of T1 in 19F MR Imaging. Here, V/Q maps of three patients with Chronic Obstructed Pulmonary Disease (COPD) were calculated and compared to a V/Q map of a healthy volunteer.
Background
The dimensionless ratio of ventilation (V) and perfusion (Q) is a key parameter for characterizing lung function. In a healthy lung, the distribution of V/Q values is log normal, with a mean of ≈0.85 and a width (standard deviation of log V/Q) of 0.15-0.30, enabling a full oxygenation of arterial blood1. However, in patients with lung diseases, e.g. COPD or asthma, V/Q may be lower in obstructed areas, leading to a broadened distribution of values over the entire lung. To date, V/Q maps are mainly gained via SPECT or PET, using radioactive tracers. Thus, a comparable non-invasive imaging method is highly desired. Due to its low costs, high inertness and high magnetization at thermal polarization, fluorinated gases are promising tracers for imaging of lung function using19F MRI.
Obstructed lung ventilation leads to a reduced exhalation of previously inhaled gas. Therefore, the alveolar partial pressure of an inert fluorinated gas increases contrarily to the partial pressure of oxygen which diffuses into the capillaries at normal perfusion. This increased partial pressure leads to a signal enhancement in a 19F MR image. When inhaling a mixture predominantly consisting of a fluorinated gas, this signal enhancement due to obstructed ventilation is vanishing. Thus, earlier approaches are based on the inhalation of a mixture with relatively low concentration of fluorinated gas of 30% for imaging, resulting in a strong contrast between regions of good and poor ventilation2,3. However, the small amount of 19F atoms in this mixture results in a strikingly low signal to noise ratio (SNR) which makes this method impractical for clinical application. The purpose of this work was to improve V/Q imaging using 19F fluorinated gas MRI for application in humans.
Method
One healthy volunteer and three COPD patients (GOLD stage II) were enrolled in this study approved by the institutional review board. After inhalation of 30L of a normoxic mixture of perfluoropropane (C3F8) (21% O2 and 79% C3F8), gas washout MRI was started after switching to pure oxygen using a spoiled gradient echo (spGRE) acquisition with stack of stars trajectory (TE=1.7ms, TR=3.4ms, flip angle: 30°, FOV: 400x400x240mm3, matrix size: 64x64x12, bandwidth: 650Hz/pixel, 3496 projections) on a 1.5 T scanner. The signal decay of inspiratory gas images during washout was modeled with the common signal equation and a linear correlation between T1 and C3F8 concentration4: $$S\propto x(t)\sin\alpha\frac{1-\mathrm{e}^{-\mathrm{TR}/\mathrm{T_1}(x(t))}}{1-\mathrm{e}^{-\mathrm{TR}/\mathrm{T_1}(x(t))}\cos\alpha}\mathrm{e}^{-\mathrm{TE}/\mathrm{T_2^*}}$$
assuming an exponential decay of C3F8 concentration
$$x(t)=x_0\ \mathrm{e}^{-t/T_W}.$$
Before gas washout was started, the C3F8 concentration x0 was estimated by measuring regional T1 using the variable flip angle method in a single breath hold (3D spGRE with cartesian sampling, TE=1.7ms, TR=5ms, three flip angles: 20°/30°/40°, FOV: 500x375x240mm3, matrix size: 64x48x12, bandwidth: 440Hz/pixel, 2 averages, total scan time: 17.2s) and applying the linear correlation used before (Fig. 1a)4. From the set of dynamic T1(t) maps over the whole washout phase calculated with the model above, the point in time with a concentration of 30% C3F8 in normally ventilated lung regions was identified when at least 25% of all lung voxels had a relaxation time corresponding to a gas concentration of x=0.3 (T1=9.78ms). The final conversion from T1 to V/Q values was achieved employing the iterative calculation method by Olszowka & Farhi5 (Fig. 1b). The whole method is illustrated in Fig. 2.
Results
Figure 3 shows the relative amount of voxels below T1=9.78ms and therefore the number of voxels below a C3F8 concentration of 30% during the gas washout phase for one COPD patient and a healthy volunteer. For the COPD patient, the gas washout is delayed compared to the healthy volunteer corresponding to bronchial obstructions. The resulting V/Q values show the expected log normal distribution. While in the healthy lung a mean V/Q of ≈0.89 with a FWHM (of log V/Q) of ≈0.2 was found, the mean V/Q in the obstructed lung was ≈0.85 with a FWHM (of log V/Q) of ≈0.22 of (see Fig. 4). Exemplary V/Q maps of an obstructed versus a healthy lung are shown in Fig. 5.Discussions and conclusions
The results above show that the presented method is able not only to identify and localize obstructed lung areas but also to quantify them. One major drawback of this study is the small number of examined subjects and the lack of comparison to a well-established method for V/Q mapping. Further obstacles are the low SNR in 19F images which makes the T1 mapping very challenging as well as the unequivocal identification of the point where the lung is filled with exactly 30% C3F8 in the washout. In the future, V/Q values may serve as a marker in clinical trials for treatment monitoring when mapping is achieved by non-invasive imaging.Acknowledgements
This work was funded by the German Center for Lung Research (DZL). Furthermore, the authors thank Frank Schröder, Lars Kähler and Susanne Tewes for experimental assistance as well as Andreas Voskrebenzev, Agilo Kern and Filip Klimeš for support in postprocessing.
References
1. Farhi, L. E., & Rahn, H. (1955). A theoretical analysis of the alveolar-arterial O2 difference with special reference to the distribution effect. Journal of applied physiology, 7(6), 699-703.
2. Adolphi, N. L., & Kuethe, D. O. (2008). Quantitative mapping of ventilation‐perfusion ratios in lungs by 19F MR imaging of T1 of inert fluorinated gases. Magnetic resonance in medicine, 59(4), 739-746.
3. Kuethe, D. O., Caprihan, A., Gach, H. M., Lowe, I. J., & Fukushima, E. (2000). Imaging obstructed ventilation with NMR using inert fluorinated gases. Journal of applied physiology, 88(6), 2279-2286.
4. Chang, Y. V., & Conradi, M. S. (2006). Relaxation and diffusion of perfluorocarbon gas mixtures with oxygen for lung MRI. Journal of magnetic resonance, 181(2), 191-198.
5. Olszowka, A. J., & Farhi, L. E. (1968). A system of digital computer subroutines for blood gas calculations. Respiration physiology, 4(2), 270-280.
Figures
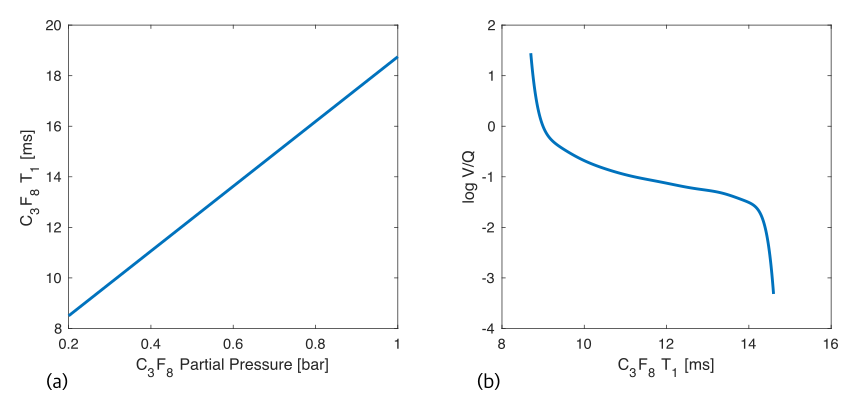
Figure 1:
(a) Linear correlation between C3F8 alveolar partial pressure and T14.
(b) Numerically calculated correlation between C3F8 T1 and log V/Q5.
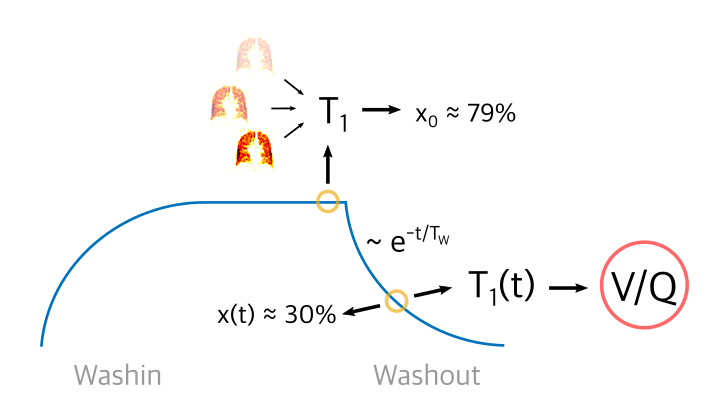
Figure 2:
Graphical illustration of the method described for mapping V/Q during washout of inert fluorinated gases using T1 measurements.
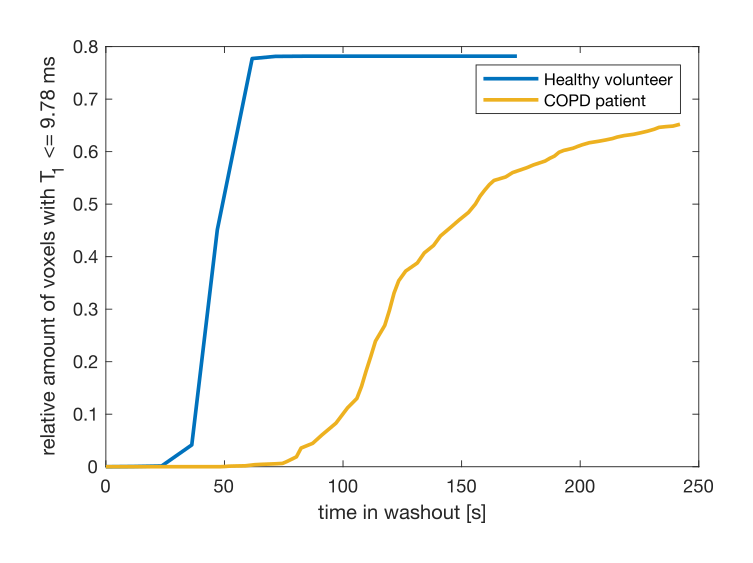
Figure 3:
Percentage of voxels with T1 ≤ T1 = 9.78ms (x = 30%) over time during washout for a COPD patient versus a healthy volunteer. The decrease in T1 due to decaying C3F8 concentration is much slower in COPD patients which indicates gas trapping.
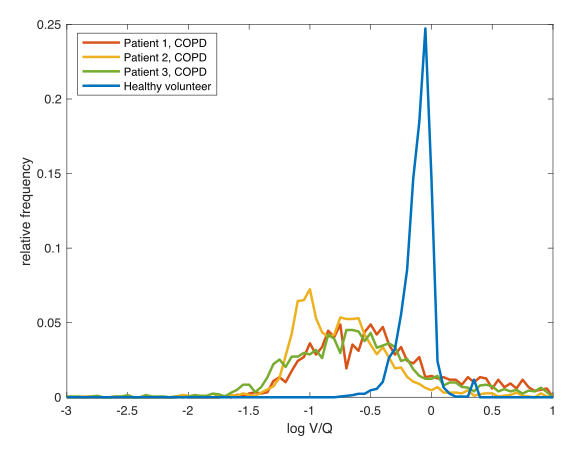
Figure 4:
Distribution of log V/Q values normalized by the number of evaluable voxels for three COPD patients and one healthy volunteer. The healthy lung shows the expected narrow distribution with a mean value of ≈0.89, whereas the obstructed lungs show wider distributions with a lower mean value of ≈0.22.
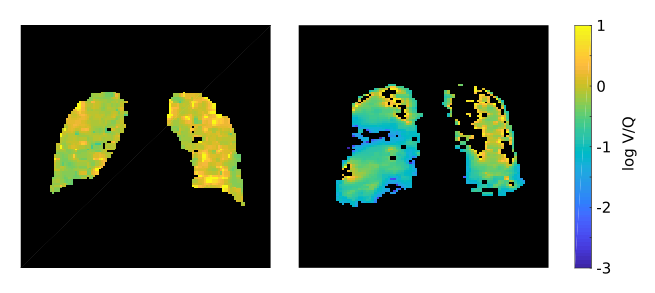
Figure 5:
Exemplary V/Q maps of a healthy volunteer (left) versus a COPD patient (right). Note the logarithmic scale ensuring the equal representation of large and small V/Q values.