2471
Probing changes in lung physiology in COPD using CT, perfusion MRI and hyperpolarized xenon-129 MRI1University of Virginia, Charlottesville, VA, United States, 2Beth Israel Deaconess Medical Center, Boston, MA, United States, 3University of Washington, Seattle, WA, United States, 4University of Pennsylvania, Philadelphia, VA, United States, 5University of Missouri School of Medicine, Columbia, MO, United States
Synopsis
In this study, by using chest CT, Gadolinium-enhanced perfusion MRI, and hyperpolarized xenon-129 ventilation and gas uptake MRI, we assessed the quantitative changes in tissue density, pulmonary perfusion and gas uptake in patients with COPD compared to normal subjects. We found evidence for compensatory pulmonary vasoconstriction to match impairment of ventilation, and also pulmonary shunt and dead space. By incorporating a new lobar segmentation method for proton MRI, we performed statistical analysis to evaluate the regional interrelationships among different measures. We demonstrated that xenon-129 MRI has high potential to identify changes of multiple aspects of lung physiology in one acquisition.
Introduction
Clinical diagnosis and prognosis of chronic obstructive pulmonary disease (COPD) are still primarily based on irreversible airflow limitation measured by spirometry. However, multiple studies reported [1,2] heterogeneous phenotypes of COPD that are far more complicated than being simply defined by irreversible airflow limitation. In this pilot study, we exploited multiple imaging modalities, including CT, gadolinium-enhanced perfusion MRI, and hyperpolarized xenon-129 MRI [3,4], to perform a detailed investigation of changes in lung morphology and functions in COPD. Utility and strengths of xenon-129 MRI in assessing COPD were also evaluated against the other imaging modalities.Methods
Chest CT was done based on the COPDGene protocol [5]. Lung regions were divided into five lobes based on the detection of lung fissures. The bottom 15th percentile (Perc15) of the CT Hounsfield Unit (HU) numbers was calculated for each lobe to represent the average severity of emphysema in the lobe [6]. All MR acquisitions were done using a 1.5T commercial whole-body MR scanner (Avanto; Siemens Medical Solutions, Malvern PA). For perfusion MRI, Gd-DTPA was injected at the standard dose (0.2ml/kg body weight), simultaneously with data acquisition. A Siemens TWIST sequence was used to acquire a four-dimensional data set with a real temporal resolution of 1.6-2 seconds during free breathing. First-pass dynamic Gd-enhanced images were processed as described in [7] to produce pulmonary perfusion volume (PBV), perfusion flow (PBF), and mean transit time (MTT). For Xe129 ventilation and gas uptake imaging, a combined Xe129 and proton MR acquisition during a single breath was used to enable regional quantitative analysis of lung function. Xe129 gas uptake measures, including tissue-to-gas, RBC-to-gas and RBC-to-tissue ratios were processed as described in [3], while the percentage of the lung with reduced ventilation (%VD) was calculated based on [8]. A lobar segmentation method [9] was used to divide the proton images into individual lobes, and this segmentation information was then applied to the lung function maps to calculate mean perfusion, ventilation or gas uptake measures for each lobe for statistical analysis.Results and Discussions
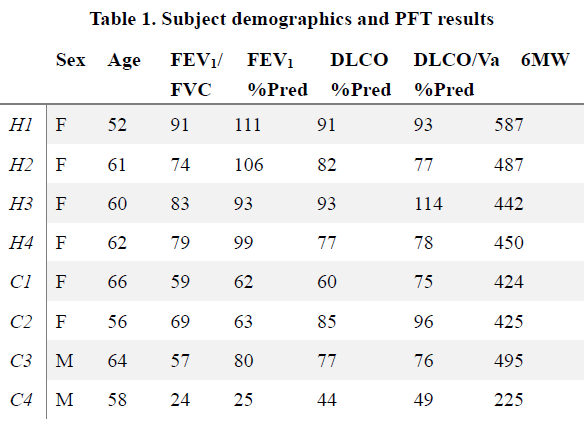
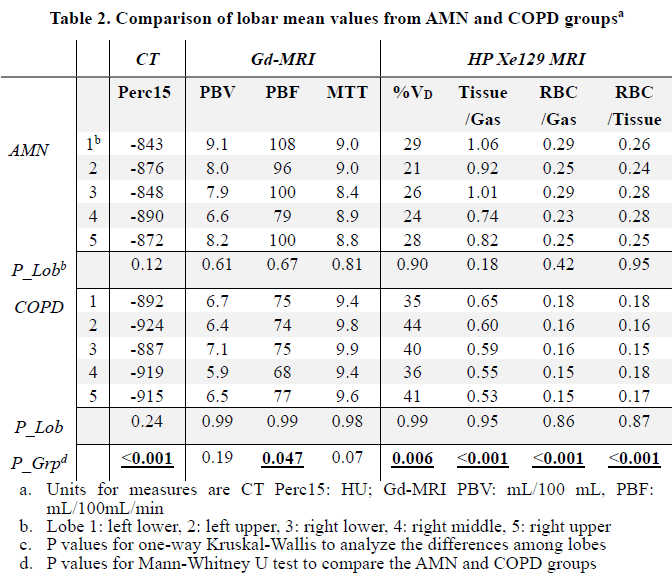
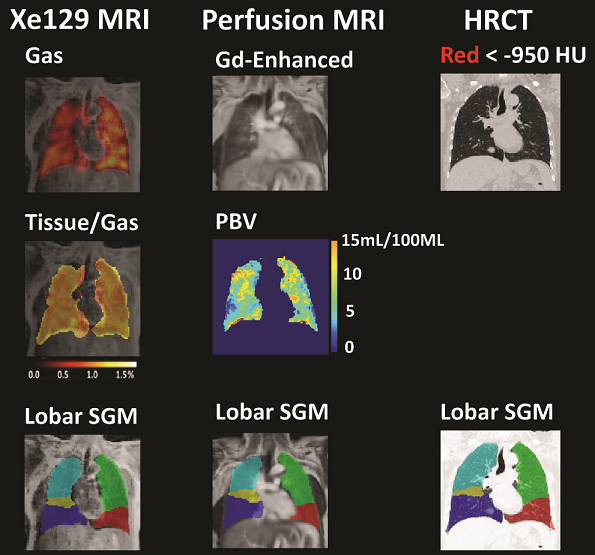
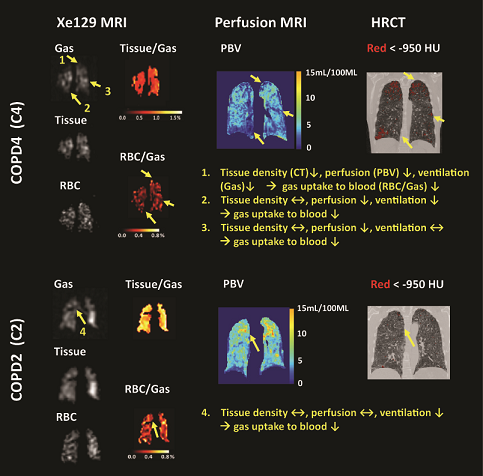
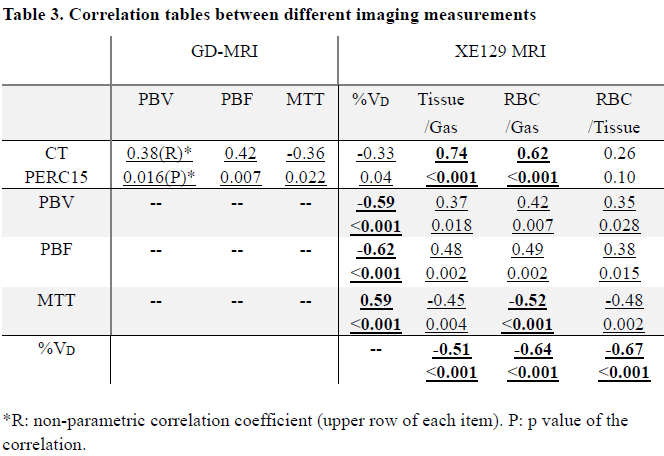
Subject demographics, PFT and 6MW results are shown in Table 1. Lobar mean values of the different measures were shown in Table 2. No within-group statistical difference among lobes was observed for any of the imaging measures in the AMN or COPD group (P>0.05). However, comparing between groups, COPD subjects had significantly lower CT Perc15 (P<0.001), MRI perfusion measure PBF (P=0.047), and Xe129 gas uptake measures (P<0.001). Also the %VD in COPD subjects was significantly higher than that in the AMN group (P=0.006). Figure 1 shows representative lobar segmentation for CT and MR images/maps for a slice from subject H4. For the Xe129 MRI results, it can be seen that the ventilation (“gas”) image and the generated tissue-to-gas ratio map align with the proton images very well. Correlations of lobar mean values from different imaging measures are shown in Table 4. CT Perc15 had strong correlations with Xe129 tissue-to-gas (R=0.74, P<0.001) and RBC-to-gas ratios (R=0.62, P<0.001). This is as expected since emphysema or hyper-expansion could both cause decrease of tissue density and/or blood volume. A good example of this is Area 1 of subject C4, shown in Figure 2. With severe emphysema, Area 1 was suspected to have very little functioning tissue left as shown on CT. Both ventilation (Xe129 “gas” image) and perfusion (PBV) were very low, which would lead to virtually no gas uptake in this area. There are strong correlations between perfusion measures and the Xe129 %VD (PBV: R=-0.59, P<0.001; PBF: R=-0.62, P<0.001; MTT: R=0.59, P<0.001). This may mean perfusion variation from compensatory vasoconstriction response to ventilation changes to maintain V/Q coupling [10]. A supporting example was Area 2 from subject C4 shown in Figure 2. Lung tissue in the Area 2 appears to be intact based on CT, but ventilation and PBF were abnormally low. Mismatches between ventilation and perfusion were also observed. For example, Area 3 in subject C4 appeared normal by chest CT, and was well ventilated, but had a fissure-like perfusion defect, and abnormally low gas uptake as measured by Xe129 DP MRI. While Area 4 in subject C2 exhibited normal lung tissue without emphysema by chest CT and normal perfusion, but had poor ventilation and poor gas exchange. As expected, the Xe129 RBC-to-gas ratio, an imaging counterpart of DLCO, correlated strongly with all other imaging methods: CT Perc15 (R=0.62, P<0.001), perfusion (e.g. MTT: R=-0.52, P<0.001) and ventilation (R=-0.64, P<0.001).
Conclusion
Xe129 MRI has high potential to identify changes of multiple aspects of lung physiology in one acquisition.Acknowledgements
This work is supported by NIH (R21HL129112, R01HL109618, R01HL132287, and R01HL132177 from the National Heart, Lung, and Blood Institute) and research funding from Siemens Medical Solutions.References
[1]. Kim V, et. Al. Chest 2011; 140: 626-633. [2]. Vestbo J, et. Al. Am J Respir Crit Care Med. 2014; 189: 1022-1030. [3]. Qing K, et. Al. JMRI 2014; 39: 346-359. [4]. Kaushik SS, et. Al. Magn. Reson. in Med. 2016; 75: 1434-1443. [5]. Labaki WW, et. Al.. Am J Respir Crit Care Med. 2017. doi: 10.1164/rccm.201703-0451PP. [Epub ahead of print] [6]. Mohamed Hoesein FA, et. Al. Thorax 2011; 66: 782-787. [7]. Ohno Y, et. Al. JMRI 2004; 20: 353-365. [8]. Tustison NJ, et. Al. JMRI 2011; 34: 831-841. [9]. Tustison NJ, et. Al. Magn. Reson. in Med. . 2016 Jul;76(1):315-20. [10]. Stenmark KR, et. Al.. Circulation research 2006; 99: 675-691.Figures