2470
Optimization of Steady-state Free Precession with 19F Perfluoropropane for Increased Signal-to-Noise for Human Lung Ventilation Imaging at 3 T1POLARIS, Academic Radiology, University of Sheffield, Sheffield, United Kingdom
Synopsis
Fluorinated gas MRI is an alternative modality to hyperpolarized gas MR for imaging lung ventilation, but is constrained by lower SNR. Improvement of the signal-to-noise ratio of human lung ventilation images with 19F the steady-state free precession (SSFP) sequence was previously explored at 1.5T. Here, we present optimization of SSFP for imaging lung ventilation at 3T. The achievable improvement of in-vivo imaging quality with realistic relaxation parameters is demonstrated with comparison against the spoiled gradient echo sequence. Limits in applying the SSFP sequence due to specific absorption ratio at 3T and the dependence on T2* within the lungs are detailed.
Background
MRI with inhaled fluorinated gases shows promise as a complementary method for lung ventilation imaging1. Due to relatively short T2* of fluorinated gases in the lungs the use of short echo time (TE) spoiled gradient echo sequences (SPGR) have been used previously2. Also, relatively high sequence repetition times (TR)3 have been used due to specific absorption ratio (SAR) constraints at 3T. However, C3F8 gas has a longer T2* and T2 when compared to other fluorinated gases and therefore, improved signal to noise (SNR) may be achieved with the use of steady state free precession (SSFP) as previously demonstrated at 1.5T4.Purpose
To optimize image acquisition of inhaled C3F8 gas for lung ventilation imaging at 3T by considering intrinsic in-vivo relaxation parameters during typical imaging conditions.Methods
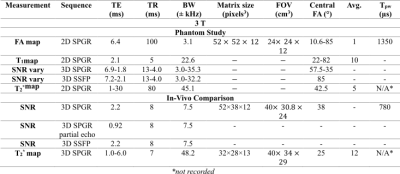
Phantom Imaging: Phantom (C3F8/O2 filled glass cell at 1.4atm) experiments were performed at 3T (Philips Ingenia) with an in-house rectangular 24x16cm2 coil. Flip-angle (FA) maps were generated by fitting the received signal with varying RF power (TR>>T1). SPGR or SSFP imaging sequences were acquired with varying TR (see Table 1 for parameters). To emulate the expected low in-vivo T2* values during SPGR imaging paramagnetic wire (nickel plated) was placed near the glass cell to introduce B0 field inhomogeneity. T2* maps were fit from the signal decay during multi-echo SPGR imaging (multiple echoes per TR). For SSFP the optimum FA was 90°, (assuming T1=T24) while the Ernst angle [5] was prescribed for SPGR imaging. SNR was averaged in three regions of interest (ROI) with different T2*. T1 was also fit pixelwise throughout the cylinder by varying the known FA, with (TR<<T1)6.
Simulations: To theoretically corroborate experiments, image acquisition parameter optimization for C3F8 (mixed with 21% O2) was performed with MR signal simulations for SPGR7 and SSFP8,9 3D sequences. For SSFP the signal is affected by T210 rather than T2*. Values of T1 and T2 used were ~17ms. RF pulse width (1.35ms) and gradient encoding/refocusing delays (0.6ms) before and after frequency encoding were included when calculating acquisition bandwidth and TE for given TR based on the observed in-scanner values with phantom imaging.
In-vivo imaging: Sequence optimization was verified with in-vivo lung imaging experiments in healthy adult volunteers. An elliptical transmit/receive quadrature birdcage coil (Rapid Biomedical) was used. Based on simulated values of local 10g SAR (comparable to other volume resonators11,12) SAR limits were limited to first level controlled values <10s13. With one volunteer SPGR with full and 60% echo acquisition and SSFP imaging was performed with the in-vivo FA restricted to 38° for TR=8ms due to SAR constraints13. Multi-echo SPGR lung imaging was carried out with five volunteers to quantify the in-vivo T2* by fitting the resulting signal decay. During the imaging, volunteers inhaled a mixture of 80% C3F8 and 20% O2 continuously from a Douglas bag and then performed a breath-hold after the fourth inhalation. All imaging parameters for the various experiments are detailed in Table 1.
Results
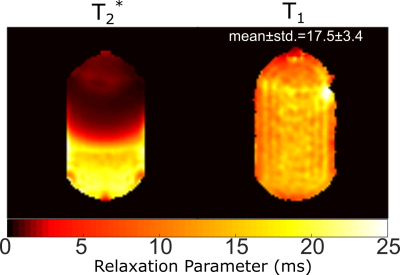
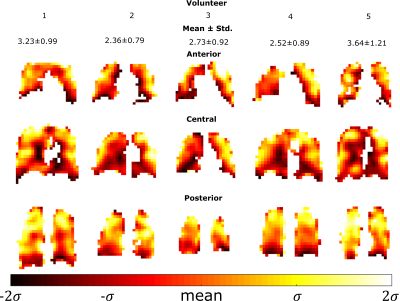
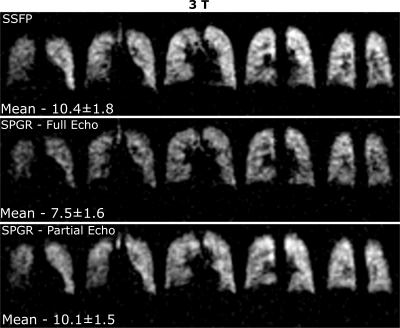
The phantom T1 map in Figure 1 is in agreement with previously reported values (~16-18ms14) and does not vary with proximity to the paramagnetic wire. The T2* mapped in Figure 1 covers a large range up to ~T1. The comparison of image SNR and simulated magnetization obtained with SPGR and SSFP sequences against varying TR is displayed in Figure 2 with central regions of interest corresponding to different T2* displayed next to the graphs. In Figure 3 the mapped T2* in human lungs is comparable to global measurement of T2* (2.2ms)[3], but regional variation and variation in the mean is notable. Despite a sub-optimal FA of 38° used due to scanner calculated SAR limits, SNR was increased by a factor of 1.4 with SSFP vs SPGR, as shown in Figure 4. SNR with partial echo acquisition was higher, but increased blurring was observed that is detrimental to image quality.Discussion and Conclusion
By measurement and consideration of relaxation parameters of C3F8 in phantoms and in-vivo we theoretically and experimentally optimized SSFP imaging parameters for lung ventilation MRI. Moreover, we have verified with both phantom and in-vivo imaging that SSFP with C3F8 results in higher SNR than with SPGR. Additionally, in-vivo lung images were observed to be artefact free with SSFP. The low T2*, which is found to vary within the lungs, leads to reduced relative performance of the SPGR sequence. SAR constraints were found to limit the optimization of SSFP in human 19F ventilation imaging at 3T, and better optimization may be obtained at 1.5T4. Therefore, with judicious increase of FA equivalent quality human ventilation images may be obtained with SSFP at 1.5T as at 3T.Acknowledgements
Dr Matthew Clemence of Philips Healthcare. Dr Peter Thelwall of Newcastle University for useful discussions. Doctoral program funding for Adam Maunder was partially provided by support from GE Healthcare Inc. and scholarships from the Natural Sciences and Engineering Research Council of Canada (NSERC) and University of Sheffield. This work was funded by the National Institute for health research (NIHR), Medical Research Council (MRC) and University of Sheffield Hyperpolarised Imaging Group - POLARIS. The views expressed in this abstract are those of the author and not necessarily those of NHS, NIHR, MRC or the Department of Health.References
1. D. O. Kuethe, A. Caprihan, E. Fukushima, and R. A. Waggoner, "Imaging lungs using inert fluorinated gases," Magnetic Resonance in Medicine, vol. 39, pp. 85-88, 1998.
2. A. V. Ouriadov, M. S. Fox, M. J. Couch, T. Li, I. K. Ball, and M. S. Albert, "In vivo regional ventilation mapping using fluorinated gas MRI with an x-centric FGRE method," Magnetic Resonance in Medicine, vol. 74, pp. 550-557, 2015.
3. M. J. Couch, I. K. Ball, T. Li, M. S. Fox, S. L. Littlefield, B. Biman, et al., "Pulmonary ultrashort echo time 19F MR imaging with inhaled fluorinated gas mixtures in healthy volunteers: feasibility," Radiology, vol. 269, pp. 903-9, Dec 2013.
4. A. Maunder, N. J. Stewart, M. Rao, F. J. L. Robb, and J. M. Wild, "Steady-state Free Precession for Improved Signal to Noise in Lung Ventilation Imaging with 19F Perfluoropropane at 1.5 T," Proc. Intl. Soc. Mag. Reson. Med., vol. 25, p. 3318, 2017.
5. R. R. Ernst and W. A. Anderson, "Application of Fourier Transform Spectroscopy to Magnetic Resonance," Review of Scientific Instruments, vol. 37, pp. 93-102, 1966.
6. S. C. L. Deoni, "High-resolution T1 mapping of the brain at 3T with driven equilibrium single pulse observation of T1 with high-speed incorporation of RF field inhomogeneities (DESPOT1-HIFI)," Journal of Magnetic Resonance Imaging, vol. 26, pp. 1106-1111, 2007.
7. S. B. Reeder and E. R. McVeigh, "The Effect of High Performance Gradients on Fast Gradient Echo Imaging," Magnetic resonance in medicine : official journal of the Society of Magnetic Resonance in Medicine / Society of Magnetic Resonance in Medicine, vol. 32, pp. 612-621, 1994.
8. S. B. Reeder, D. A. Herzka, and E. R. McVeigh, "Signal-to-Noise Ratio Behavior of Steady-State Free Precession," Magnetic resonance in medicine : official journal of the Society of Magnetic Resonance in Medicine / Society of Magnetic Resonance in Medicine, vol. 52, pp. 123-130, 2004.
9. B. A. Hargreaves, S. S. Vasanawala, J. M. Pauly, and D. G. Nishimura, "Characterization and reduction of the transient response in steady-state MR imaging," Magnetic Resonance in Medicine, vol. 46, pp. 149-158, 2001.
10. K. Scheffler and J. Hennig, "Is TrueFISP a gradient-echo or a spin-echo sequence?," Magn Reson Med, vol. 49, pp. 395-7, Feb 2003.
11. B. Guérin, M. Gebhardt, P. Serano, E. Adalsteinsson, M. Hamm, J. Pfeuffer, et al., "Comparison of simulated parallel transmit body arrays at 3 T using excitation uniformity, global SAR, local SAR, and power efficiency metrics," Magnetic Resonance in Medicine, vol. 73, pp. 1137-1150, 2015.
12. T. S. Ibrahim, "Radiofrequency Fields and SAR for Bird Cage Coils," in eMagRes, ed: John Wiley & Sons, Ltd, 2007.
13. I. 60601-2-33, "Particular requirements for the basic safety and essential performance of magnetic resonance equipment for medical diagnosis," in Medical electrical equipment - Part 2-33, ed, 2015.
14. Y. V. Chang and M. S. Conradi, "Relaxation and diffusion of perfluorocarbon gas mixtures with oxygen for lung MRI," Journal of Magnetic Resonance, vol. 181, pp. 191-198, 8// 2006.
Figures


