2468
Assessment of the diaphragm morphology in upright seated and supine position1National Institute for Health Research (NIHR) Nottingham Biomedical Research Centre, Nottingham, United Kingdom, 2Respiratory Medicine, University of Nottingham, Nottingham, United Kingdom, 3Sir Peter Mansfield Imaging Centre, University of Nottingham, Nottingham, United Kingdom, 4Clinical Neuroscience, University of Nottingham, Nottingham, United Kingdom
Synopsis
The morphology of the diaphragm is an important factor in the consideration of dyspnoea and treatment of respiratory diseases. The acquisition of images with commonly used methods is limited by the patient position or duration of the procedure. We present the first images of the diaphragm acquired in an upright MR scanner, and estimate repeatability and differences in morphology depending on posture.
INTRODUCTION
Lung diseases such as chronic obstructive pulmonary disease (COPD), affecting > 1M people in the UK, are characterised by airflow limitation and hyperinflation of the lungs. Compromise to either diaphragm excursion or to its overall morphology further contributes to the symptoms by changing respiratory mechanics. Consequently, the characterisation of diaphragm shape is important for precision medicine and the consideration of interventions. Traditionally, the 3D geometry of the diaphragm is assessed using supine MR or CT. This puts an additional burden on the patient and is limited in its ability to investigate function in other positions and postures. A method capable of 3D reconstruction in various positions was proposed1, using ultrasound (US) and motion tracking, but required a long 30s breath-hold and was of limited utility since parts of the diaphragm may not be accessible to US.
Aim: to acquire preliminary MR images of the diaphragm in upright seated position and estimate the impact of subject position on its morphology.
METHODS
Two healthy subjects (20 and 23 yo) were repeatedly scanned on a 0.5T Paramed (Genoa, Italy) MR Open scanner with a torso coil at full inspiration. We used a 2D spin echo sequence to acquire 4 sets of 3 scans each, comprising sagittal (SAG, TE/TR=12/416 ms, FA=90°, FOV=36 cm, matrix=256 x 256, resolution=1.4 x 1.4 mm, 18 slices, slice thickness=16 mm, interslice gap=10 mm) and coronal scans (COR, TE/TR=12/350 ms, FA=90°, FOV=36 cm, matrix=256 x 256, resolution=1.4 x 1.4 mm, 18 slices, slice thickness=16 mm, interslice gap=10 mm) in supine (SUP) and seated (SEAT) position. Each scan took approximately 20 seconds.
A 3D surface of the diaphragm was semi-automatically reconstructed from each individual scan. The processing pipeline comprised rigid registration of supine and seated images to a common space, the manual selection of points on the diaphragm on each slice, and the 3D reconstruction of a gridded surface by interpolating between these points.
Repeatability was assessed by estimating the variability in displacement for each of the 4 sets, around the average ($$$\bar{S}_{COR,SUP}$$$, $$$\bar{S}_{COR,SEAT}$$$, $$$\bar{S}_{SAG,SUP}$$$ and $$$\bar{S}_{SAG,SEAT}$$$) at every grid point. The impact of the patient position on the diaphragm geometry was demonstrated by comparing the mean surfaces.
RESULTS
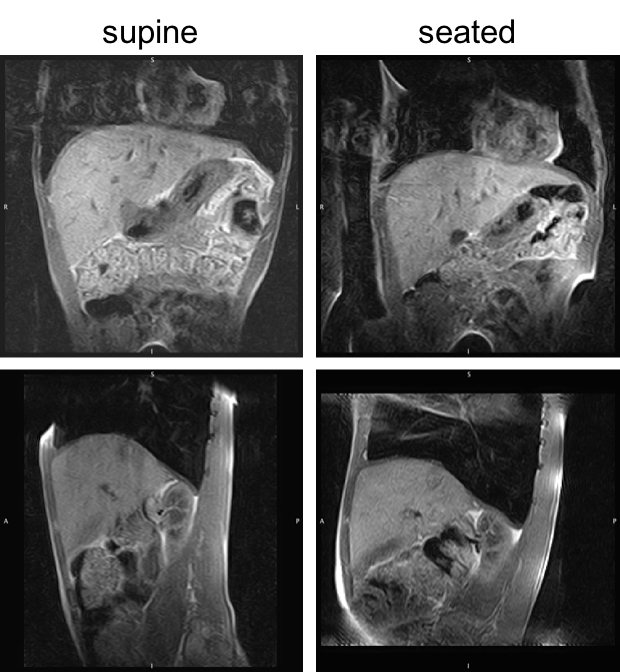
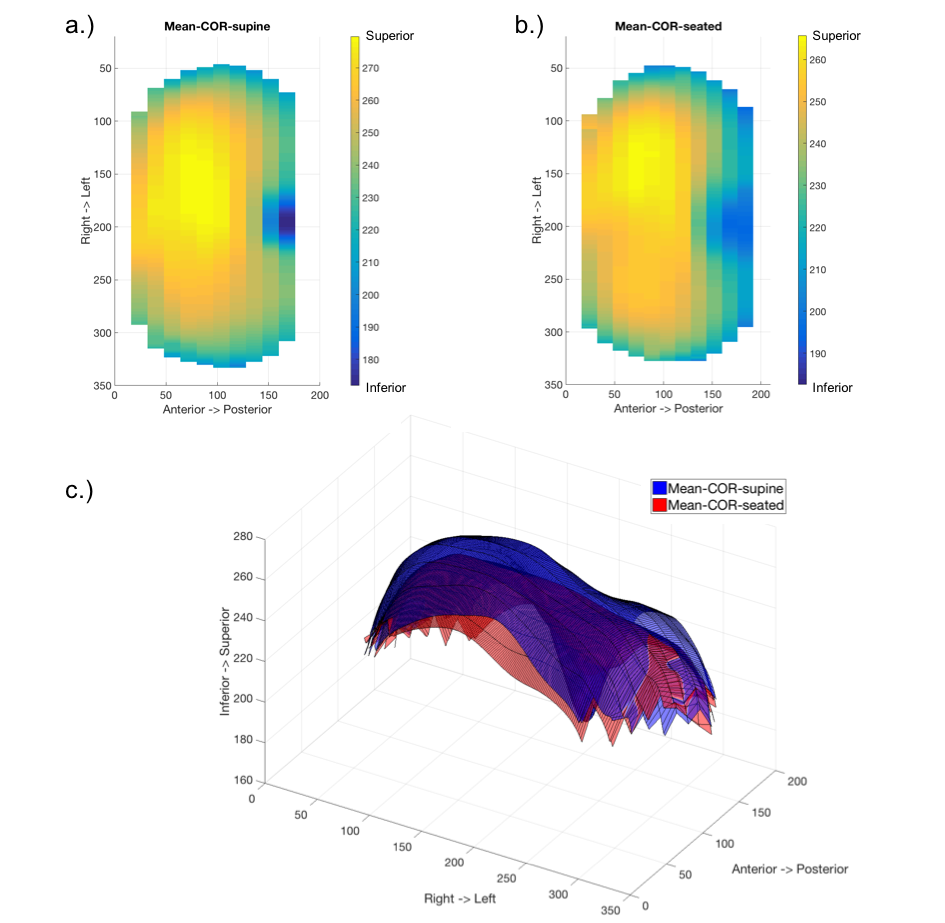
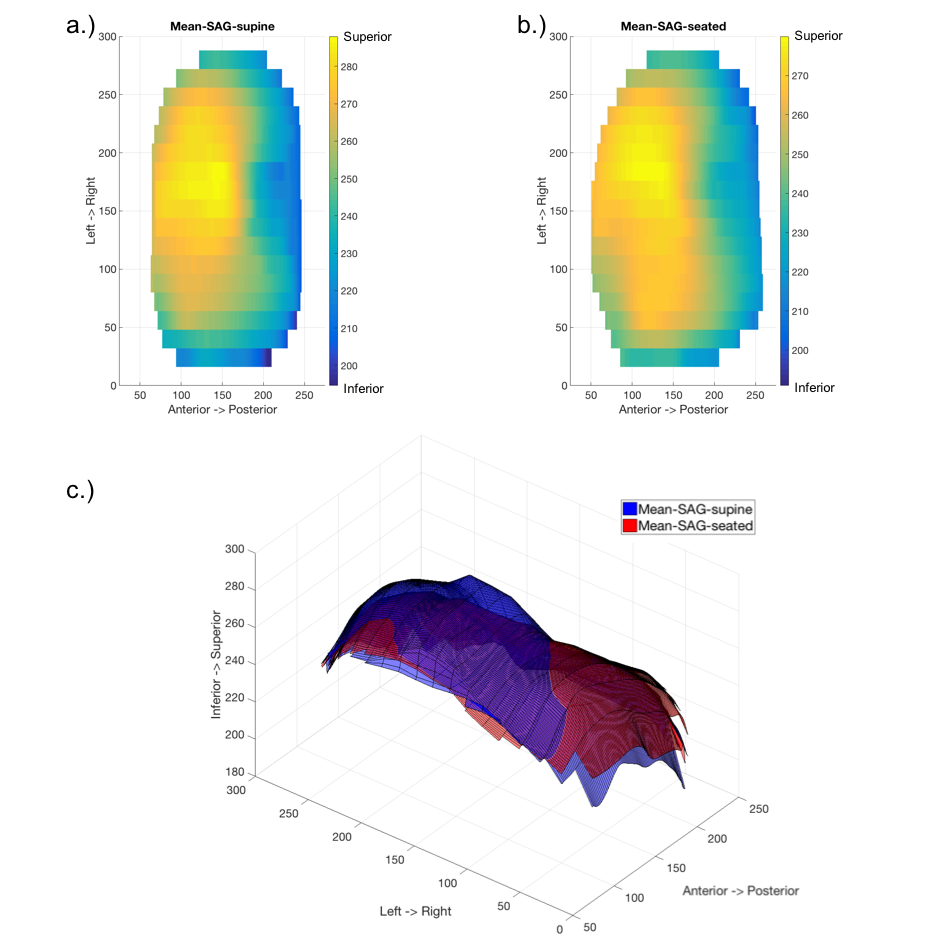
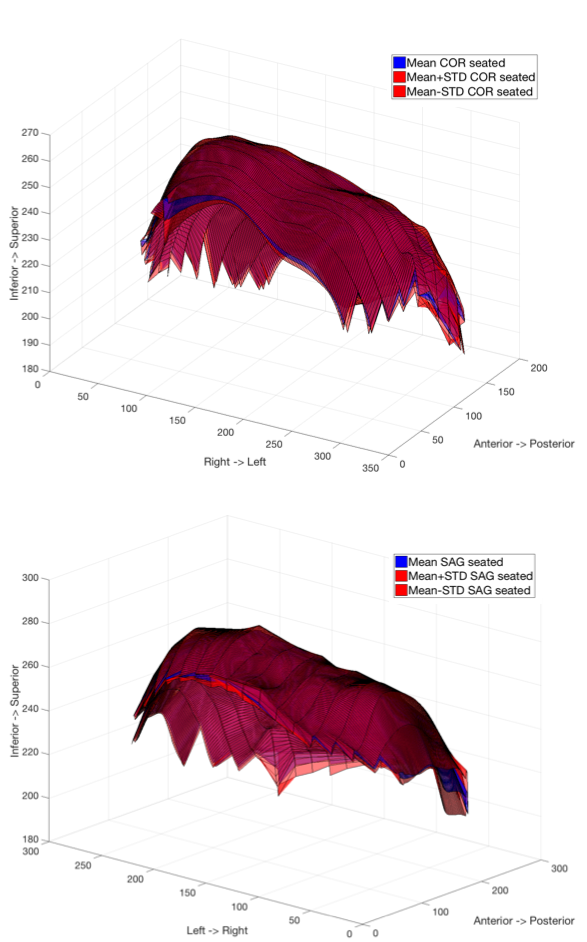
Figure 1 shows coronal and sagittal images of the same subject in supine position (left column) and upright seated position (right column). A difference in diaphragm morphology is noticeable around the liver where a larger radius of curvature is observed in the upright seated images. A similar shape difference is confirmed in the supine and seated mean surfaces reconstructed from coronal and sagittal slices in Figure 2 and 3 respectively. The repeatability estimates in Figure 4 illustrate the mean surfaces $$$\bar{S}_{COR,SUP}$$$ and $$$\bar{S}_{COR,SEAT}$$$ (blue) and the corresponding upper and lower bounds of the variability (red). The maximum variability in the seated position was $$$\sigma$$$ = 14.2 and 15.0 mm for coronal and sagittal scans respectively.DISCUSSION
We have developed a protocol for scanning the diaphragm using a low-field upright scanner, and have used the data to measure the diaphragm shape in seated and supine positions. The variability between scans is likely to be due to differences in the subject’s breath hold position between scans, partial volume effects, registration errors, and operator variability when selecting the points on the diaphragm. In the future we will study a larger group of healthy controls and parameterise the lung shape to allow quantitative comparisons. We will also investigate the minimum data set required to characterise the lung shape and reduction in scan time in order to develop a patient acceptable protocol.CONCLUSION
An open MRI scanner can be used to characterise changes in the shape of the diaphragm between an upright and supine position, which can provide important information for precision medicine.Acknowledgements
Funded by University of Nottingham and National Institute for Health Research (NIHR) Nottingham Biomedical Research CentreReferences
1. Quaranta M, Salito C, Magalotti E, et al. Non-invasive three-dimensional imaging of human diaphragm in-vivo. Annual International Conference of the IEEE Engineering in Medicine and Biology Society 2008; 5278-5281Figures