2464
Temporal and spatial evaluation of pulmonary blood flow using multiple delay PCASL at 1.5 Tesla1Department of Diagnostic and Interventional Radiology, University of Tübingen, Tübingen, Germany, 2Max Planck Institute for Biological Cybernetics, Tübingen, Germany, 3Section on Experimental Radiology, University of Tübingen, Tübingen, Germany, 4Institute of Signal Processing and System Theory, University of Stuttgart, Stuttgart, Germany, 5Department of Biomedical Magnetic Resonance, University of Tübingen, Tübingen, Germany
Synopsis
Pseudo-continuous-arterial-spin-labeling (PCASL) has been successfully applied in abdominal organs to image organ perfusion. The aim of this work was to evaluate the pulmonary blood flow in dependence on the cardiac cycle using PCASL at 1.5T. Labeling of pulmonary blood flow was achieved by ECG triggering and an labeling plane perpendicular to the pulmonary trunk (tagging duration 300ms). In five volunteers, eight measurements were acquired with fast True-FISP imaging (in-plane-resolution, 2.5×2.5mm2, coronal view) with post-labeling delays between 100 and 1500ms. The PCASL-True-FISP technique was able to precisely assess blood flow of pulmonary arteries, as well as perfusion of the lung parenchyma.
Introduction and Purpose
The evaluation of the regional blood flow of pulmonary vessels and lung parenchyma in various phases of the cardiac cycle with high spatial resolution can be of importance for the clinical diagnosis of diseases affecting e.g. the pulmonary arteries or the lung interstitium. Arterial spin labeling (ASL) MRI techniques have been used for non-invasive evaluation of perfusion in brain as well as in many extracranial organs such as kidney1, liver2, and lung3. Moreover, temporal and spatial development of the distribution of tagged blood in an organ can be characterized by a variation of the delay time between blood preparation and image recording. Bolar et al.4 applied a multiple delay ASL to evaluate the entire magnetic bolus delivery curve in the lung and found out a strong cardiac-cycle dependence of pulmonary blood flow. They used a pulsed ASL approach and a single-shot turbo spin echo sequence for data acquisition. Recently, a combination of PCASL of pulmonary arteries and True-FISP imaging provided high-quality perfusion images of the lung at 3T.5 However, a prerequisite for imaging of lung perfusion by MRI is the capability of deriving a measurable signal from the lung parenchyma, which is hampered by extremely heterogeneous magnetic susceptibility of this tissue.6 The total ASL signal might increased by measuring at low static magnetic field strength. The main goal of this work was to assess the potential of muti-delay PCASL with True-FISP data acquisition to measure the temporal and spatial development of pulmonary blood flow at 1.5T.Methods
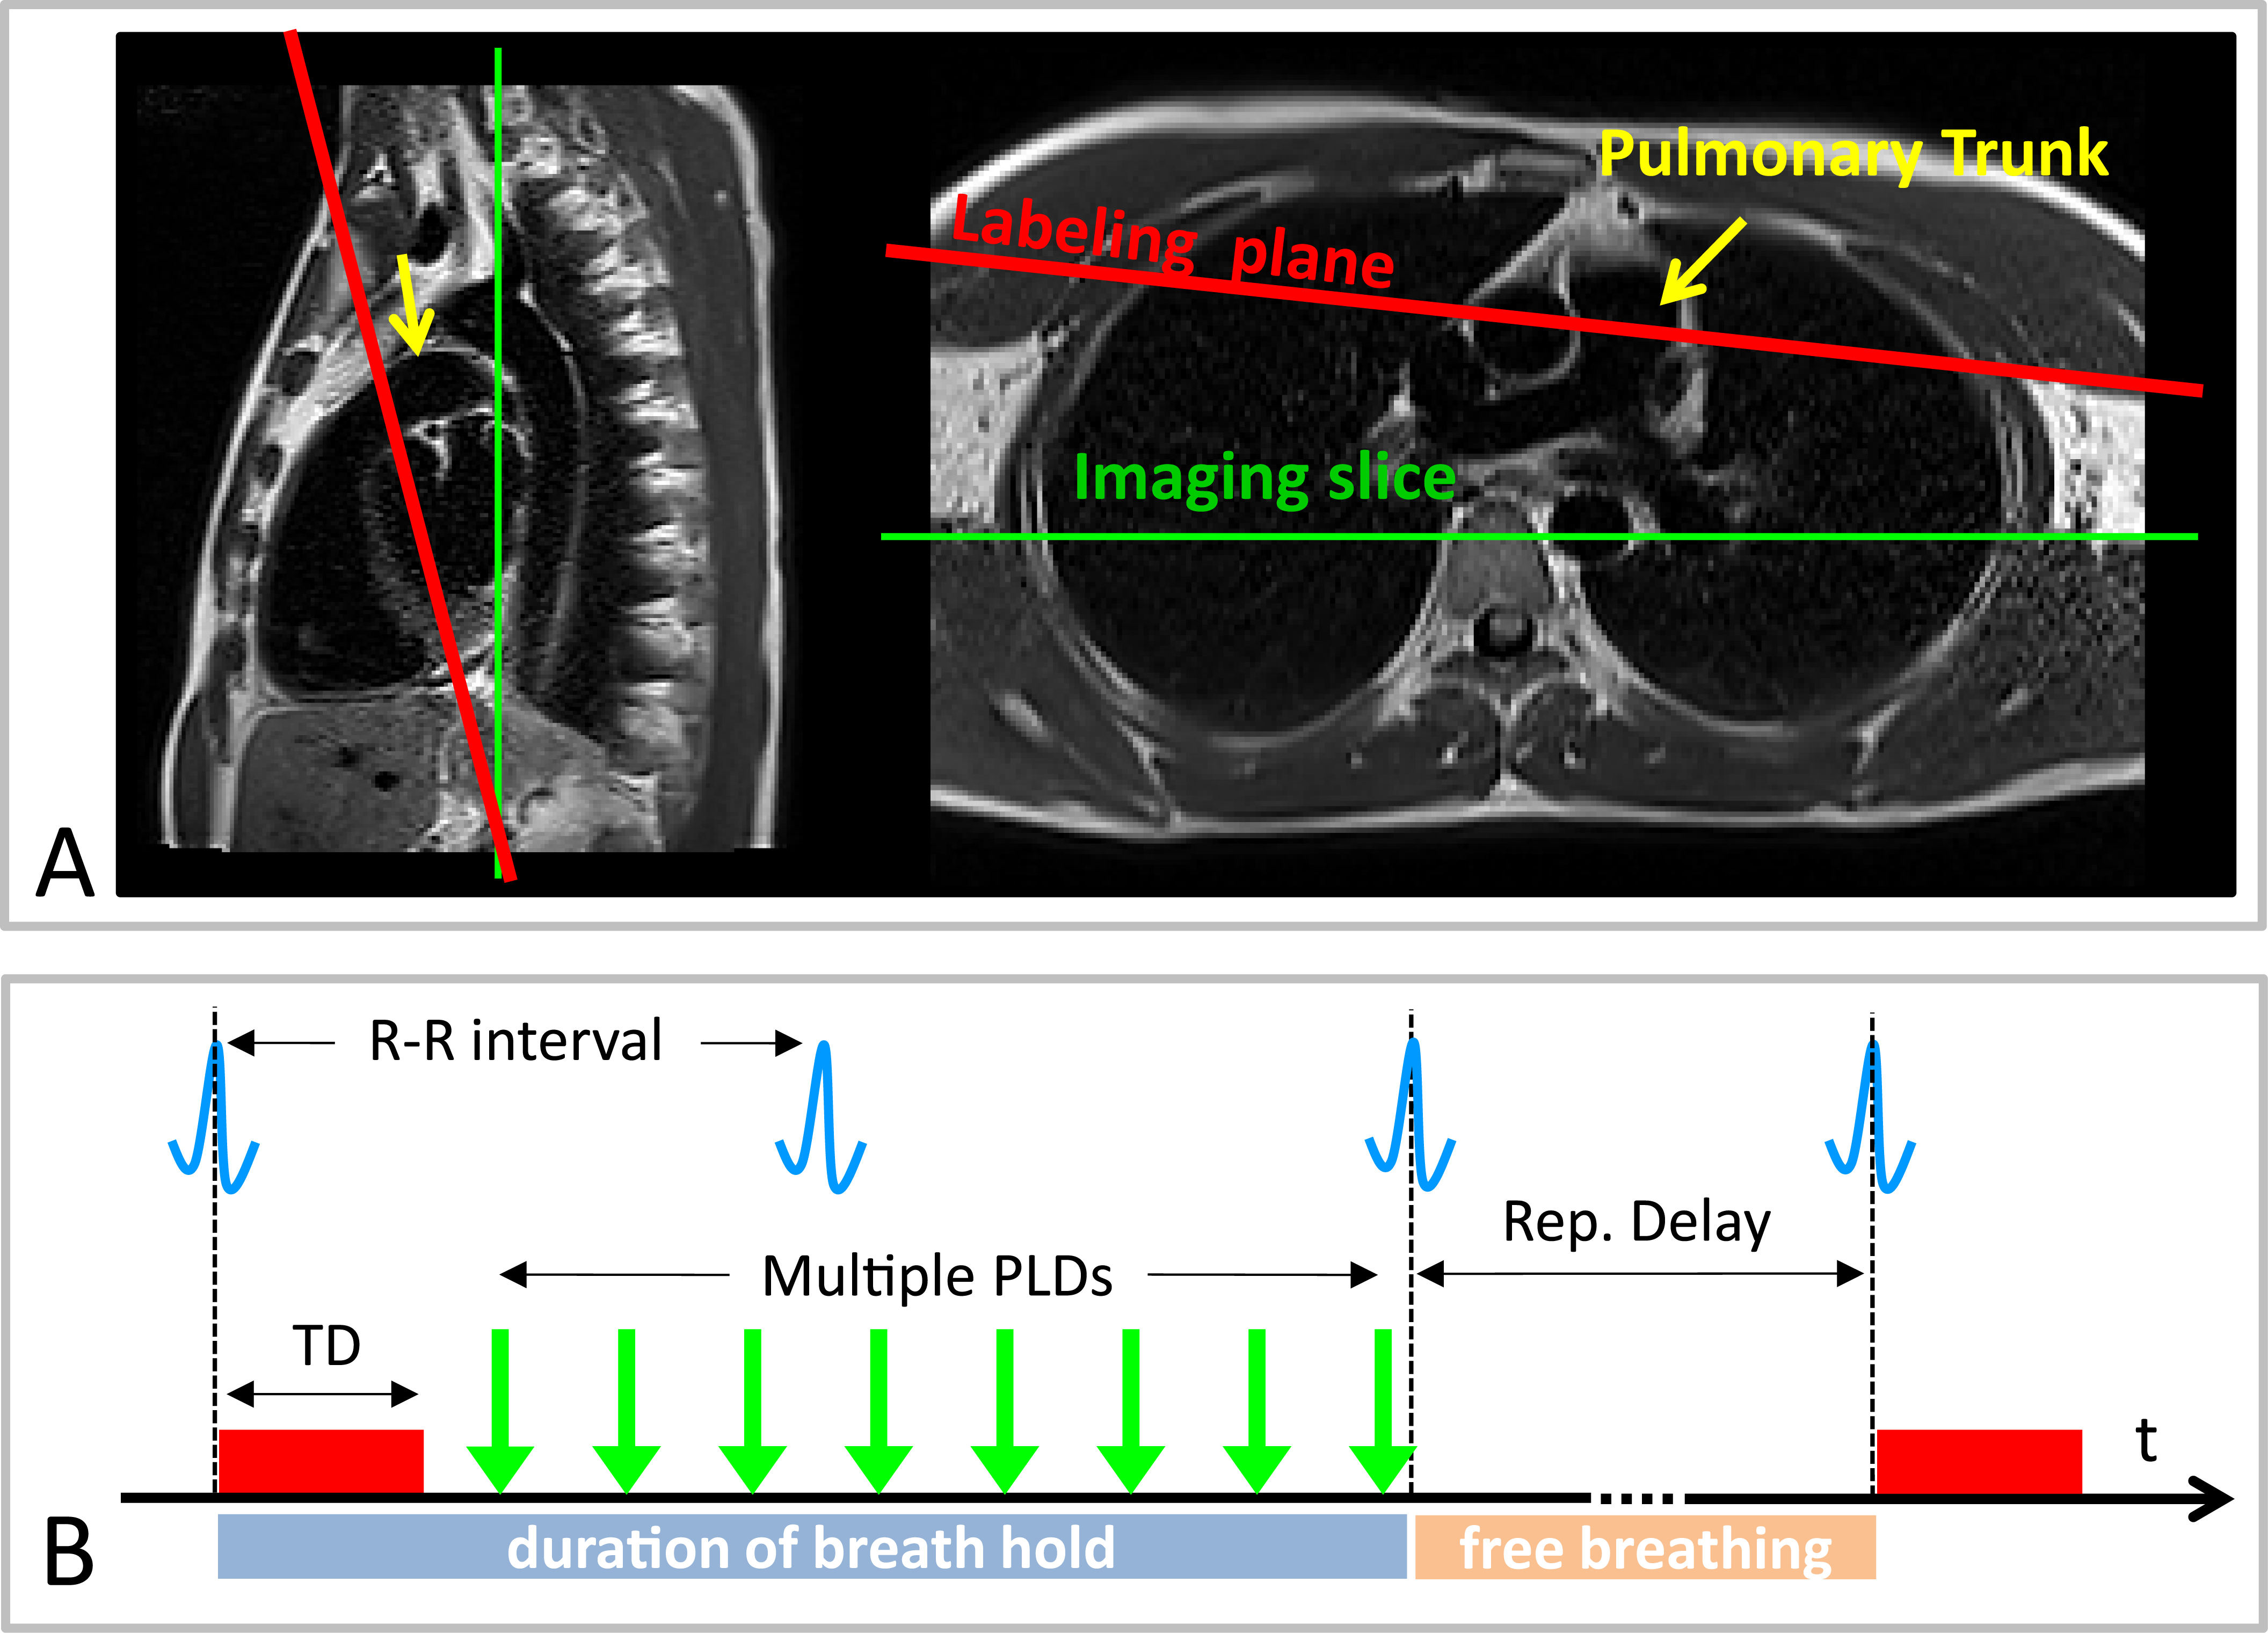
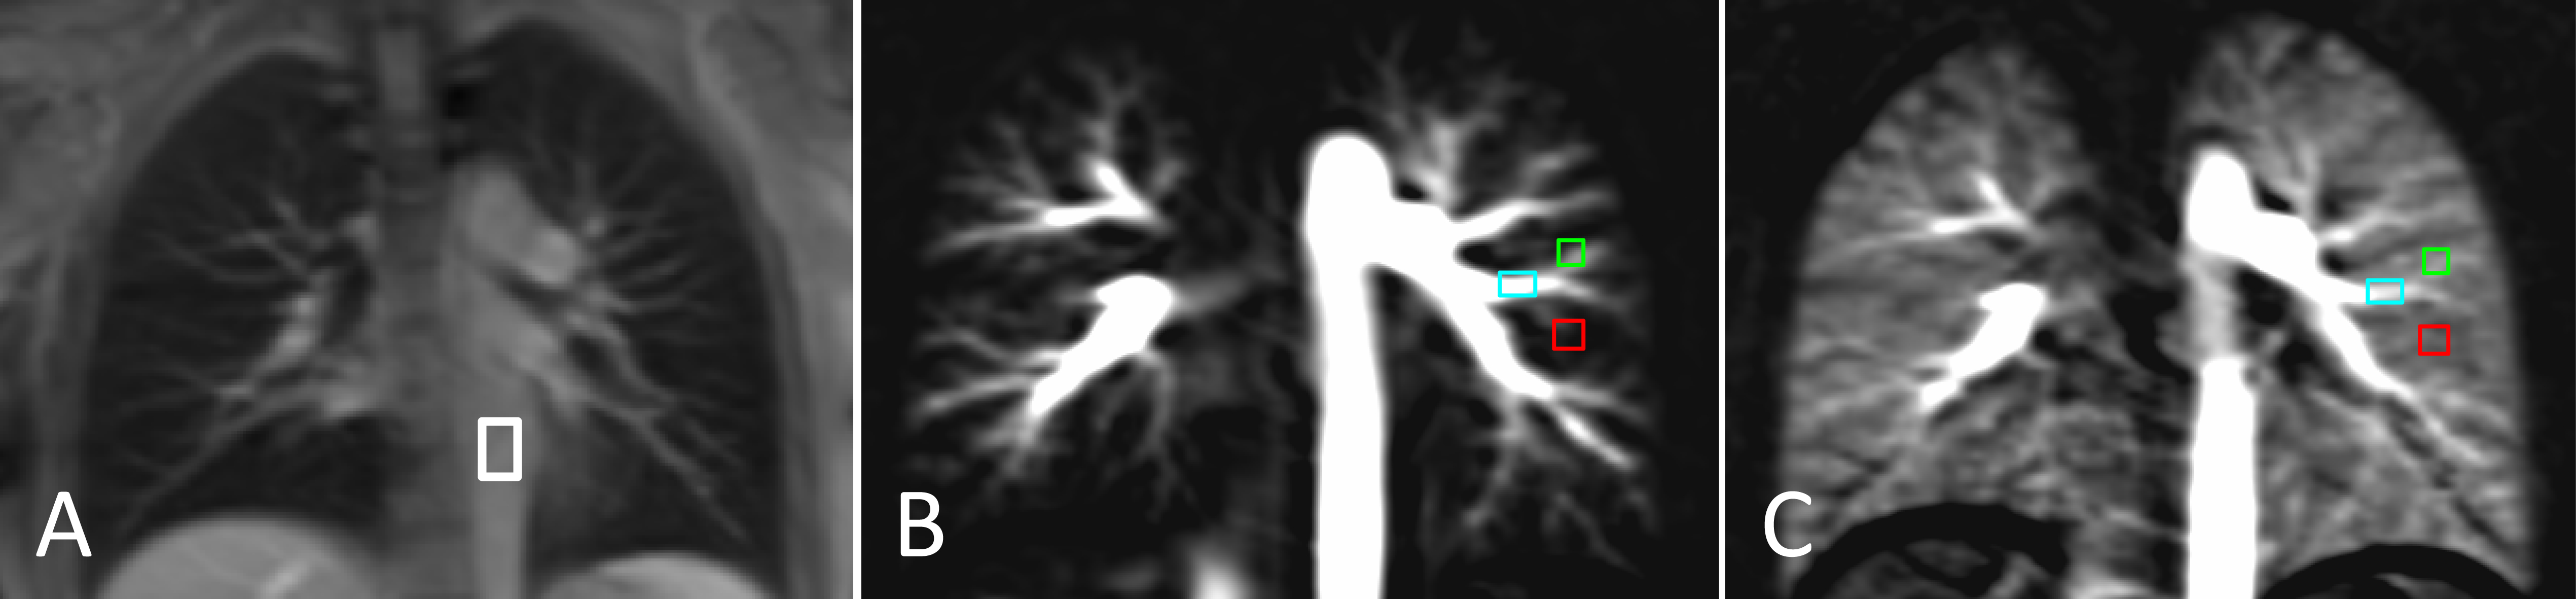
Measurements were performed on a 1.5T MR scanner (AvantoFit, Siemens Healthcare, Erlangen, Germany). Five healthy volunteers (32±10, one female) were examined using a PCASL sequence7 with a True-FISP imaging module. Eight measurements with post labeling delays (PLDs) between 100 and 1500 ms were conducted with the tagging duration of 300 ms, tagging flip angle of 25° and gradient strength 7 mT/m. The tagging plane was placed nearly perpendicular to the pulmonary trunk allowing simultaneous perfusion imaging of both lungs (Figure 1A). The tagging pulse was applied during the systolic period by ECG-triggering and the data acquisition was started after PLD time (Figure 1B). The True-FISP sequence was adapted to achieve short TE/TR (0.9/2.1 ms) using following parameters: flip angle, 70°; slice thickness, 10 mm; in-plane resolution, 2.5×2.5 mm2; partial Fourier, 0.75; matrix size, 144×192; readout bandwidth, 1260 Hz/Pixel. Ten label-control image pairs were acquired with a repetition delay of 5 s by employing a timed breathing protocol. A proton-density weighted True-FISP image was also acquired at the start of the sequence to estimate the M0B of the blood. The overall measurement time for eight measurements was 17:25 min. PCASL images were processed by self-written code in MATLAB (The MathWorks, Inc., Natick, MA, USA). Free-hand regions of interest (ROIs) were carefully placed in the small pulmonary arteries, a large pulmonary arteries and the lung parenchyma to assess the development of signal intensity in the perfusion images with different post labeling delays (see Figure 2).Results
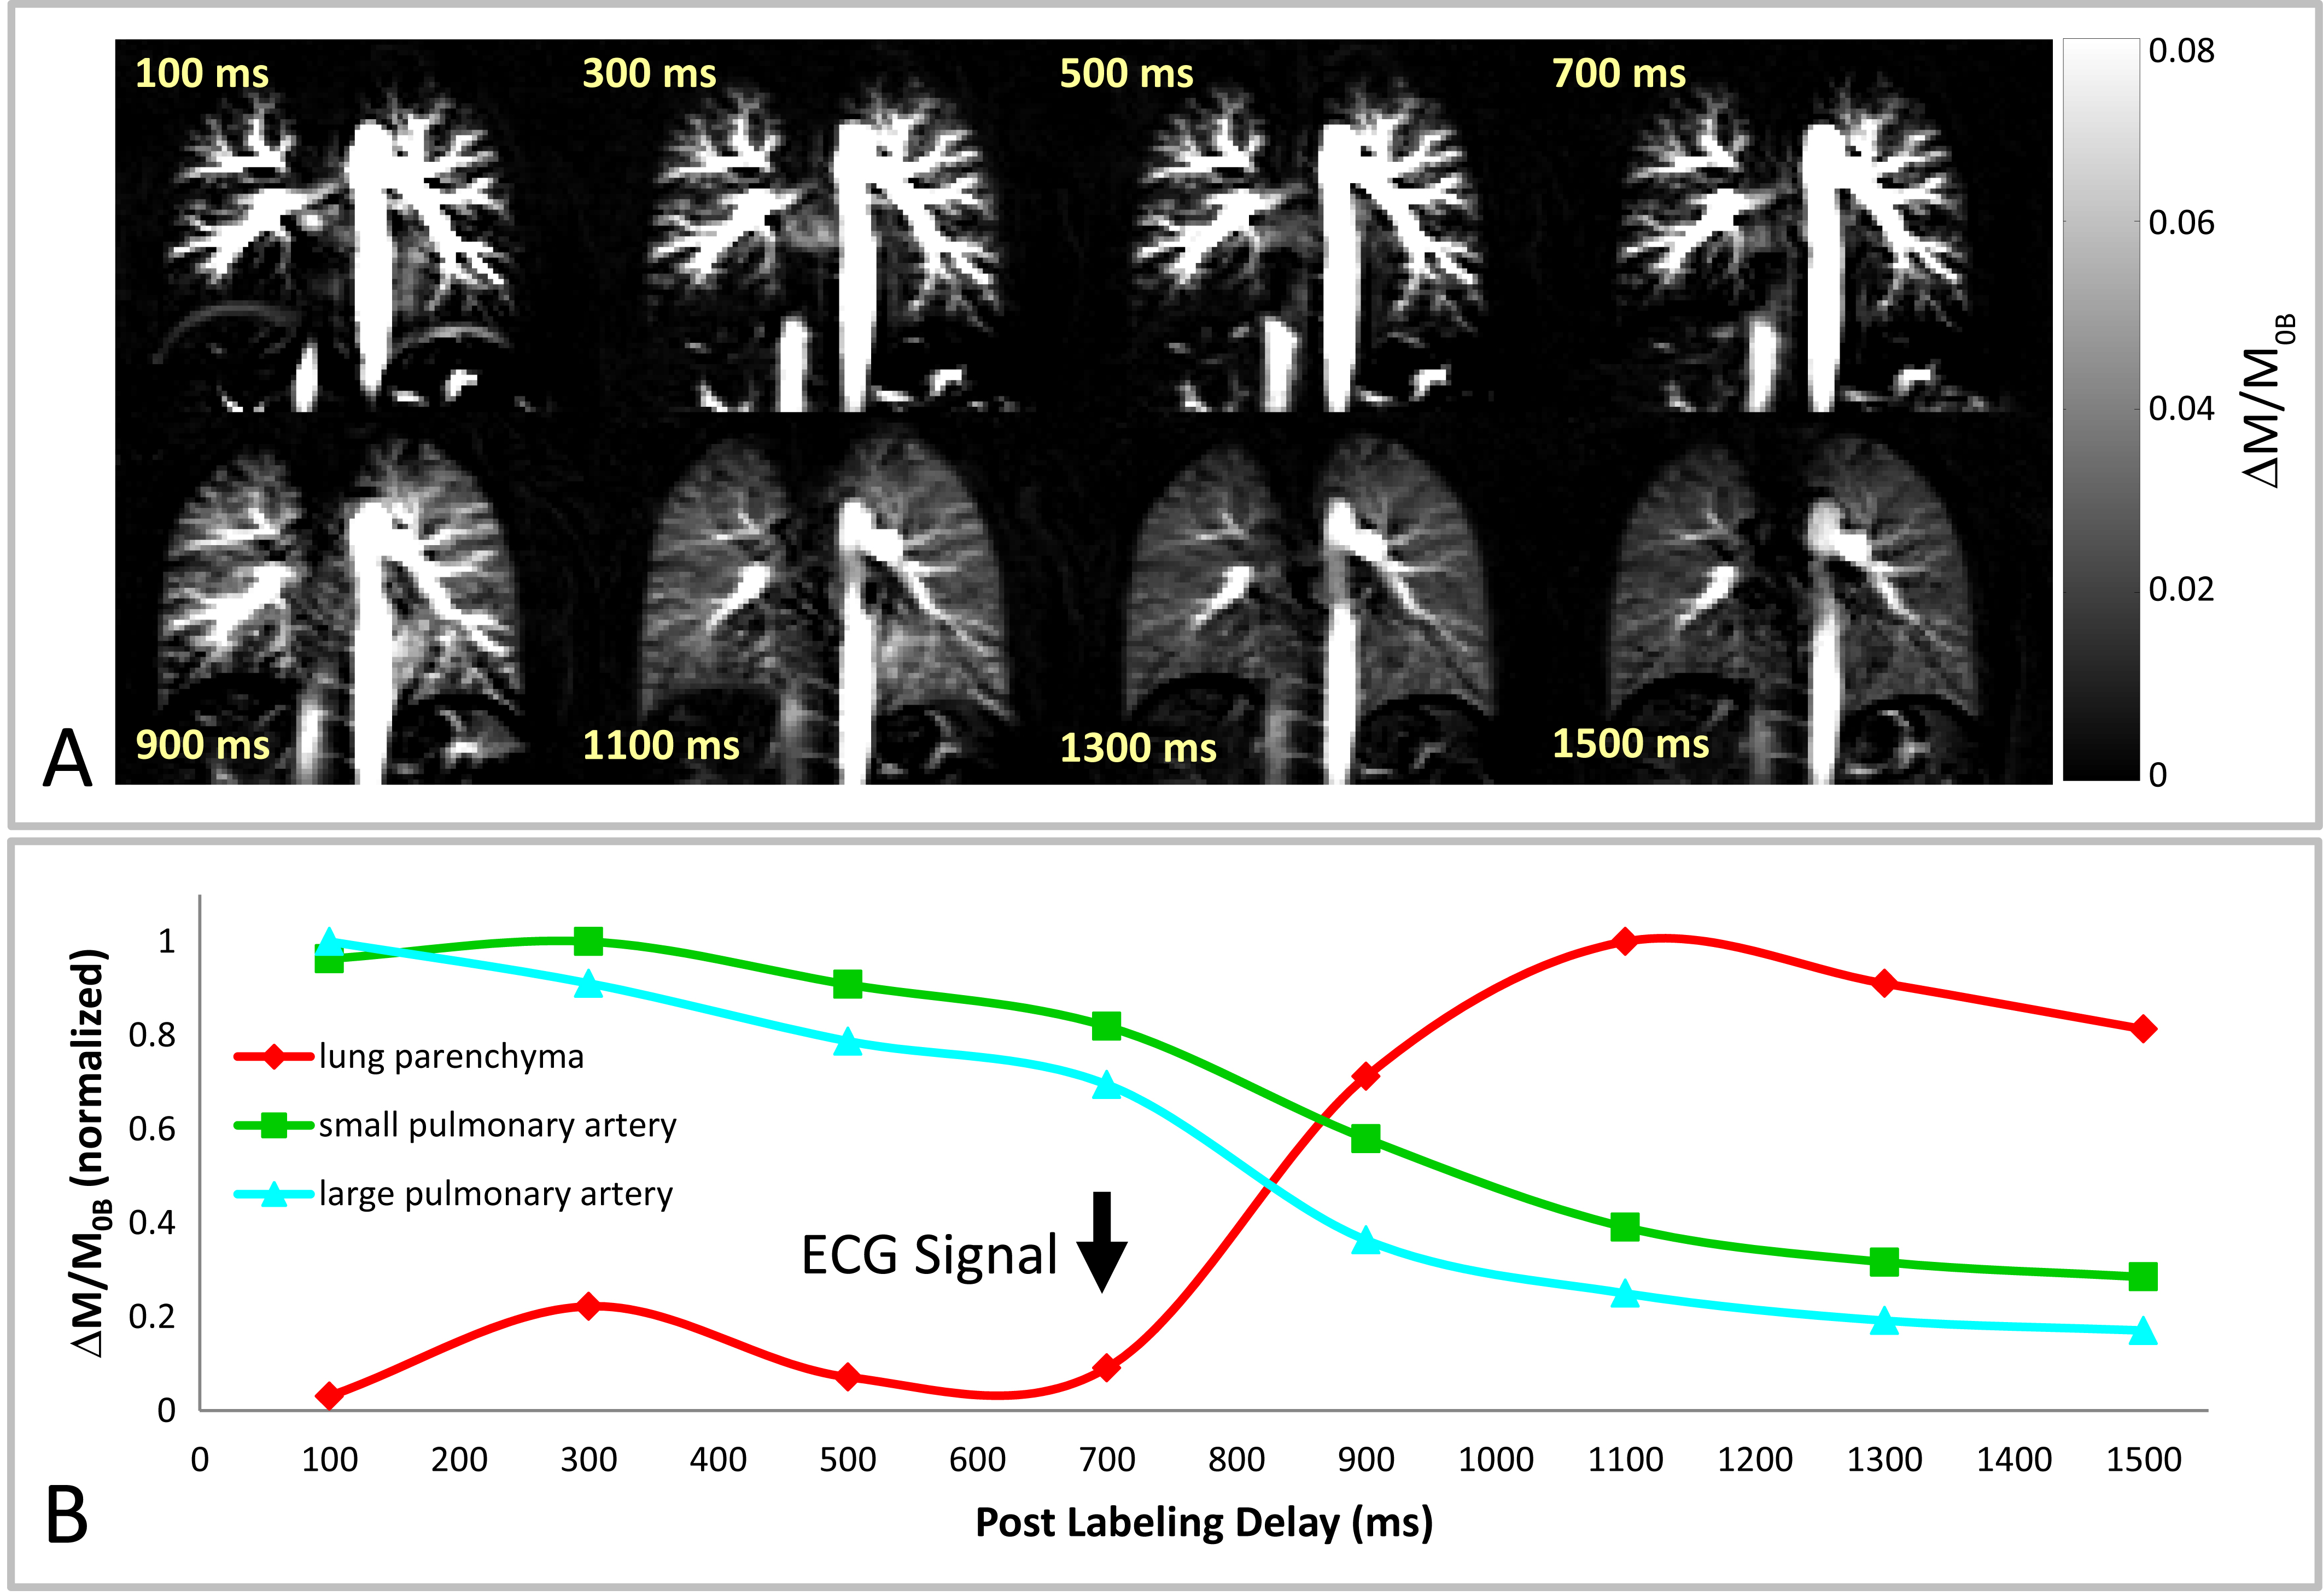
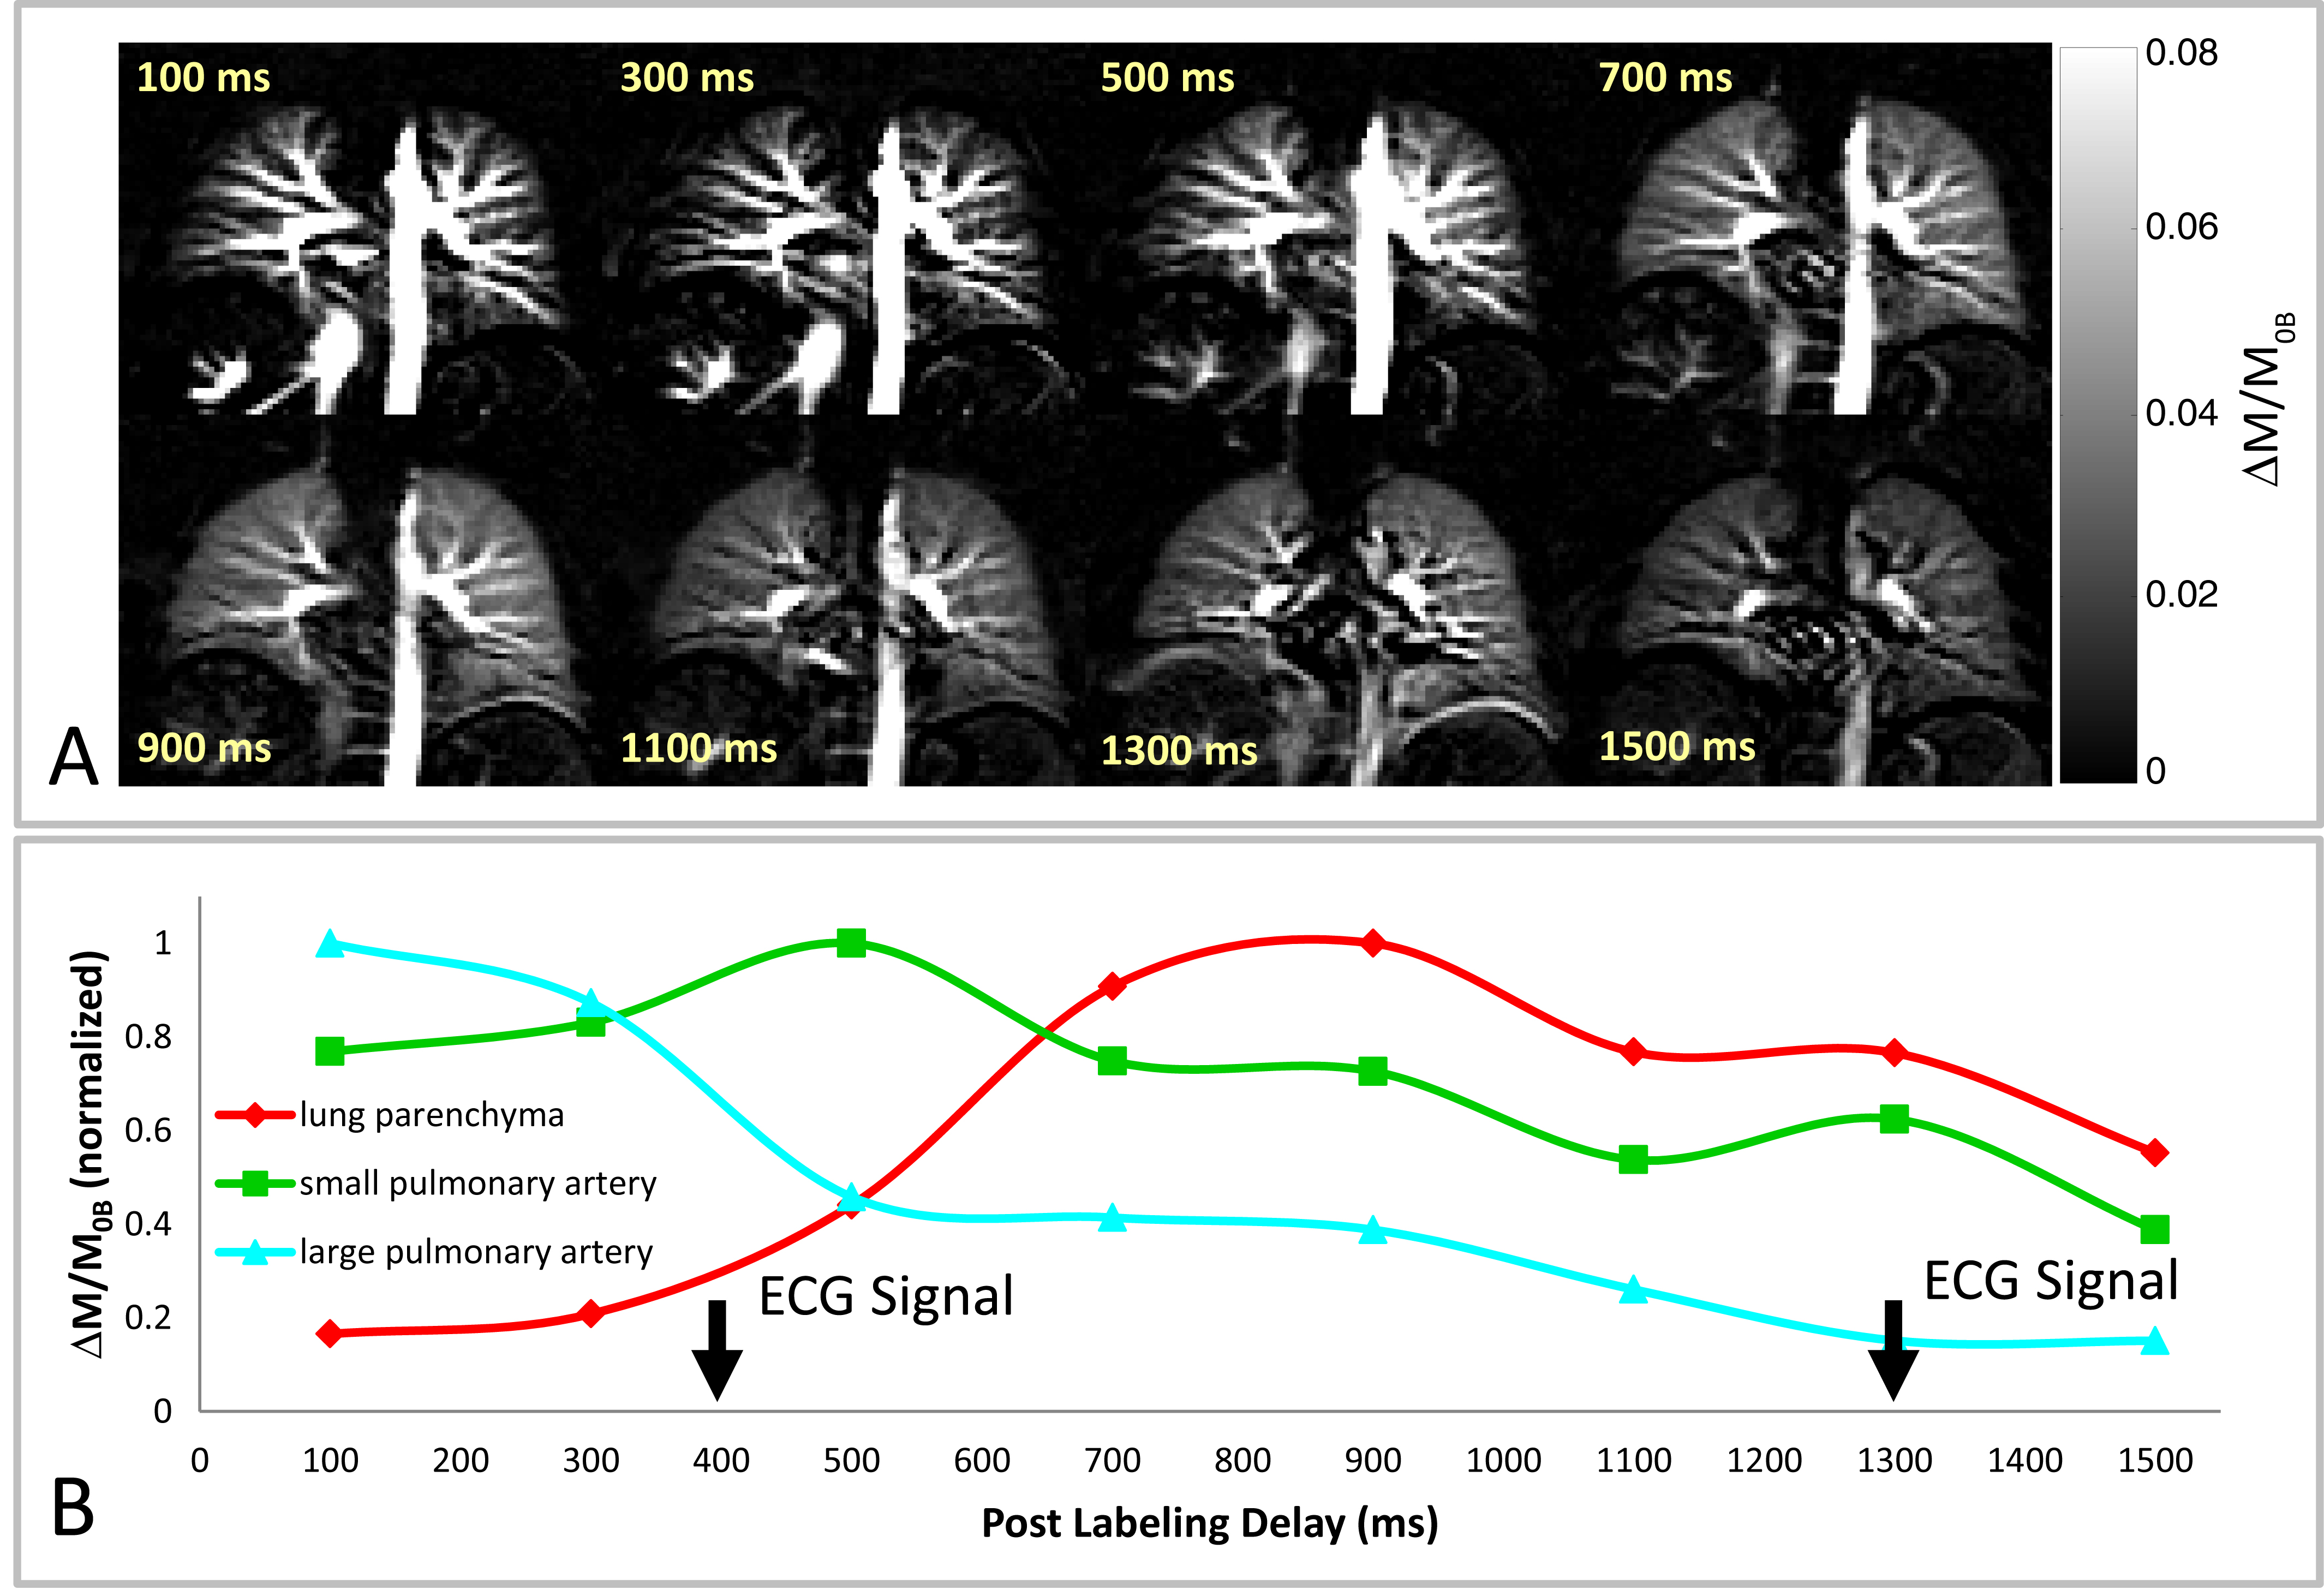
A series of perfusion-weighted images (ΔM/M0B) of the lung of a 29 year-old female healthy volunteer using PCASL with PLD values ranging from 100 ms to 1500 ms is depicted in Figure 3A. It is obvious that large blood vessels in the lung, containing considerable amounts of tagged blood, are already visible at short PLDs, whereas the perfusion signal from lung parenchyma is first increased at PLD of 900 ms. The temporal perfusion signal development in lung parenchyma as well as in small and large pulmonary arteries are shown in Figure 3B. The time point of the signal increasing in the lung parenchyma is nearly corresponded to the cardiac cycle of the examined subject (approx. 1000 ms). In Figure 4A, perfusion-weighted images of a 26 year-old male healthy volunteer with cardiac cycle of approx. 700 ms are displayed. The perfusion signal time course (Figure 4B) reveals an increasing of the lung parenchymal signal at PLDs of approx. 400 and 1300 ms, which is in good agreement with a shorter cardiac cycle of this subject.Discussion
We could demonstrate that ECG-triggered PCASL-True-FISP imaging at 1.5T has the potential to precisely image the perfusion-related signal of pulmonary arteries and lung parenchyma in dependence on the cardiac cycle. The combination of the PCASL sequence with fast True-FISP imaging provides perfusion images of the lung in high spatial resolution and with high signal intensity without the application of contrast media. Further prospective studies in patients are needed to evaluate the robustness of this technique in clinical routine.Acknowledgements
No acknowledgement found.References
1. Robson PM et al. Strategies for reducing respiratory motion artifacts in renal perfusion imaging with arterial spin labeling. Magn Reson Med 2009;61:1374–1387.
2. Schalkx HJ, et al. Arterial and portal venous liver perfusion using selective spin labelling MRI. Eur Radiol. 2015;25:1529-1540.
3. Mai VM, Berr SS. MR perfusion imaging of pulmonary parenchyma using pulsed arterial spin labeling techniques: FAIRER and FAIR. J Magn Reson Imaging 1999;9:483–487.
4. Bolar DS et al. Quantification of Regional Pulmonary Blood Flow Using ASL-FAIRER. Magn Reson Med 2006;55:1308–1317.
5. Martirosian P et al. Measurement of lung perfusion using optimized pseudo-continuous arterial spin labeling of pulmonary arteries and fast True-FISP imaging at 3 Tesla. In Proc. Intl Soc Mag Reson Med 2017, p. 1889.
6. Bieri O. Ultra-fast steady state free precession and its application to in vivo 1H morphological and functional lung imaging at 1.5 Tesla. Mag Reson Med 2013;70:657–663.
7. Pohmann R et al. Theoretical and experimental evaluation of continuous arterial spin labeling techniques. Magn Reson Med 2010;63:438–446.
Figures