2462
Pre-treatment DCE MRI predicts overall survival in patients with primary lung cancer1Radiology, Tongji Medical college affiliated to Huazhong University of Science and Technology, Wuhan, China, 2Radiology, University of Washington, Seattle, WA, United States, 3Radiation Oncology, University of Washington, Seattle, WA, United States
Synopsis
We tested whether pre-treatment standard DCE MRI imaging and clinical features can predict overall survival (OS) of 37 patients with primary lung cancer. Primary tumor volume (hazard ratio [HR] = 3.19 per 1-SD increase, P=0.001) and minimum intensity of the peak enhancement phase on DCE MRI (HR = 0.45, P=0.012) were significant predictors of OS on univariate Cox regression analysis. Univariate primary tumor volume model (c-index = 0.76, P=0.002) and multivariate LASSO Cox models based on DCE MRI features (c-index = 0.69, P=0.046) were positive predictors for OS with no statistically significant difference in performance (P=0.36).
Introduction
Lung cancer is one of leading causes of cancer death worldwide. Precise survival prediction before treatment is necessary for optimal therapy selection.1 In this work, we evaluate whether pre-treatment DCE-MRI and clinical features can predict overall survival (OS) in patients with pathologically proven primary lung cancer.Materials and methods
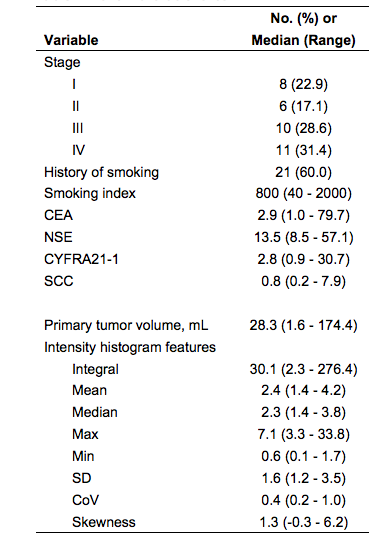
Thirty-seven patients with pathologically confirmed lung cancer and pretreatment DCE-MR imaging were included. DCE-MR scans consisted of a transverse orientation dynamic sequence using liver acquisition of volume acceleration (LAVA) with 30 sec temporal sampling, repeated for 18 frames. The baseline clinical features including smoking index (pack-years), four tumor plasma biomarkers (CEA, NSE, CYFRA21-1, SCC), and stage (based on the eighth edition AJCC/UICC stage classification criteria) were collected (Table 1). Contours defining the whole 3D tumor region for each patient were manually delineated slice-by-slice on the axial pre-contrast and post-contrast-T1 images by a chest radiologist using MIM 6.6TM (MIM software Inc., Cleveland, OH). Time-intensity curves were generated to guide selection of the peak enhancement phase. The peak enhancement phase images were subsequently fused with the pre-enhanced images to produce the enhancement ratio images. Ten intensity histogram features, including volume, integral, maximum, minimum, mean, median, kurtosis, skewness, standard deviation (SD) and the coefficient of variation (CoV), were extracted from the enhancement ratio images via MIM. Descriptive univariate screening of variables was conducted without multiple comparison adjustments. Multivariate analytical prediction models for OS were constructed using Cox regression with the least absolute shrinkage and selection operator (LASSO). Model performance was internally validated using the concordance index (c-index) calculated with the .632 bootstrap to account for training and testing using the same data set. Patients were median risk-stratified, and cross-validated Kaplan-Meier curves were generated.Results
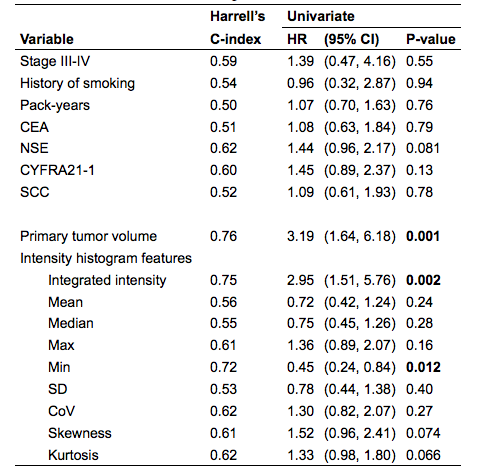
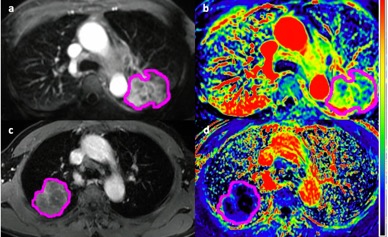
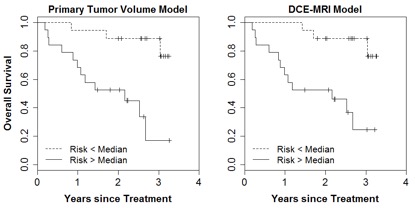
The median follow-up time was 27 months and 15 patients died during the follow-up interval. Univariate screening (Table 2) of all clinical and imaging variables for predicting overall survival revealed only the volume of the primary tumor (HR = 3.19 per 1-SD increase, P=0.001), integral of the peak enhancement phase intensity (HR = 2.95, p=0.002), and the minimum intensity of the peak enhancement phase as statistically significant predictors (HR = 0.45, P=0.012). Figure 1 shows a pair of example patients presenting with similar primary tumor volume and different minimum tumor perfusion, leading to different clinical outcome. The multivariate LASSO Cox model based on DCE-MRI intensity histogram features (c-index = 0.69, P=0.046) correlated with OS. The LASSO Cox model based on clinical features only, including stage, smoking index and plasma biomarkers was not significantly predictive of survival (c-index = 0.50, P>0.99). When comparing the bootstrap-adjusted performance of different models, we found no statistically significant difference in the performance of the univariate primary tumor volume model (c-index = 0.76) and the DCE-MRI feature model (Δc-index =-0.08, 95% CI: -0.28 to 0.10), P=0.36). Risk-stratification (Figure 2) based on volume (28 cc cutoff) produced low/high risk-subgroups with 2-year OS of 89% vs. 53%, while those based on DCE-MRI features produced different subgroups (10 patients reclassified) but with the same 2-year OS.Discussion
In our study, we assessed and compared the performance of different clinical and imaging features for predicting the overall survival of primary lung cancer patients. Volume of the primary tumor was the strongest individual predictor during univariate analysis, wherein increasing volume was associated with shorter survival time. In a prior study, it was reported that tumor size was one of the most important prognostic factors and almost linearly associated with prognosis.2,3,4 In addition, DCE-MRI minimum intensity in the peak enhancement phase was correlated with the overall survival in our patient cohort, with an increase of minimum intensity associated with longer survival time. The minimum intensity likely represents the DCE-MRI voxels within the heterogeneous tumor with poorly perfused cell populations, which may be more likely to be resistant to treatment, which may impact clinical outcome. This finding is insistent with a previous DCE-MRI study of cervical cancer, reporting that the lowest 10th percentile of DCE independently predicted disease recurrence.5 Further investigation of DCE-MRI features of low perfusion regions within heterogeneous tumors is warranted for outcome prediction in primary lung cancer patients.Conclusion
The primary tumor volume and the minimum tumor perfusion in the peak enhancement phase of DCE-MRI are predictive of overall survival. Prediction models based on DCE-MRI features should be considered in lung cancer patient risk stratification and treatment selection.Acknowledgements
No acknowledgement found.References
1. Yoon SH, Park CM, Park SJ, Yoon J-H, Hahn S, Goo JM: Tumor Heterogeneity in Lung Cancer: Assessment with Dynamic Contrast-enhanced MR Imaging. Radiology 2016; 280:940–948.
2. Donegan WL. Tumor-related prognostic factors for breast cancer. CA Cancer J Clin 1997; 47:28–51.
3. Michaelson JS, Silverstein M, Wyatt J, et al. Predicting the sur- vival of patients with breast carcinoma using tumor size. Cancer 2002; 95:713–723
4. Carter CL, Allen C, Henson DE. Relation of tumor size, lymph node status, and survival in 24,740 breast cancer cases. Cancer 1989; 63:181–187
5. Mayr NA, Yuh WTC, Jajoura D, et al. Ultra-early predictive assay for treatment failure using functional magnetic resonance imaging and clinical prognostic parameters in cervical cancer. Cancer. 2010;116(4):903–912.
Figures