2456
Effects of Neonatal Lung Abnormalities on Parenchymal R2* Estimates1Medical Physics, University of Wisconsin - Madison, Madison, WI, United States, 2Center for Pulmonary Imaging Research, Division of Pulmonary Medicine and Department of Radiology, Cincinnati Children's Hospital Medical Center, Cincinnati, OH, United States, 3Physics, Washington University in St. Louis, St. Louis, MO, United States, 4Imaging Research Center, Cincinnati Children's Hospital Medical Center, Cincinnati, OH, United States, 5Radiology, University of Missouri, Columbia, MO, United States, 6Physics, University of Cincinnati, Cincinnati, OH, United States, 7Perinatal Institute, Division of Neonatology and Pulmonary Biology, Cincinnati Children's Hospital Medical Center, Cincinnati, OH, United States
Synopsis
We estimate pulmonary tissue densities (TD) and R2* in neonatal intensive care unit patients with and without diagnoses of lung disease as well as in healthy adults using multi-echo 3D ultrashort echo time MRI. As anticipated, a clear negative relationship between TD and R2* is evident. However, after correcting for TD variation, we find significant differences in R2* between diseased and non-diseased neonates, suggesting that MRI can probe differences in susceptibility and/or sub-voxel tissue geometry which may increase understanding of neonatal lung tissue pathologies.
Purpose
Lung pathology is common in the neonatal intensive care unit (NICU) population. Due to the elevated risk of exposure to ionizing radiation in the NICU population, there is a need for safe and clinically useful imaging alternatives to x-ray computed tomography (the current gold standard for structural lung imaging) to evaluate neonatal lung disease. Improvements in imaging technologies suitable for longitudinal evaluation are crucial for advancing clinicians’ understanding of the underlying physiologic basis for neonatal lung disease and its relationship with patient outcomes. Previous work has demonstrated tissue density (TD) and R2* relaxation rate estimation in neonatal pulmonary parenchyma during non-sedated quiet breathing using multi-echo ultrashort echo time (UTE) MRI and self-navigated retrospective respiratory gating1-3. That work suggested a negative relationship between TD and R2*, which is supported by recently published numerical models4. In this work, we further explore this relationship and the influence of neonatal lung abnormalities.Methods
All studies were approved by our institutional review board, HIPAA compliant, and conducted with patient/parental consent. 17 neonatal patients underwent MRI in the NICU (post-menstrual ages 36-43 weeks at imaging) on a 1.5T scanner5,6 designed for neonatal imaging, using a body coil. A subset of the neonates had no clinical indication of lung disease (Control, N=5), while other groups had either a diagnosis of bronchopulmonary dysplasia (BPD, N=7) or congenital diaphragmatic hernia (CDH, N=5). CDH patients were imaged pre-surgical repair. A 3-D radial UTE MRI sequence2 was modified to acquire radial views at 4 different echo times (TE = 0.20ms, 0.95ms, 1.70ms, 2.45ms; 50,000-75,000 projections per TE, 1.4mm isotropic resolution). For comparison, 4 healthy adults underwent MRI on a conventional 1.5T scanner using the same imaging sequence with an 8-channel coil and parameters adjusted for adult lungs (TE = 0.09ms, 0.59ms, 1.09ms, 1.59ms; 25,000 projections per TE, 2.0 mm isotropic resolution). Spatial coil sensitivity variations were adjusted using a bias field correction7. The center of k-space was used for self-navigated retrospective respiratory gating3 to the end-tidal expiration phase (50% acceptance window). R2* and spin density (M0) were estimated voxel-wise using a mono-exponential model. Parenchymal TD was formulated by normalizing M0 to adjacent muscle signal (expressed as % of muscle), motivated by the assumption that lung and muscle tissues have similar T1-weightings2,8. Average whole-lung (both lungs combined) estimates of TD and R2* were compared using ANOVA. Notably, CDH lungs were not separated because results from each were not statistically-significantly different. Images were also down-sampled to 1cm isotropic resolution to increase signal-to-noise ratio and lung voxels were separated by TD into 10 bins (0-10%,10-20%,…,90-100%). Group-wise comparisons of binned values of mean R2* were performed using ANOVA to investigate R2* differences independent of variation due to TD.Results
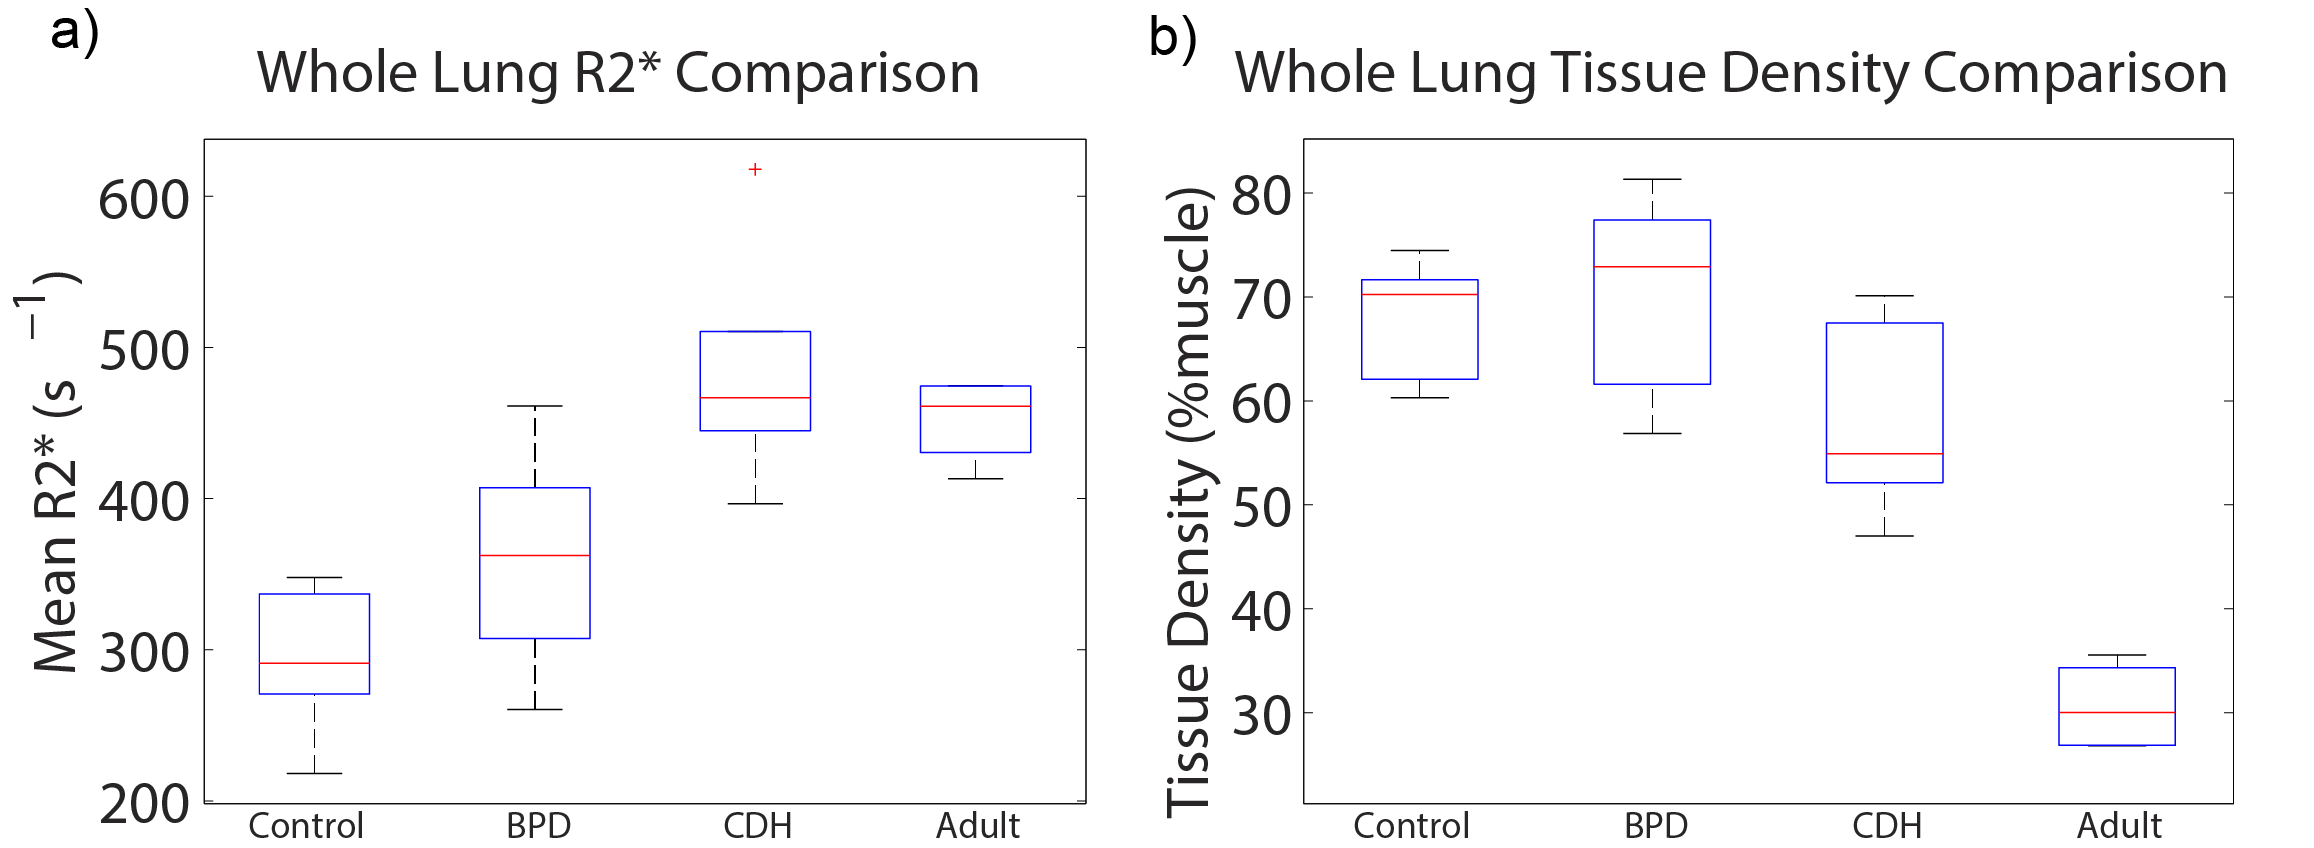
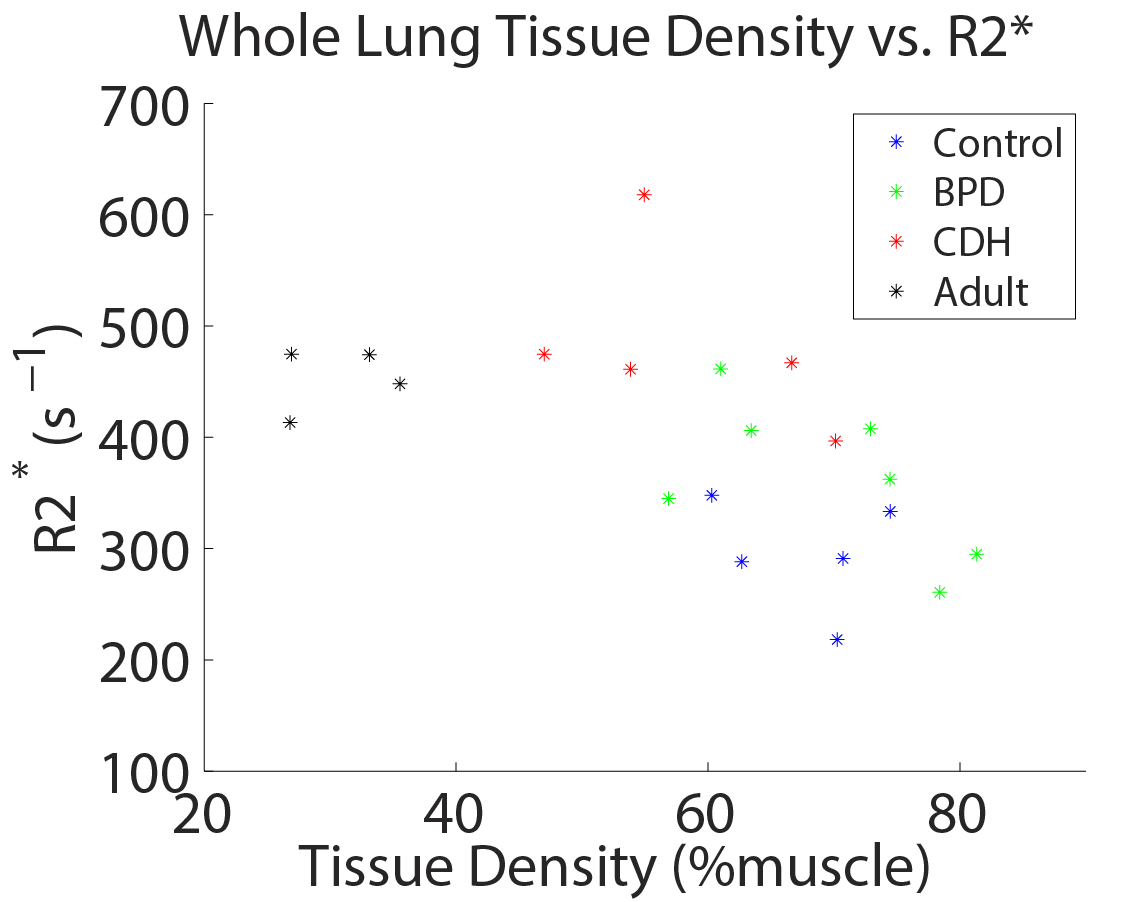
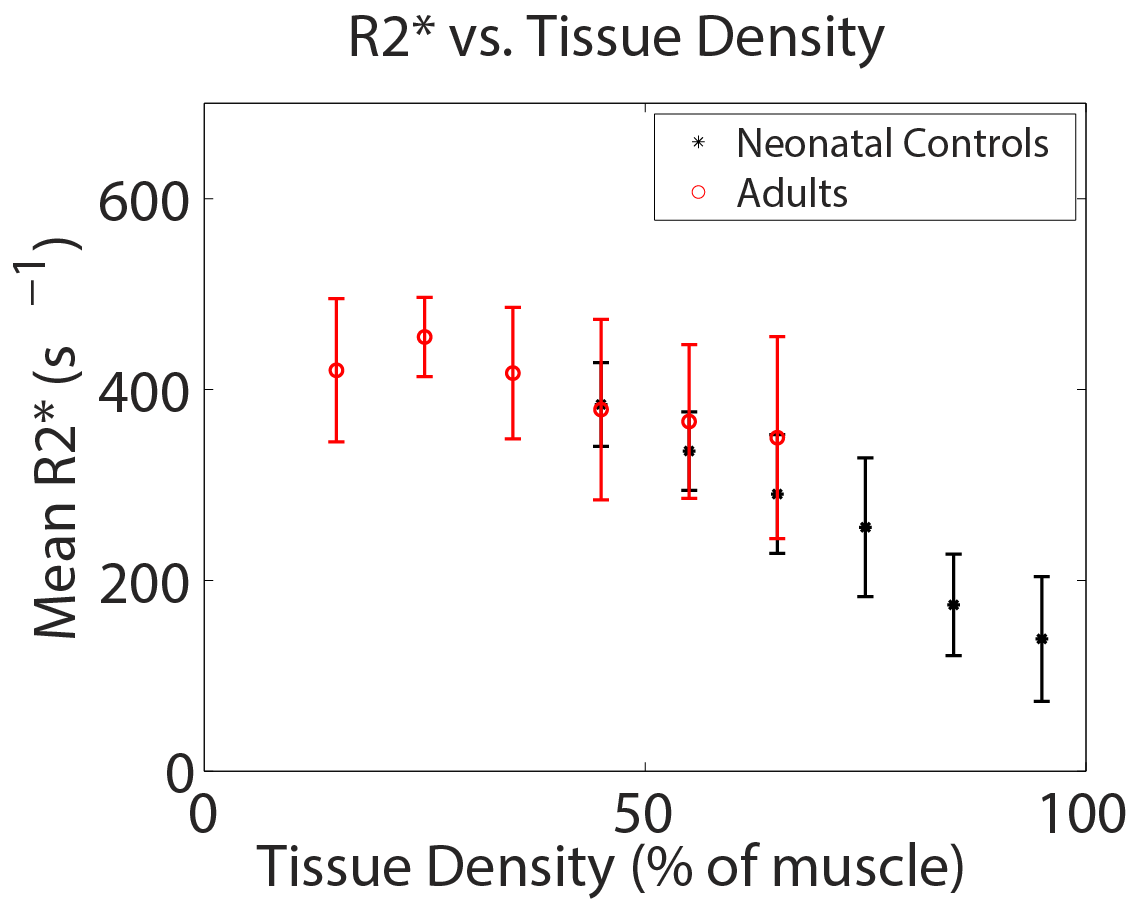
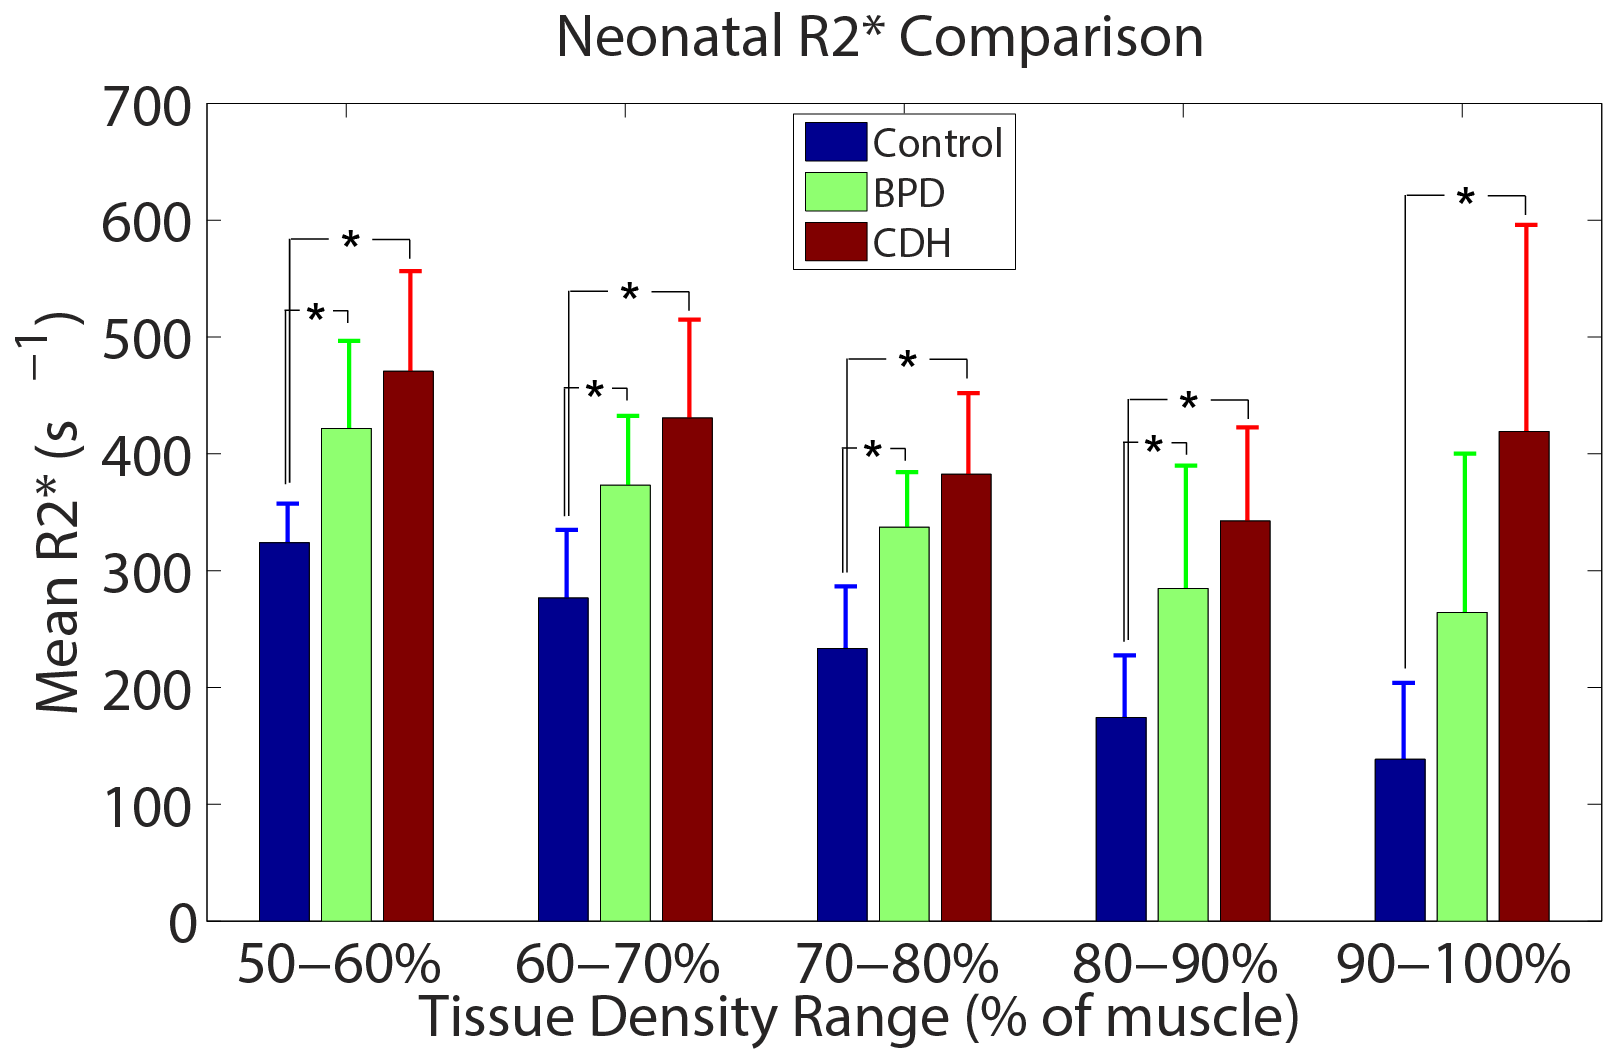
Boxplots of whole-lung mean tissue density and R2* for each group are shown in Figure 1. Relative to neonatal controls, R2* is significantly higher in CDH (P=2.1e-4) and adults (P=0.002), but not BPD (P=0.09), while TD is significantly different in adults (P=2.6e-6), but not BPD (P=0.66) or CDH (P=0.09). However, BPD and CDH groups have both significantly different R2* (P=0.005) and TD (P=0.03) relative to each other. Figure 2 shows a scatterplot of average R2* vs. TD, demonstrating a strong negative relationship in non-diseased patients (r=-0.89, P=0.002) separately and a more moderate correlation across all subjects (r=-0.56, P=0.008). Including both TD and subject group as explanatory variables for R2* in the ANOVA accounts for the difference between controls and adults (P=0.81) and results in significantly different R2* between controls and BPD (P=0.04) independent of TD differences. A scatterplot of R2* vs. TD within different ranges of TD underscores the similarity between adults and controls (Figure 3) with no significant difference in R2* found between controls and adults for any TD range. Similar comparisons between the three neonatal groups are shown using bar graphs in Figure 4. CDH and BPD patients have significantly higher R2* than controls in 5/5 and 4/5 valid bins, respectively. Notably, CDH > BPD > control in all bins.Discussion and Conclusion
These results further support a negative relationship between pulmonary TD and R2*, and that relationship appears consistent between non-diseased neonates and adults. R2* differences between the adult and neonatal control groups disappear after controlling for (the significant) differences in TD. Similar analysis in NICU patients with BPD and CDH indicates differences in R2* that cannot be explained through TD differences alone. These results potentially suggest differences in susceptibility and/or sub-voxel tissue geometry in NICU patients with clinically relevant lung disease that can be probed using UTE and multi-echo radial MRI.Acknowledgements
The authors would like to acknowledge financial support from The Hartwell Foundation, GE Healthcare, The Perinatal Institute at Cincinnati Children’s Hospital Medical Center, and NIH P01 HL070831.References
1. Hahn A, Higano N, Tkach J, Walkup L, Thomen R, Cao X, Merhar S, Woods J, Fain S. (2007) Proton Density and R2* Estimation of Neonatal Lung Parenchyma During Free Breathing with UTE MRI. Proc. Intl. Soc. Magn. Reson. Med. 25, p. 1191.
2. Hahn AD, Higano NS, Walkup LL, Thomen RP, Cao X, Merhar SL, Tkach JA, Woods JC, Fain SB. (2016) Pulmonary MRI of neonates in the intensive care unit using 3D ultrashort echo time and a small footprint MRI system. J Magn Reson Imaging. 45(2):463-471.
3. Higano NS, Hahn AD, Tkach JA, Cao X, Walkup LL, Thomen RP, Merhar SL, Fain SB, Woods JC (2016) Retrospective respiratory self-gating and removal of bulk motion in pulmonary UTE MRI of neonates and adults. Magn Reson Med. 77(3):1284-1295.
4. Buschle LR, Kurz FT, Kampf T, Wagner WL, Duerr J, Stiller W, Konietzke P, Wunnermann F, Mall MA, Wielputz MO, Schlimmer HP, Ziener CH. (2017) Dephasing and diffusion on the alveolar surface. Phys. Rev. E. 95(2-1):022415.
5. Tkach JA, Hillman NH, Jobe AH, Loew W, Pratt RG, Daniels BR, Kallapur SG, Kline-Fath BM, Merhar SL, Giaquinto RO, Winter PM, Li Y, Ikegami M, Whitsett JA, Dumoulin CL. (2012) An MRI system for imaging neonates in the NICU: initial feasibility study. Pediatr Radiol. 42(11):1347-56.
6. Tkach JA, Merhar SL, Kline-Fath BM, Pratt RG, Loew WM, Daniels BR, Giaquinto RO, Rattan MS, Jones BV, Taylor MD, Tiefermann JM, Tully LM, Murphy EC, Wolf-Severs RN, LaRuffa AA, Dumoulin CL. (2014) MRI in the neonatal ICU: initial experience using a small-footprint 1.5-T system. AJR Am J Roentgenol. 202(1):W95-W105.
7. Tustison NJ, Avants BB, Cook PA, Zheng Y, Egan A, Yushkevich PA, Gee JC. (2010) N4ITK: improved N3 bias correction. IEEE Trans Med Imaging. 29(6):1310-1320.
8. Gold GE, Han E, Stainsby J, Wright G, Brittain J, Beaulieu C. (2004) Musculoskeletal MRI at 3.0T: relaxation times and image contrast. Am J Roentgenol 183:343–351. doi: 10.2214/ajr.183.2.1830343
Figures