2455
Comparative study of 3D inversion recovery centric ordered fast field echo in lung dynamic oxygen enhanced MRI at 1.5 T and 3 T1Bioxydyn Ltd, Manchester, United Kingdom, 2Centre for Imaging Sciences, University of Manchester, Manchester, United Kingdom
Synopsis
Dynamic oxygen–enhanced MRI (dOE-MRI) techniques have previously been apply to study the rate and level of O2 enhancement in the lung. Lung MRI investigations are mostly conducted at 1.5T, because signal loss due to stronger susceptibility artefacts in lung tissue is expected at higher field strength. In this work, we demonstrate the feasibility of dOE-MRI at 3T on healthy volunteers. The observed signal enhancement is comparable between 1.5T and 3T, but translates in a lower relative T1 change due to higher baseline T1 at 3T. Fitting performance of O2 wash-in curve may be reduced by the lower SNR at 3T.
Introduction
Technical feasibility and clinical utility of dynamic oxygen–enhanced MRI (dOE-MRI) techniques have previously been demonstrated [1,2]. Most lung MRI investigations are conducted on 1.5T systems, as it provides an acceptable trade-off between sensitivity to changes in T1 and reduced signal loss due to susceptibility artefacts in lung tissue. In this work, we investigated the feasibility of dOE-MRI at 3T on healthy volunteers and compared the outcomes with dOE-MRI acquired at 1.5T.Methods
8 healthy volunteers (mean age 33.5 years, range 20-50 years) were scanned once on a 1.5T system (Philips Achieva) and on a 3T system (Philips Achieva) on different dates. One volunteer was excluded from the analysis due to abnormal findings in the lung.
The following free-breathing protocol based on a 3D-MPRAGE sequence was used in both scanners: TR/TE = 2.1/0.5 ms, Flip Angle= 6°, matrix = 128x128x15 acquired in a single readout, FOV= 450x450x225mm, time resolution = 10s/volume [3]. We estimated baseline T1 using the same sequence with different TIs (3.9 at 1.5T / 9.3 at 3T, 50, 300, 1100, 2000, 5000 ms). Baseline T1 maps were acquired with 5 acquisitions per TI. This was followed by an approximately 15 min lung dynamic acquisition (90 volumes) with TI=1100 ms [3], during which gas was switched from medical air (21% O2) to 100% O2, and back to air. All images were registered to correct for breathing motion using a non-linear registration algorithm based on ANTS [4]. Relative signal enhancement due to 100% O2 (O2En) was calculated as the difference between last 10 dynamics on 100% O2 and the first 10 dynamics on air, normalized by the latter. Relative change in T1 (ΔT1) was calculated as the difference between baseline T1 and dynamic T1, derived from the inversion-recovery experiment signal equation. Maps of the oxygen wash-in time (τup ) were derived by fitting the signal intensity curves from each pixel to a mono-exponential recovery function [2]. Resulting fitting failures in the lungs were counted for each acquisition. Lung tissue was manually segmented using ITK-SNAP [5], excluding main vessels. Median and interquartile range were calculated over the maps for all the calculated parameters. The inverse of the coefficient of variation (1/CoV) was estimated from the images at different TIs as the mean value of the lung signal over its standard deviation. Differences between data acquired at 1.5T and 3T were assessed using a 2-tails paired t-test. P-values< 0.05 were considered significant.
Results
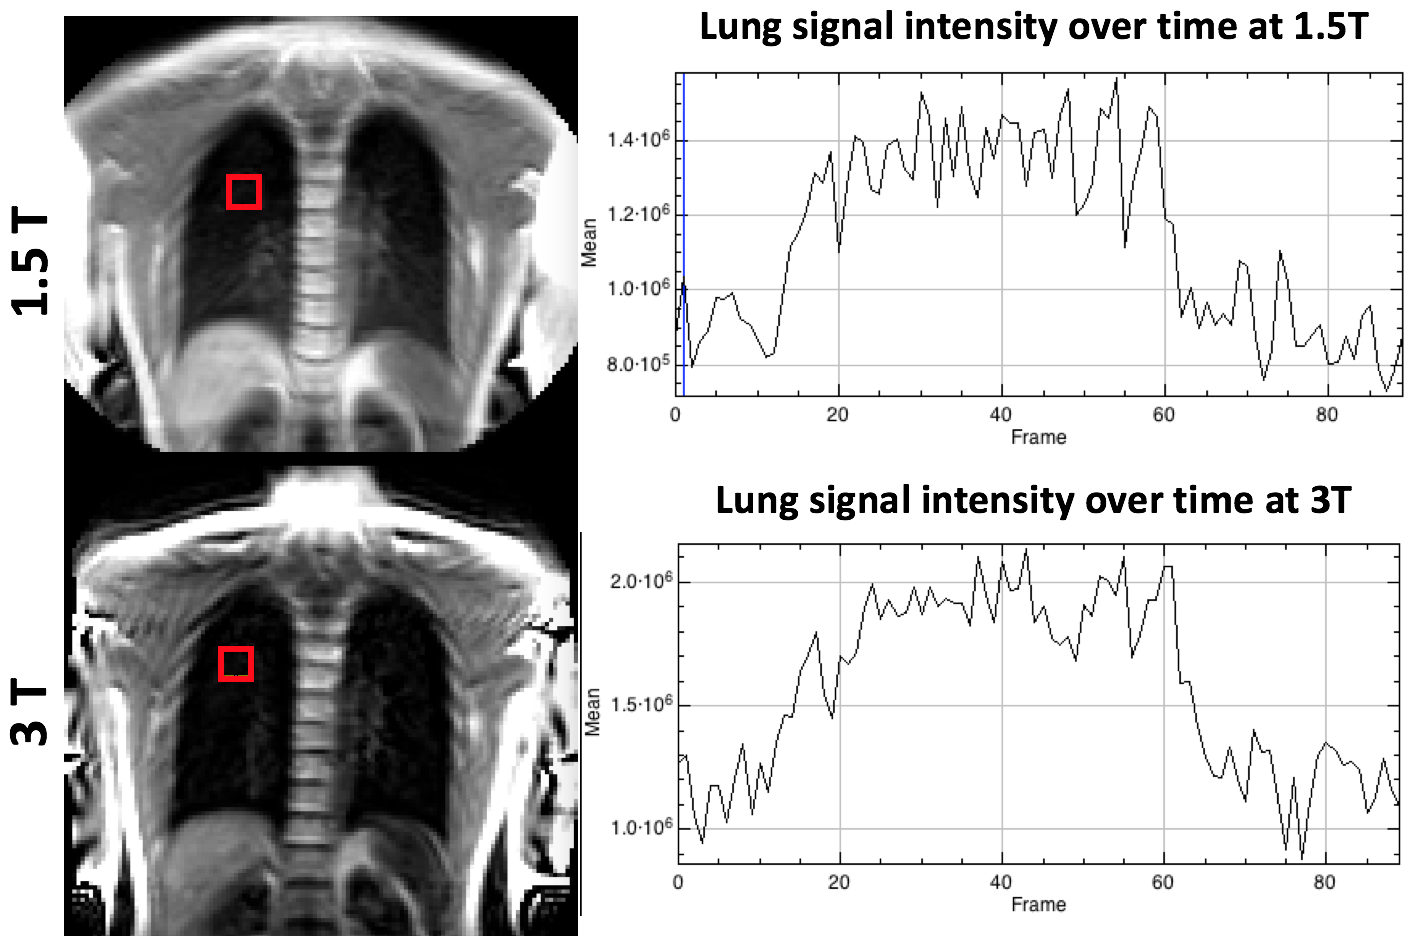
Figure 1 shows an example of the image quality and lung parenchyma signal variation over time from both system (same subject). Clear signal enhancement in the lung parenchyma can be appreciated in both cases.
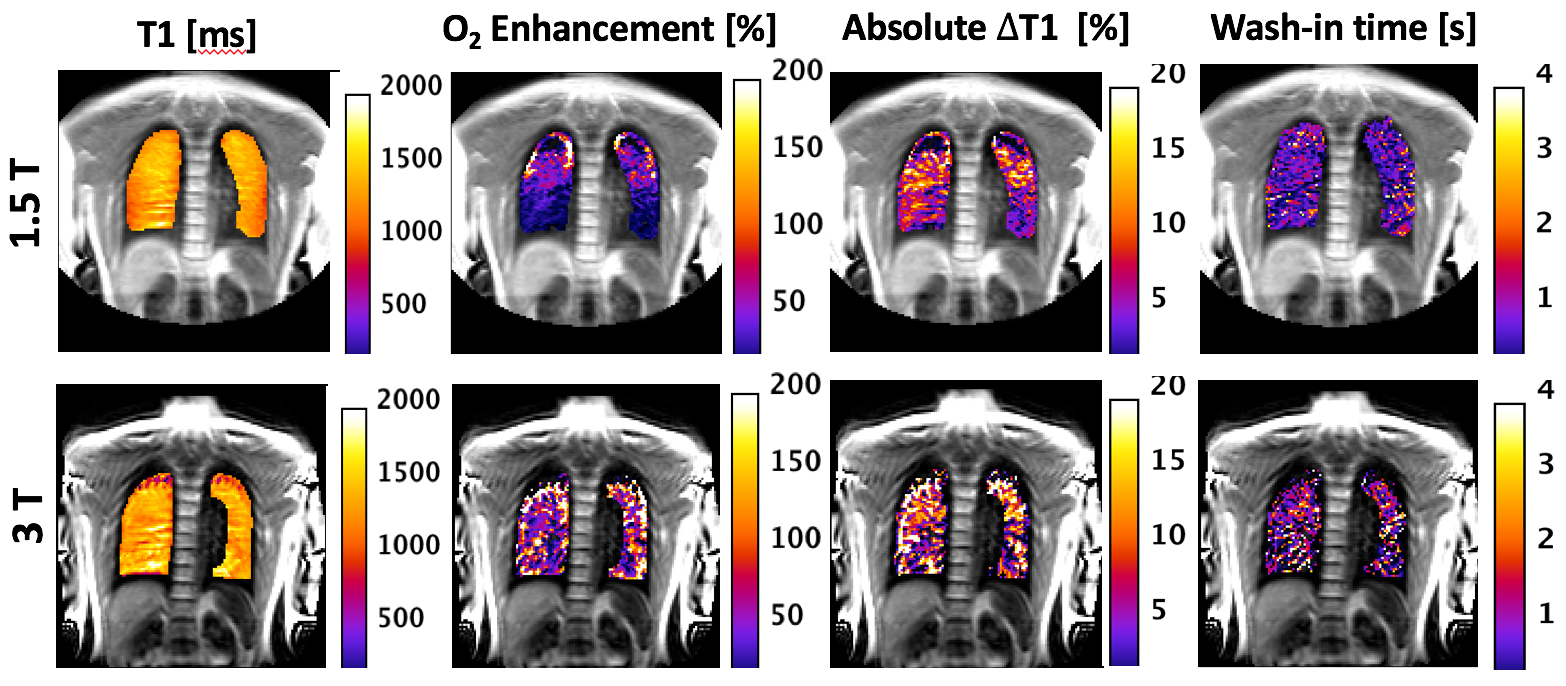
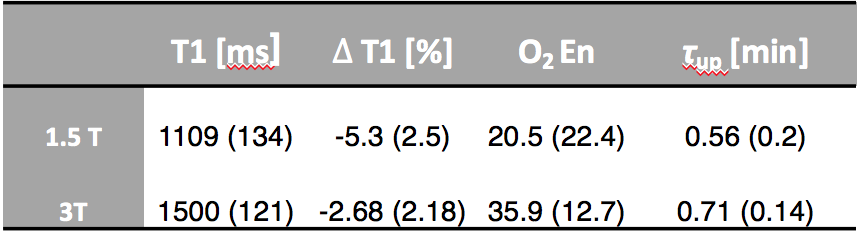
Figure 2 shows the comparison between baseline T1, O2En, ΔT1, and τup maps in the same subject. Median and interquartile range for all parameters are presented in Figure 3. T1 values are significantly higher at 3T than at 1.5T (p=0.003). There is no significant difference between O2En at the two field strengths, but ∆T1 is significantly higher at 1.5T than at 3T (p=0.02). τup is slightly but significantly higher at 3T than at 1.5T (p=0.03). At 1.5T, the fitting failures were 20% of the lung mask, and 42% at 3T.
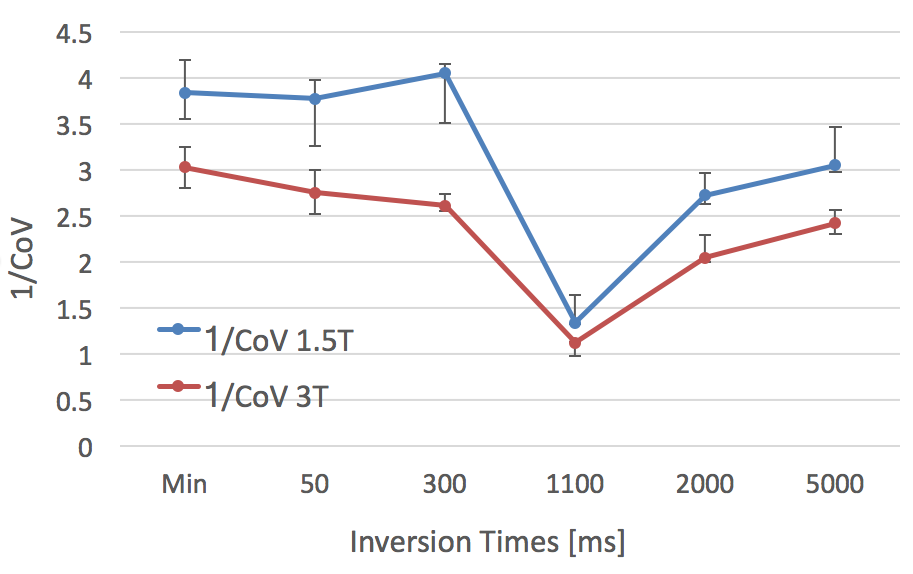
1/CoV values at 1.5T are significantly lower than at 3T for all TIs (figure 4).
Comments
The higher measured T1 values at 3T are expected, but the T1 values at 3T are higher than previously reported [6]. It must be noted that the acquisition parameters used for both field strengths, particularly TI and flip angle, were optimised considering the baseline T1 at 1.5T [3]. Despite this, the signal enhancement due to O2 is comparable at both field strengths. Since the baseline T1 values are higher at 3T, a relative lower increase in T1 is found at this field strength.
The difference in τup may be related to an increase in fitting failures at 3T, which may be caused by the lower SNR due to shorter T2* values, as suggested by the 1/CoV results. The difference in τup is around 10s within an 8 min 100% O2 breathing window, which can be considered negligible on assessing ventilation defects.
Conclusion
Feasibility of dOE-MRI at 3T in healthy volunteers has been demonstrated. The higher baseline T1 at 3T leads to a decrease in relative T1 changes during 100% O2 breathing with respect to experiments conducted at 1.5 T, but the signal enhancement is comparable.
Fitting performance of O2 wash-in curve may be reduced by the lower SNR at 3T, associated with an increase in susceptibility artefact at this field strength, compared to 1.5T.
Acknowledgements
We thank the study volunteers and the radiographer staff at the University of Manchester Imaging Facilities and the Manchester NIHR Clinical Research Facility for their contribution to this study.References
[1] Edelman, et al. Nat Med 2:1236–1239; 1996
[2] Arnold et al. MAGMA 16(5): 246-253; 2004
[3] Ulloa et al. ISMRM p3973; 2015
[4] Avants BB Neuroimage. 2011 Feb 1;54(3):2033-44
[5] Yushkevich, Neuroimage. 2006 Jul 1; 31(3):1116-28
[6] Togao Journal of Magnetic Resonance Imaging 34.3 (2011): 539-546.
Figures