2454
Extraction of fractional ventilation from dynamic oxygen enhanced MRI experiments: preliminary results1Bioxydyn Ltd, Manchester, United Kingdom, 2Centre for Imaging Sciences, University of Manchester, Manchester, United Kingdom
Synopsis
Fractional ventilation (FV) weighted maps were extracted from free-breathing dynamic O2 enhanced (dynOE) experiment in cystic fibrosis patients. FV is related to the local expansion of the tissue due to gas arrival in inspiration, while dynOE maps the local rate of the arrival of O2 and the maximum enhancement obtained. These parameters can be extracted from the same acquisition, providing complementary information regarding local lung function.
Introduction
Dynamic OE-MRI (dynOE-MRI) characterises the arrival of O2 in the
lung tissue by monitoring changes in T1 caused by changes in concentration of
breathing O2 [1]. The rate and level of signal enhancement of the
time varying signal are related to the local lung function [2,3]. During the
breathing cycle, the lung tissue density changes, altering the local proton
density, which also affects the MRI signal. In this work, we hypothesise these
changes can be measured from the images obtained in a dOE-MRI experiment and
maps of Fractional Ventilation (FV) [4] can be derived and compared with O2
wash-in rate and enhancement in a group of patients.Methods
6 adolescents with cystic fibrosis were scanned using a 1.5T Siemens Aera with a combined spine and cardiac array as receive coil. Subjects were fitted with a non-rebreathing mask. An inversion-prepared single-shot half-echo fast spin echo (HASTE) readout sequence with centre-out phase reordering was run for approximately 15 min. The gas delivered was switched from air to 100% O2 at 2 min, and back to air at 10 min. All acquisitions were executed in free breathing. Main scan parameters were: Time between inversion pulses: 6 s, Inversion Time: 1100 ms, Echo time: 2.3 ms, FOV 45x45 cm, slice thickness 10 mm, number of coronal slices: 6, number of dynamics: 140.
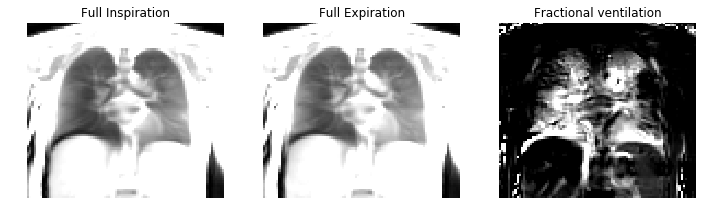
The position of the diaphragm over time was automatically extracted from each slice, and a respiratory signal was derived. All images were registered using a non-linear registration algorithm based on ANTs [5] to eliminate respiratory motion. The images corresponding the lowest 30% of the respiratory signal were summed after registration to provide a full-inspiration image. Similarly, a full-expiration image was obtained from the highest 30% of the respiratory signal. The full-inspiration image was further registered to the full-expiration image. FV maps were then calculated as the difference between full-inspiration and full-expiration, normalised to full-expiration. To assess the impact of the O2 related signal changes, FV maps were derived from the whole time series (FVwhole) and from the section where the subject breathed air (FVair).
O2 wash-in time (τup) were derived from the signal intensity curves for each pixel by fitting with a mono-exponential recovery function. The maximum signal enhancement (OE) due to breathing O2 was calculated as the difference between signal while breathing air and the signal when breathing 100% O2, normalised to the air-breathing signal.
Lung tissue was manually segmented from the images using ITK-SNAP [6] and median and interquartile ranges were calculated over the lung mask.
Results
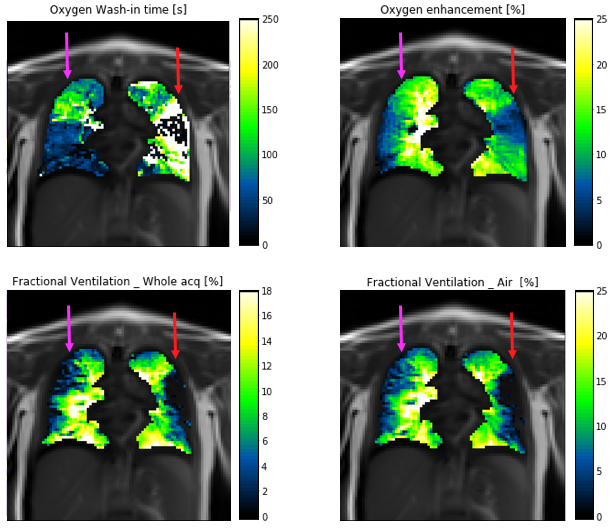
An example of the obtained full-inspiration and full-expiration images and the corresponding FV map is presented in figure 1. A qualitative comparison of τup, OE, FVwhole and FVair from the same subject is presented in figure 2. The results suggest mucus plugging is present in the left upper lobe (red arrow). In this area, low enhancement relates to a long τup. Correspondingly, a decrease in FV is observed in the same area. Similarly, in the right lung, an area of mucus plugging presents a long τup, normal OE and a decrease in FVwhole (magenta arrow).
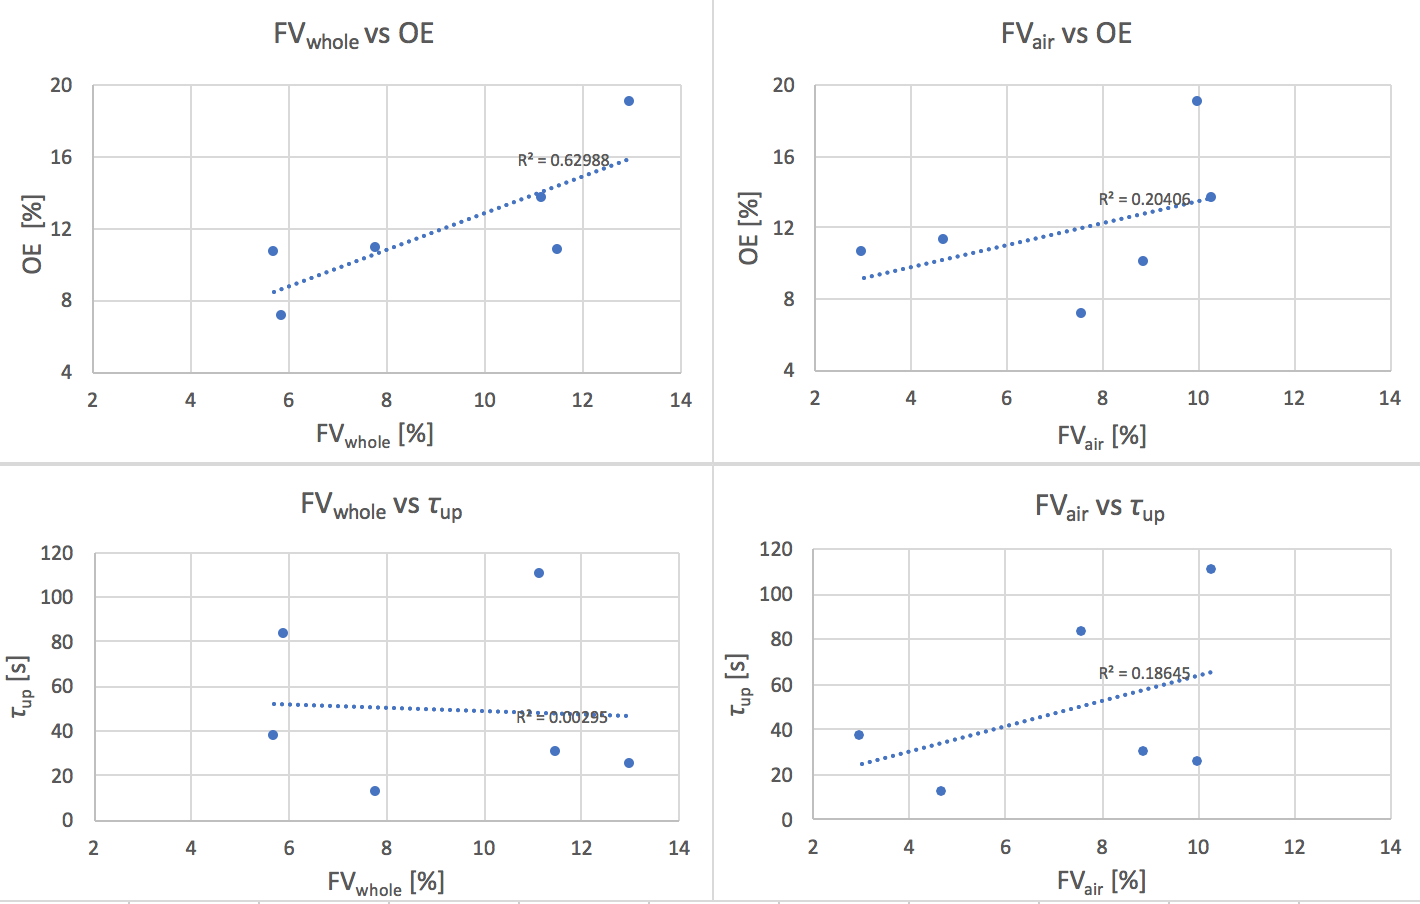
Figure 3 compares the whole-lung median values obtained for FVwhole, FVair, τup and OE. A good correlation (R2 = 0.6) is present between FVwhole and OE, and a lower correlation between FVair and OE. Neither FVwhole nor FVair correlate strongly with τup. Voxel medians and interquartile ranges over the dataset are: FVwhole =9.49% (5.04), FVair= 8.25% (4.3), OE=10.85% (2.27), τup= 33.5 (45.25) s. .
Discussion
Our results demonstrate the feasibility of extracting FV maps from dOE-MRI acquisitions, providing simultaneous complementary functional information.
We found that FV and OE correlate strongly. No correlation between FV and τup was observed, perhaps indicating different levels of sensitivity to ventilation defects or sensitivity to different aspects of pathological change. This may also be related to fitting failures in areas of low-to-none O2 uptake. Visual inspection of the parameter maps indicates substantial regions of difference as well as areas of concordance.
FV calculated over the whole time course (FVwhole) seems to perform better than FV limited to the air fraction (FVair), probably due to better SNR obtained from averaging over a larger number of dynamic images.
Conclusions
Fractional ventilation weighted maps can be extracted from a dOE-MRI experiment providing additional information regarding the local expansion of the tissue due to gas arrival in inspiration. Although there are similarities in the information derived from the two analyses, there are also substantial regional differences, suggesting complementary information content.Acknowledgements
No acknowledgement found.References
1 Edelman, et al. Nat Med 2:1236–1239; 1996
2 Ulloa, J. L., et al. (2014). American Journal of Respiratory and Critical Care Medicine 2014;189:A6692
3 Arnold et al. MAGMA 16(5): 246-253; 2004
4 Kjørstad, Å. Zeitschrift für Medizinische Physik, 27(3), 172-179
5 Avants BB Neuroimage. 2011 Feb 1;54(3):2033-44.
6 Yushkevich, Neuroimage. 2006 Jul 1; 31(3):1116-28.
Figures