2453
MRI Ventilation Texture Features Discriminate Severe Asthmatics with and without Eosinophilic Airway Inflammation1McMaster University, Hamilton, ON, Canada, 2Robarts Research Institute, Western University, London, ON, Canada, 3Firestone Institute for Respiratory Health, St Joseph’s Healthcare, Hamilton, ON, Canada
Synopsis
Previous work suggests that inhaled gas MRI conceals minable features that are distinctly different between severe asthma inflammatory endotypes and these may be used to predict inflammatory endotype. We evaluated the performance of inhaled gas MRI ventilation defect percent, ventilation coefficient of variation and texture features to discriminate severe asthmatics with and without the eosinophilic inflammatory endotype. MRI measurements of ventilation significantly discriminated asthmatics with eosinophilic inflammation from those without eosinophilic inflammation. Non-invasive MRI-based biomarkers and signatures of asthma inflammatory endotype may serve to guide treatment selection in individual asthmatics or evaluate the effectiveness of anti-inflammatory treatments in clinical trials.
Introduction
Pulmonary functional MRI is sensitive to airway inflammation1 and may provide a way to indirectly stratify asthmatics according to their underlying disease mechanisms or “endotype”. This is important because nearly 80% of severe asthmatics also have evidence of airway inflammation. Endotype-specific anti-inflammatory drug discovery and development is underway for such patients2 but currently available measurements are poor predictors of treatment response, necessitating the development of sensitive and precise biomarkers. Beyond inhaled gas MRI ventilation defect percent (VDP), pulmonary functional MRI provides a wide variety of minable image features and these may be considered for the prediction of asthma inflammatory endotypes and the measurement of treatment response. Therefore, our objective was to evaluate the performance of inhaled gas MRI VDP, ventilation coefficient of variation (VenCOV) and texture features3 to discriminate severe asthmatics with and without eosinophilic inflammation.Methods
We evaluated asthmatics with eosinophilic inflammation (sputum eosinophils ≥3%4) and without eosinophilic inflammation (sputum eosinophils <3%4) who provided written-informed-consent and underwent spirometry and hyperpolarized 3He MRI pre- and post-bronchodilator during a single visit. Eosinophilic inflammatory endotype was confirmed using quantitative cytometry of induced sputum.5 Anatomical 1H and hyperpolarized 3He MRI were acquired using a 3.0 Tesla Discovery MR750 system (General Electric Health Care, WI, USA), as previously described.6 Patients were instructed to inhale 1.0L of gas (100% N2 for 1H MRI and a 3He/N2 mixture for 3He MRI) from functional residual capacity, and coronal slices were acquired under breath-hold conditions. 3He MRI static ventilation segmentation was performed to generate VDP,6 VenCOV7 and second-order ventilation texture features long-run emphasis (LRE) and long-run and low gray-level emphasis (LRLGE) were also generated as previously described.3 Unpaired t-tests were used to compare measurements between asthmatics with and without eosinophilic inflammation. Receiver operating characteristic (ROC) analysis, from which the area under the curve (AUC) was calculated, was used to measure the performance of VDP, VenCOV, LRE and LRLGE as eosinophilic inflammatory endotype classifiers. Linear discriminant analysis8 was subsequently performed to build a composite signature comprised of all significant eosinophilic inflammatory endotype classifiers. The optimum cut-off point was determined according to the maximum Youden’s index value and the corresponding sensitivity, specificity, positive and negative likelihood ratios were calculated. All statistics were performed using GraphPad Prism version 7.00 (GraphPad, Inc., San Diego).Results
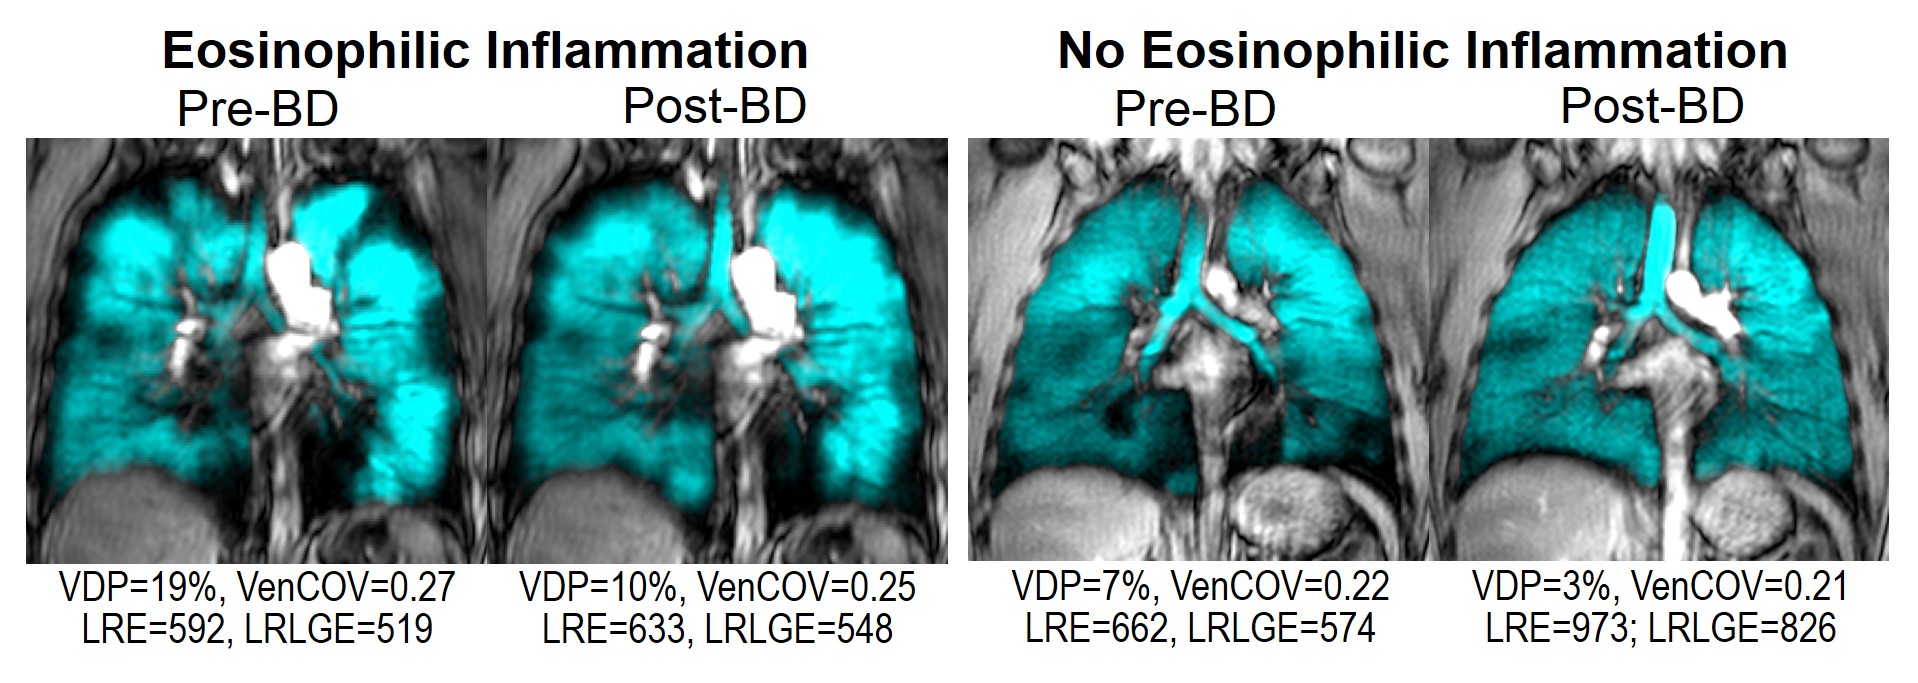
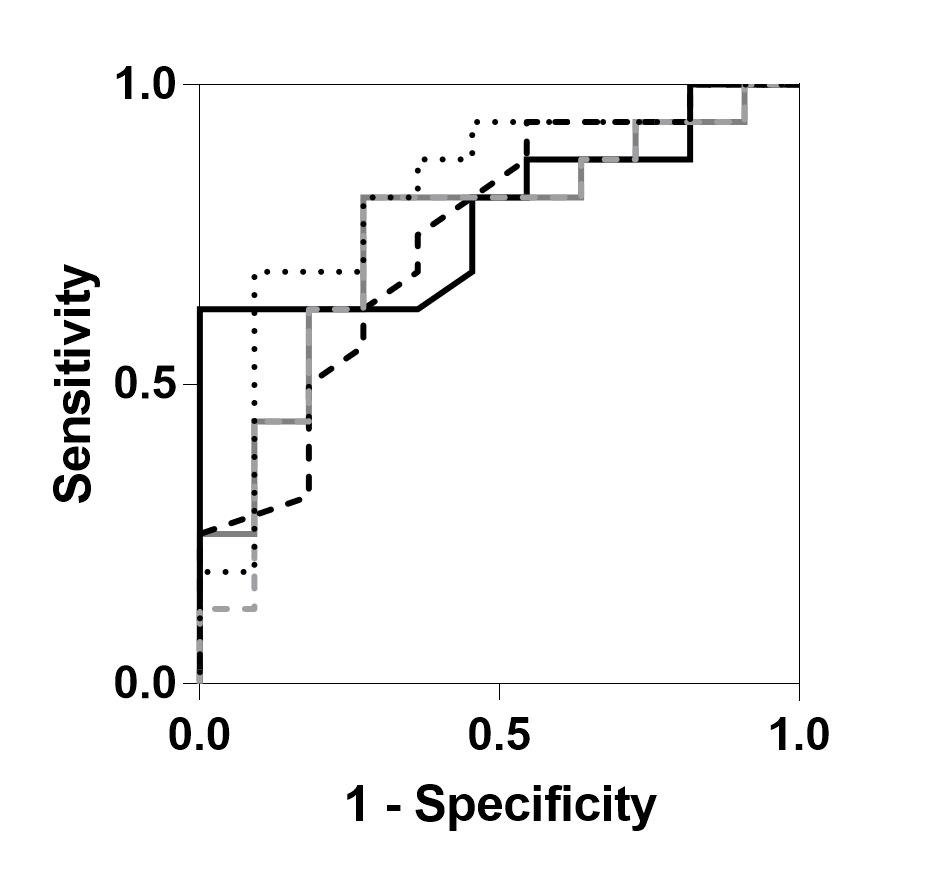
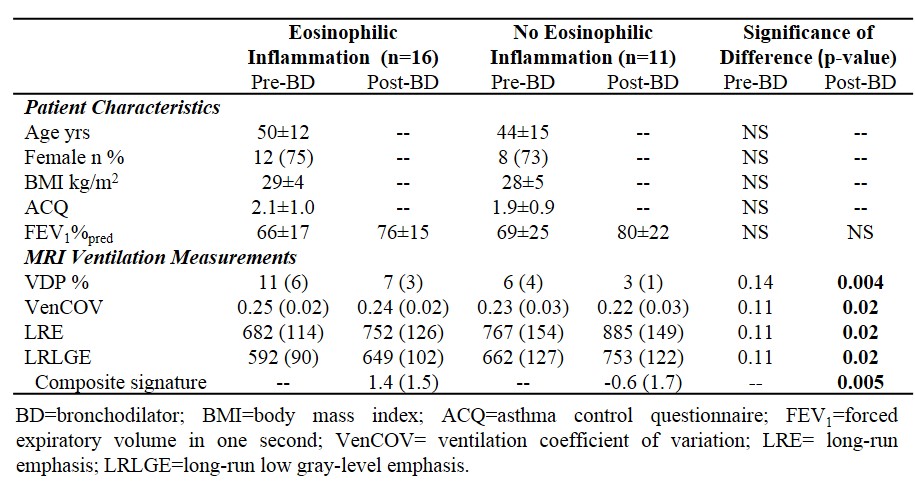
Patient characteristics and MRI measurements are provided in Table 1 for 16 asthmatics with eosinophilic inflammation (sputum eosinophils ≥3%) and 11 without eosinophilic inflammation (sputum eosinophils <3%). The two subgroups were not different with respect to age, body mass index, or asthma characteristics including asthma control and the forced expiratory volume in one second (FEV1). Figure 1 shows MRI ventilation images for a representative asthmatic with (sputum eosinophils=42%) and without eosinophilic inflammation (sputum eosinophils=2%). As shown in Table 1, the subgroups were significantly different with respect to post-bronchodilator VDP (p=0.004), VenCOV (p=0.02), LRE (p=0.02) and LRLGE (p=0.02). ROC curves for each of the potential MRI eosinophilic inflammatory endotype classifiers, including our derived composite signature, are shown in Figure 2. MRI VDP (AUC=0.78; p=0.01), VenCOV (AUC=0.74; p=0.03), LRE (AUC=0.76; p=0.03), LRLGE (AUC=0.74; p=0.03) and the derived composite signature (AUC=0.82; p=0.006) significantly discriminated asthmatics with eosinophilic inflammation from those without eosinophilic inflammation. For each classifier the established cut-off and the corresponding performance characteristics (sensitivity, specificity, positive and negative likelihood ratios) were: VDP: >5%, 0.63, 1, ∞, and 0.4; VenCOV: >0.22, 0.94, 0.45, 1.7, and 0.1; LRE: <836, 0.81, 0.73, 3.0, and 0.3; LRLGE: <717, 0.81, 0.73, 3.0, and 0.3; and composite signature: >1.3, 0.69, 0.91, 7.6, and 0.3.Discussion
MRI measurements of ventilation significantly discriminated asthmatics with eosinophilic inflammation from those without eosinophilic inflammation. We subsequently used these patients as a training dataset to derive an MRI-based signature of the eosinophilic inflammatory endotype consisting of VDP, VenCOV, LRE and LRLGE. Our signature was not validated on an independent dataset, therefore subsequent studies are required to confirm its performance.Conclusion
To our knowledge this is the first demonstration that higher order texture features of pulmonary functional MRI stratified asthmatics based on eosinophilic inflammation. These findings are relevant for clinical research and asthma clinical care because novel treatments that target specific disease mechanisms do not benefit all patients. Non-invasive MRI-based signatures of asthma inflammatory endotype may serve to guide treatment selection in individual asthmatics or evaluate the effectiveness of novel anti-inflammatory treatments. Additional studies are required to integrate and understand the importance of shape-based MRI ventilation features in asthma endotype classification. Studies will then be required to determine if MRI-based radiomic signatures can guide personalized treatment decisions in severe asthma.Acknowledgements
We thank M. Kjarsgaard and C. Huang for helping with the recruitment and assessment of patients, K. Radford and N. LaVigne for the sputum cytometry, D. Capaldi and H. Young for production and dispensing of 3He gas, and D. Reese for MRI of research volunteers.References
1. Svenningsen S, Eddy RL, Lim HF et al. Inflammatory and Non-Inflammatory Contributions to Ventilation Heterogeneity in Severe Poorly-Controlled Asthmatics. Am J Respir Crit Care Med. 2017; A2665.
2. Aleman F, Lim HF and Nair P. Eosinophilic Endotype of Asthma. Immunol Allergy Clin North Am. 2016;36:559-568.
3. Zha N, Pike D, Svenningsen S et al. Second-order Texture Measurements of 3He Ventilation MRI: Proof-of-concept Evaluation of Asthma Bronchodilator Response. Acad Radiol. 2016;23:176-185.
4. Nair P and Hargreave FE. Measuring bronchitis in airway diseases: clinical implementation and application: Airway hyperresponsiveness in asthma: its measurement and clinical significance. Chest. 2010;138:38-43.
5. Pizzichini E, Pizzichini MM, Efthimiadis A et al. Indices of airway inflammation in induced sputum: reproducibility and validity of cell and fluid-phase measurements. Am J Respir Crit Care Med. 1996; 154:308-317.
6. Kirby M, Heydarian M, Svenningsen S et al. Hyperpolarized 3He magnetic resonance functional imaging semiautomated segmentation. Acad Radiol. 2012;19:141-152.
7. Sheikh K, Paulin GA, Svenningsen S et al. Pulmonary ventilation defects in older never-smokers. J Appl Physiol. 2014;117:297-306.
8. Pudil P, Novovičová J and Kittler J. Floating search methods in feature selection. Pattern Recognition Letters. 1994;15:1119-1125.
Figures