2449
Diffusion Tensor Imaging for Differentiating Borderline From Malignant Epithelial Ovarian Tumors1The First Affiliated Hospital of Dalian Medical University, Dalian, China, 2GE Healthcare, Beijing, China
Synopsis
To assess the fitted parameters of DTI in ovarian tumors and to investigate their potential in distinguishing borderline from malignant epithelial ovarian tumors, which can provide detailed information for clinical treatment. DC avg, Exat, FA and VRA in DTI were valuable information in distinguishing borderline from malignant epithelial ovarian tumors and can be used as non-enhancement quantitative indexes, which has a good application prospect.
Purpose
A considerable overlap of clinical symptoms and imaging characteristics between borderline epithelial ovarian tumors (BEOT) and malignant epithelial ovarian tumors(MEOT) can make it difficult to get a definitive preoperative diagnosis. Accurate preoperative classification could be helpful to work out proper surgical plan, and thus improve the life quality of patients. We will discuss the value of diffusion tensor imaging (DTI) in differentiating BEOT from MEOT.Methods
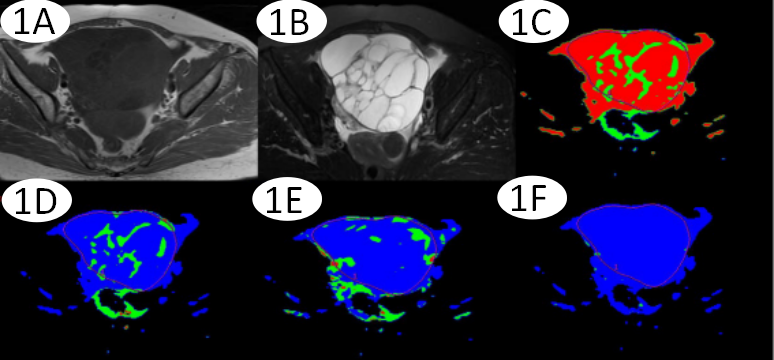
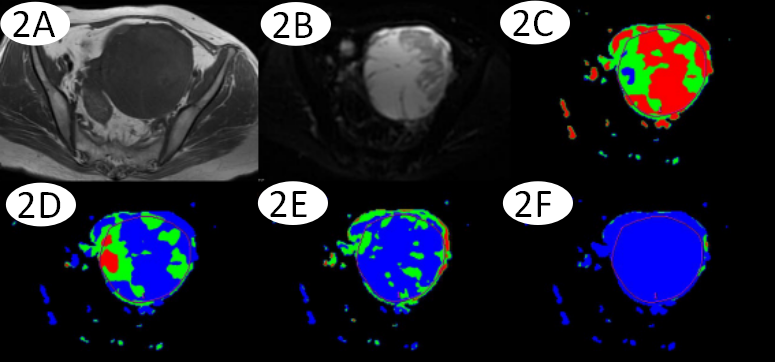
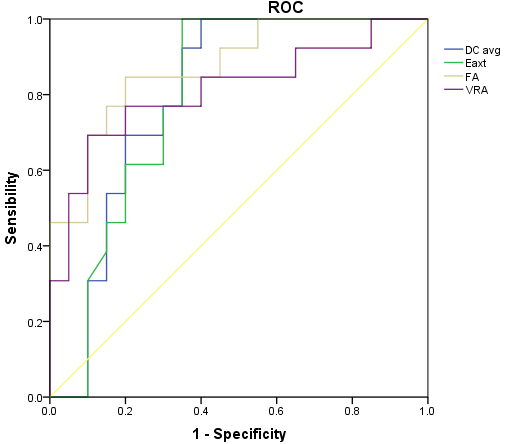
Thirty-three patients with epithelial ovarian tumors (13 BEOT; 20 MEOT) confirmed by histopathological examination were recruited in the study. All patients underwent MR exams on a 1.5T scanner (GE Signa HDXT) with routine scanning sequence and additional DTI sequence. The applied imaging parameters are as follows: fat suppression T2(FS T2): TR=4000 ms, TE=125 ms, FOV=40 cm×40 cm, NEX=4.0, slice-thickness=4.0 mm, slice-gap=1 mm; T1WI:TR=500 ms, TE=10 ms, FOV=40 cm×40 cm, NEX=4.0, slice-thickness=4.0 mm, slice-gap=1 mm; LAVA: TR=3.9 ms, TE=1.9 ms, FOV=40 cm×40 cm, NEX=0.71, slice-thickness=5.0 mm, slice-gap=2.5 mm; DTI: TR=4000 ms, TE=58 ms, flip angle: 12, b value=0、600, FOV=40 cm×40 cm, NEX =2.0, slice-thickness=4.0 mm, slice-gap=1mm, acquisition matrix=192×128. The MR images were blindly reviewed and analyzed by two independent observers. According to the FS T2 weighted imaging, region of interests(ROIs) were drawn along with the boundaries of tumors (Figure 1 and 2). DC avg, Exat, FA and VRA values were measured by the FuncTool on GE SDC-ADW 4.4 workstation. The SPSS 22.0 statistical software was used for the data analyses, where P value less than 0.5 was considered as statistically significant. The consistency of results measured by two observers was tested by intraclass correlation coefficients (ICC). DC avg, Exat, FA and VRA values and were compared between two groups using Mann-Whitney test. The receiver operating characteristic(ROC) curve was used to evaluate the diagnostic efficiency(Figure 3).Results
ICC were all more than 0.9. The mean DC avg value of BEOT was statistically higher than that of MEOT ([2.713±0.570]×10-9 mm2/s vs. [1.817±1.176]×10-9 mm2/s; P=0.004), but the mean Eaxt, FA and VRA values of BEOT were statistically lower than those of MEOT ([0.215±0.074] vs. [0.364±0.246]; P=0.004), ([0.101±0.043] vs. [0.148±0.047]; P=0.0001) and ([0.015±0.014] vs. [0.031±0.0167]; P=0.002). The area under the ROC curve of DC avg was 0.796 (95% confidence interval, CI:0.641-0.952); The area under the ROC curve of Exat was 0.79 (95% confidence interval, CI:0.633-0.948); The area under the ROC curve of FA was 0.873 (95% confidence interval, CI:0.752-0.995); The area under the ROC curve of VRA was 0.812 (95% confidence interval, CI:0.648-0.975). The diagnosis of cut-off point between BEOT and MEOT for DC avg, Eaxt, FA and VRA was 1.845×10⁻⁹(mm2/s), 0.130, 0.019 and 0.333, respectively, the sensitivity and specificity for DC avg, Eaxt, FA and VRA in differentiating BEOT and MEOT were 100%, 60%; 100%, 65%; 84.6%, 80%; 69.2%, 90%.Discussion
DC avg values can reflect the free diffusion of water molecules per unit time, and Exat values also reflect the diffusion of water molecules, but the direction is opposite of DC avg. MEOT are characterized by higher malignancy than BEOT. Much higher cell density is generated in MEOT, and extracellular space decreases. Result in the diffusion movement of water molecules internal and external of cells is limited and the movement speed was reduced[1,2]. It may be the reason why DC avg values decrease, while Exat values increase. FA and VRA values are between 0 and l, when the values near to 0 that represent to isotropic; instead, represent to anisotropy[3]. MEOT is more aggressive than BEOT, and tumor cells are arranged more compactly, result in water molecules move in the same direction[4,5]. It may be the reason why FA and VRA values increase.Conclusion
MR DTI is an effective method in differentiating BEOT from MEOT. DC avg values have great diagnostic sensitivity in differentiating between BEOT and MEOT; VRA values have great diagnostic specificity, and FA values have great diagnostic potentials from both specificity and specificity perspectives.Acknowledgements
No acknowledgement found.References
[1]Liang Zhipeng, Yao Lizheng, Dai Zhenyu and et al.Diffusion tensor imaging in differential diagnosis of hyper-acute and acute ischemic cerebral infarc[J].China JMIT,2016,32(2):195-199.
[2]Qin Xindong, Han Jingjuan, Ji Zhiying. Dynamic observation of the parameters of diffusion tensor imaging in the development of phases of cerebral infarction[J]. Chinese Imaging Journal of Integrated Traditional and Western Medicine, 2014,12(1):21-24.
[3]Mori S, Zhang J. Principles of diffusion tensor imaging and its applications to basic neuroscience research[J]. Neuron, 2006, 51(5):527-539.
[4]LI Yonggang, WANG Renfa, GAO Xiaoling and et al .Diffusion Tensor Imaging of Muscle Fiber Tractsin the Diagnosis of Musculoskeletal Tumors[J]. Journal of Clinical Radiology, 2008,27(4):481-485.
[5]Jun-wu, XIAO Xuxuan, LI Yonggang and et al. The preliminary application and assessment of MR diffusion tensor imaging technique and metrics[J]. Chinese Journal of Radiology, 2004, 38(12):1256-1259.
Figures