2448
Non-rigid motion correction for arterial spin labeled (ASL) perfusion imaging of the placenta using ANTs1Dept. of Neurology, University of Pennsylvania, Philadelphia, PA, United States, 2Dept. of Radiology, University of Pennsylvania, Philadelphia, PA, United States, 3Dept. of Obstetrics and Gynecology, University of Pennsylvania, Philadelphia, PA, United States
Synopsis
PURPOSE
Arterial spin labeled (ASL) perfusion MRI can reliably quantify regional blood flow [1], and thus can be utilized to measure placental perfusion, which may provide new insights into the mechanisms and diagnosis complications in pregnancies. However, the reliability of placental ASL can be compromised by non-rigid placental motion due to maternal breathing and fetal movement [2] producing artifactual label/control differences. In this study, we present some preliminary results on non-rigid motion correction of placental ASL using Advanced Normalization Tools (ANTs) [3].METHODS
5 healthy singleton pregnancies (GA range = 17 weeks - 27 weeks) were scanned for placental perfusion at a 1.5 T Siemens Avanto scanner (Healthineers, Erlangen, Germany). ASL imaging was acquired using the pulsed arterial spin labeling (PASL) sequence with a 2D echo planar image readout and the following parameters: flip angle = 90°, voxel size = 4x4x10 mm with 12.5 mm slice gap, TR = 4000 ms, TI = 2000 ms and TE = 13 ms. 20 pairs of control-label images were collected for each scan. 6 additional volumes of M0 images were acquired at the same location with longer TR = 6000 ms and shorter TE = 12 ms for calibration.
Non-rigid motion in the placental ASL images was corrected using the deformable registration of ANTs [3]. Because motion correction routines can erroneously interpret the systematic intensity difference between control and label images as systematic displacement of placenta position [4], the motion correction was conducted for control and label images separately with the following steps:
- Deformably register the 6 volumes of M0 images and create a template M0 image
- Deformably register all ASL volumes to the template M0 image
- Create mean reference images in the M0 template space for control and label images separately
- Deformably register each control/label image to corresponding mean reference image
Due to the large inter-slice gap of the scans, the deformation across the slices was weighted to be much smaller than the in-plane deformation for these registration steps.
To evaluate the quality of motion correction, we calculated several metrics related to motion-induced errors in ASL images, comparing before and after motion correction:
- Percentage of negative ΔM (control - label) voxels in the placental ROI: Motion and other sources of noise can induce negative perfusion values for some voxels; we propose that effective motion correction will reduce the percentage of negative ΔM voxels. The placental ROI was hand drawn based on each subject’s M0 template image.
- Residual sum of square of the control-label regression in the placental ROI: The residual power after label-control regression is expected to be increased by factors other than the control-label manipulation; we propose that effective motion correction will reduce the residual power.
- Temporal signal-to-noise ratio (tSNR) in the placenta ROI: We propose that effective motion correction should reduce the noise induced by motion, and thus increase the tSNR of ASL time series.
- Relative respiratory power: Maternal breathing is one of the major sources of motion artifact; we propose that effective motion correction will reduce signal power at the respiratory frequency. We compute this power by considering the (likely aliased) respiratory frequency to be the frequency bin (besides the DC bin and the control-label frequency bin) with the highest power in the averaged power spectrum of the ASL time series across all the voxels.
RESULTS
ANTs motion correction successfully reduced the number of negative ΔM voxel in the placental ROI (Fig. 1) for all 5 subjects. ANTs motion correction reduced the residual power for all the subjects, as illustrated by violin plots (Fig. 2). ANTs Motion correction increased the tSNR of the ASL time series for the voxels in the placental ROI (Fig. 3). The relative power at the respiratory frequency was reduced after motion correction (Fig. 4). Fig.5 shows the perfusion images of an example subject. Compared to the perfusion in the placental region before motion correction (Fig.5 row 2), the motion corrected image (Fig.5 row 3) presented stronger positive perfusion and less negative voxels in the placental region.DISCUSSION AND CONCLUSION
These results suggest that the non-rigid motion correction of placental ASL imaging using ANTs successfully reduced the amount of noise induced by maternal respiration and other motions, and therefore improved perfusion image quality.Acknowledgements
This study was supported by P41 RR002305, U01 HD087180 and NICHD 4R00HD074649.References
1. Detre, J.A., et al., Perfusion imaging. Magnetic resonance in medicine, 1992. 23(1): p. 37-45.
2. Malamateniou, C., et al., Motion-compensation techniques in neonatal and fetal MR imaging. AJNR. American journal of neuroradiology, 2013. 34(6): p. 1124-36.
3. Avants, B.B., et al., A reproducible evaluation of ANTs similarity metric performance in brain image registration. NeuroImage, 2011. 54(3): p. 2033-44.
4. Wang, Z., et al., Empirical optimization of ASL data analysis using an ASL data processing toolbox: ASLtbx. Magnetic resonance imaging, 2008. 26(2): p. 261-9.
Figures
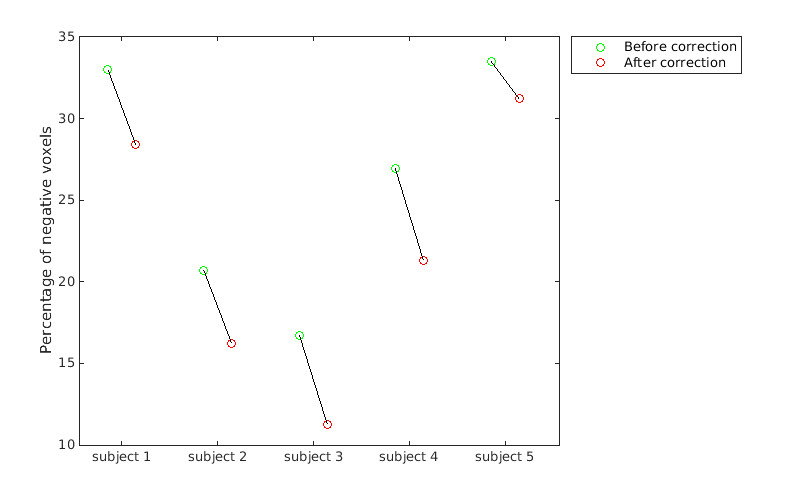
Fig. 1 Percentage of negative ΔM voxels in the placental ROI
The percentages of voxels in the placental ROI that showed negative ΔM before and after motion correction are plotted using green and red circles, respectively.
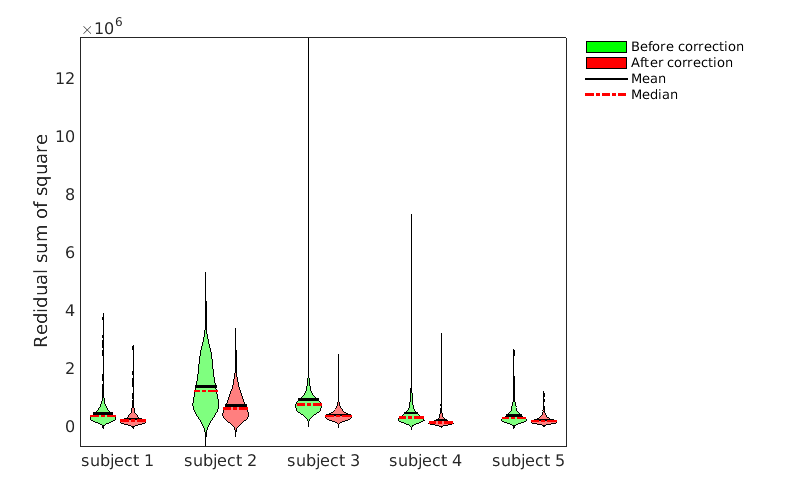
Fig. 2 Residual sum of square of the voxels in the placental ROI
Violin plots showing the residual sum of square (RSS) of the regression with control-label pattern over all voxels in the placental ROI. Green and red plots are the RSS of the subjects before and after correction, respectively.
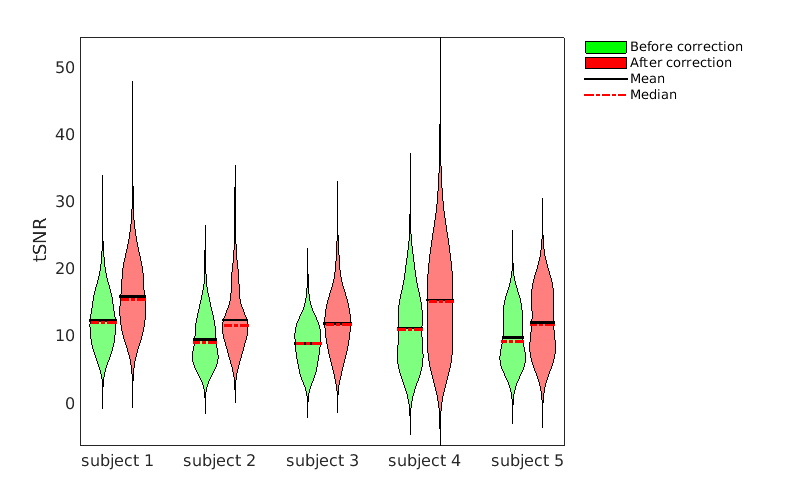
Fig. 3 Temporal signal to noise ratio in the placental ROI
Violin plots showing the temporal signal to noise ratio (tSNR) of the voxels in the placental ROI. Green and red plots are the tSNR of the subjects before and after correction, respectively.
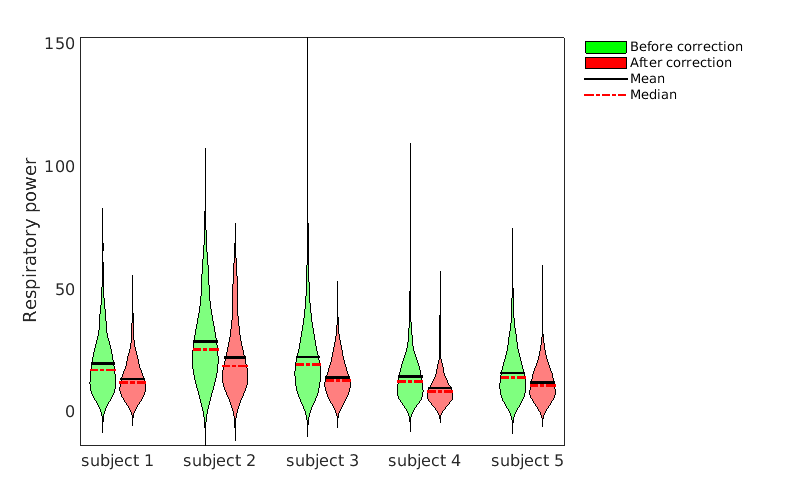
Fig. 4 Relative respiratory power in the placental ROI
Violin plots showing the relative respiratory power (the power of assumed respiratory frequency normalized by the power of DC term) for the voxels in the placental ROI. Green and red plots are the relative respiratory power of the subjects before and after correction, respectively.
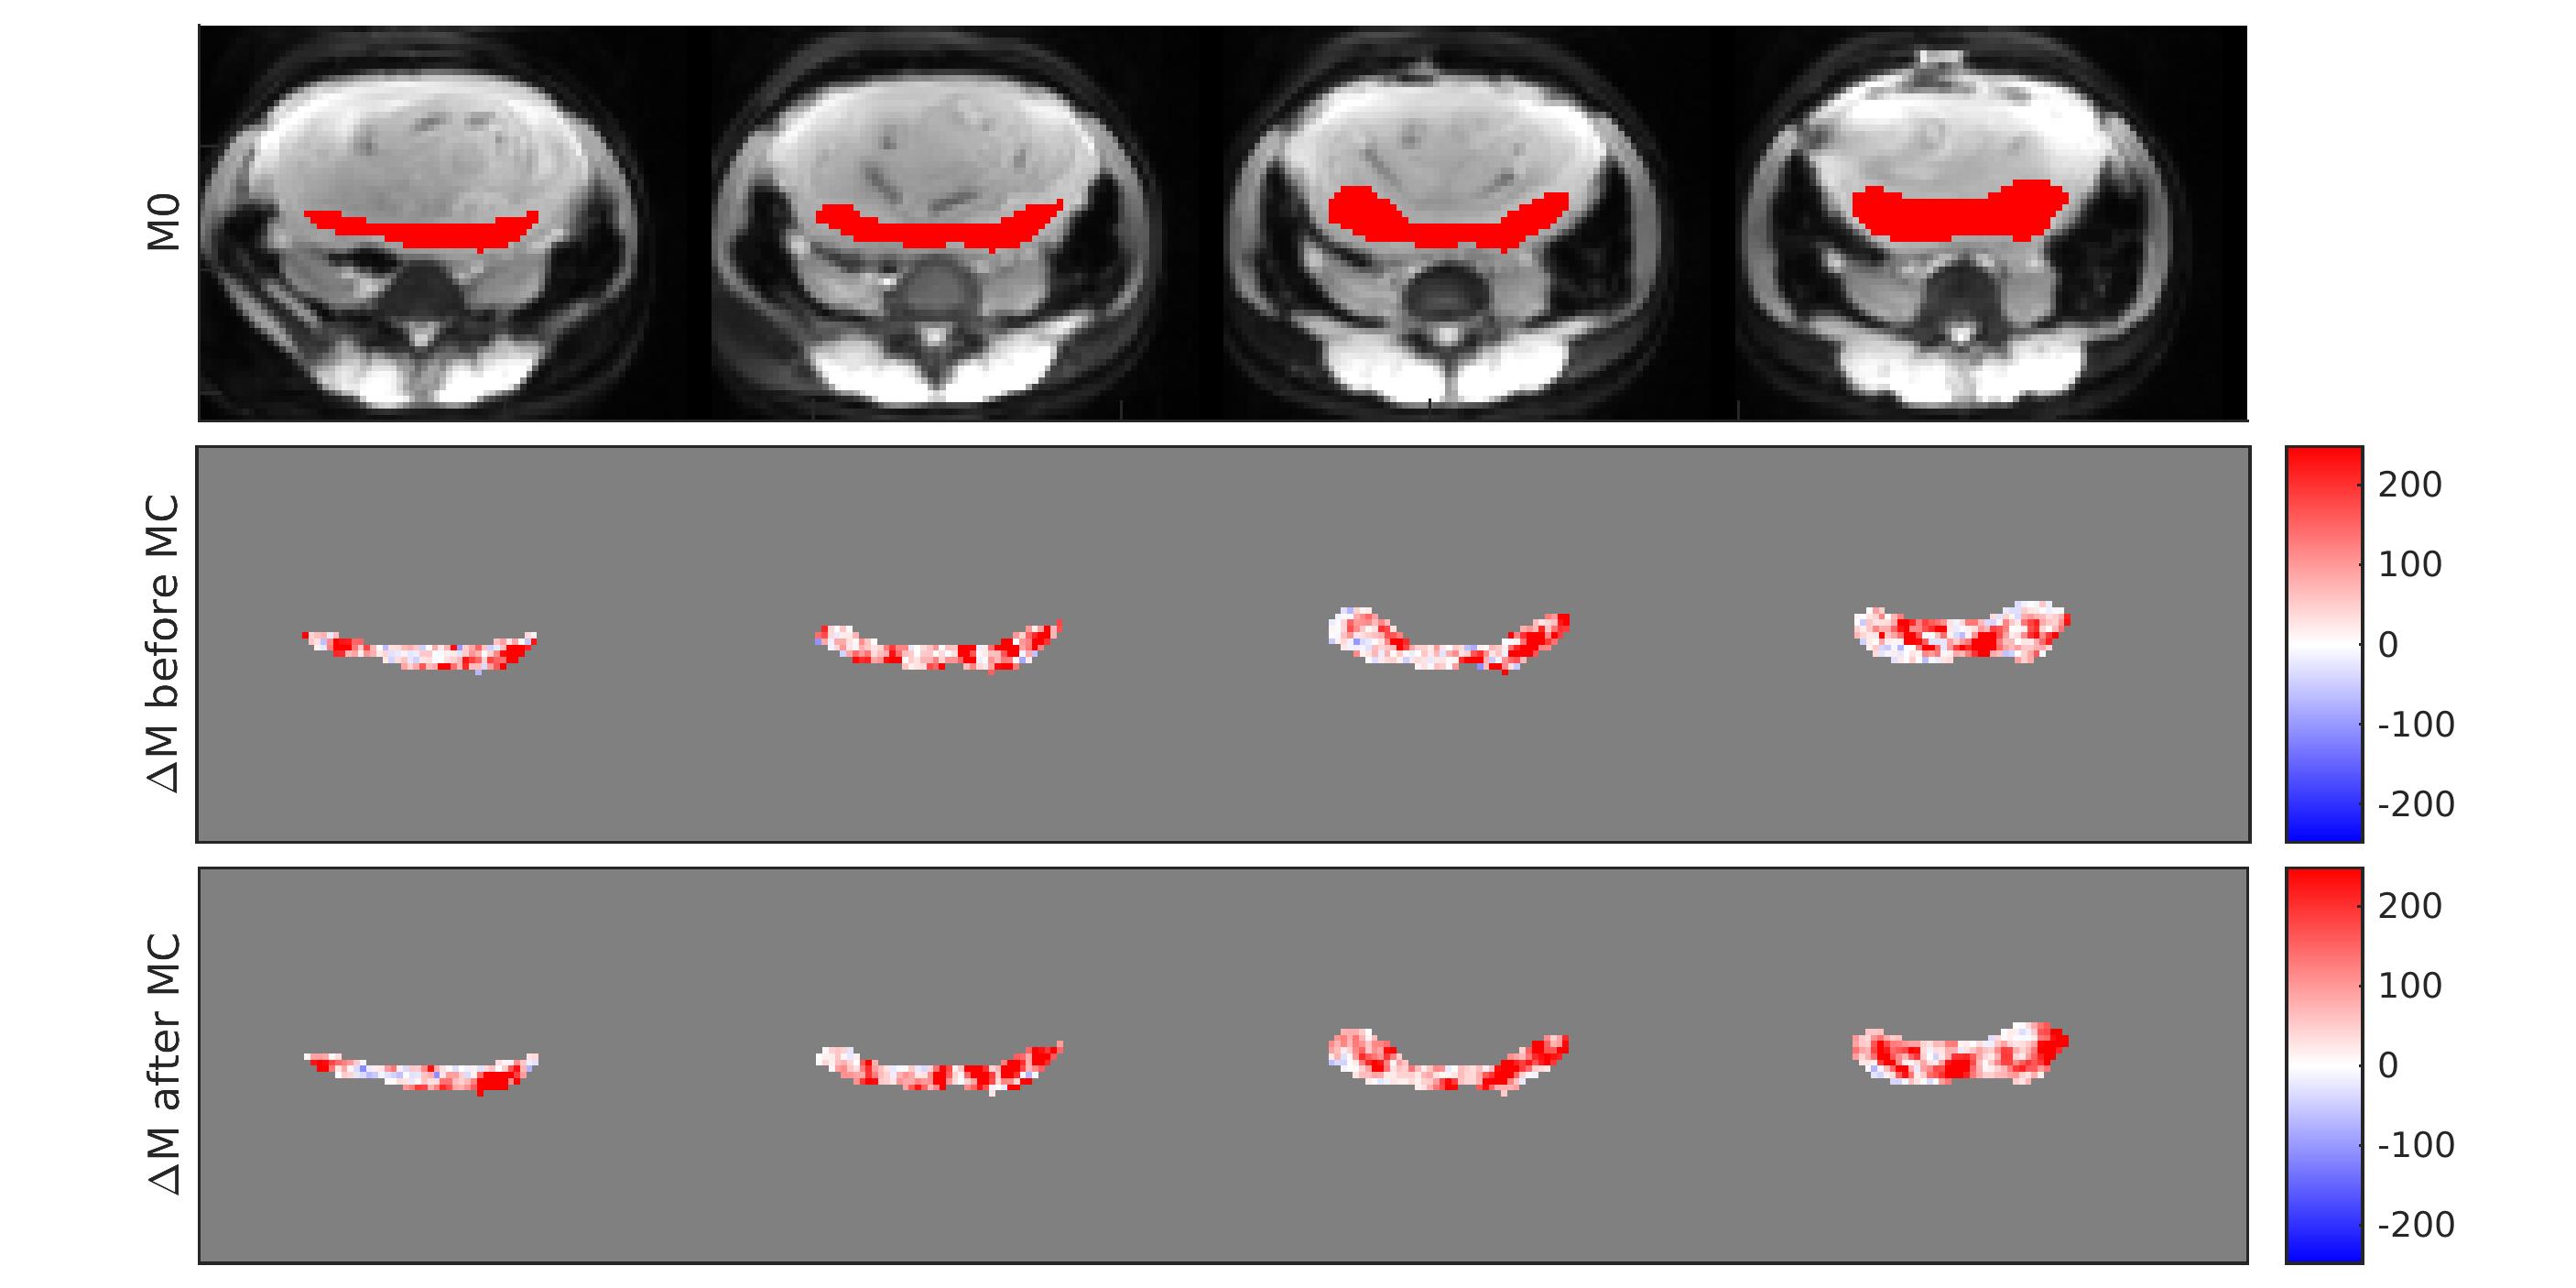
Fig. 5 Perfusion map of an example subject
The first row is the M0 image of the example subject, with red color indicating the placental region. The second and third rows are presenting the mean ΔM in the placental region before and after the non-rigid motion correction (MC). The motion corrected image showed stronger positive perfusion and fewer negative voxels in the placental region than the un-corrected image.