2445
High Resolution Rapid Neonatal Whole Body Composition Using 3.0 Tesla Chemical Shift Magnetic Resonance Imaging1Radiology, Weill Cornell Medicine, New York, NY, United States, 2Pediatrics, Weill Cornell Medicine, New York, NY, United States
Synopsis
To evaluate a whole body rapid imaging technique to calculate neonatal lean body mass and percentage adiposity using 3.0 Tesla chemical shift Magnetic Resonance Imaging (MRI). A rapid 2-Point Dixon MRI technique was used to calculate whole body fat and water images at 3.0 Tesla in term (n=10) and preterm (n=15) infants in 42 seconds/scan. MRI calculated whole body mass correlated closely with measured body weight (R2=0.87;p<0.001). Scan-rescan analysis demonstrated a 95% limit of agreement of 1.3% adiposity. At term corrected age, former preterm infants had significantly reduced lean body mass compared to term born controls 1935g versus 2416g (p=0.002).
INTRODUCTION
Adequate nutrition during early life is crucial for proper neurologic and cognitive development. Evidence suggests that when preterm infants reach term-corrected age (TCA), their body composition differs markedly from that of their healthy, term-born counterparts. Efforts to optimize the nutritional care of preterm infants are limited by existing methods of growth monitoring and body composition assessment in newborns. In current clinical practice, neonatal growth is tracked by plotting weight and length along growth curves, without consideration for the differential accumulation of fat versus lean tissue mass.
In the present study,
we endeavored to demonstrate that chemical shift MRI is a rapid, detailed, and
robust method of body composition analysis that can be feasibly implemented
into the routine clinical care of newborns. Further, we aimed to show that
chemical shift MRI has the sensitivity to detect differential growth patterns
in preterms at TCA versus term controls.
METHODS
Twenty-five infants were enrolled in the study [10 Males/15 Females, median (range) postnatal age 69 (1-138) days, median (range) corrected gestational age 39.4 (36.4-44.7) weeks] with 15 former preterm and 10 term infants. Infants were prepared for the MRI examination using a “feed and wrap” technique. Infants were fed and allowed to fall into a natural sleep without sedation or anesthesia and placed in a MedVac vacuum immobilization pack.
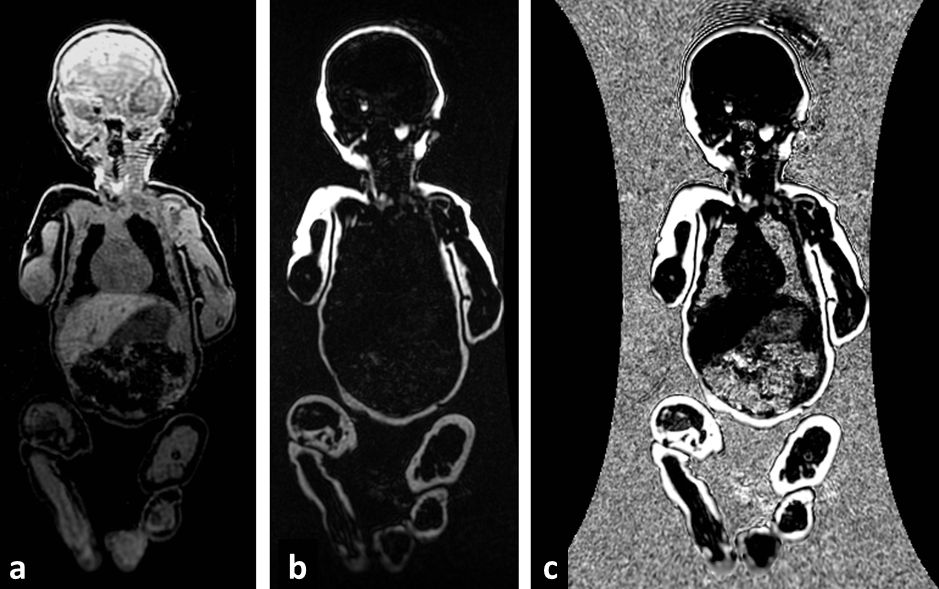
High resolution (1 mm3 isotropic) whole body fat and water images [Figure 1] were acquired on a 3.0 Tesla MRI scanner (GE Healthcare) using the adult Head/Neck 48-Channel Array coil and the Liver Acquisition with Volume Acceleration flex (LAVA-Flex) pulse sequence.1 A coronal 3D slab was acquired during free-breathing with 160 images using: TR/TE 4.0ms/1.7ms, flip angle of 12°, 48 cm (FOV), a 288x288 matrix reconstructed to 512x512 yielding a scan time of only 42 seconds.
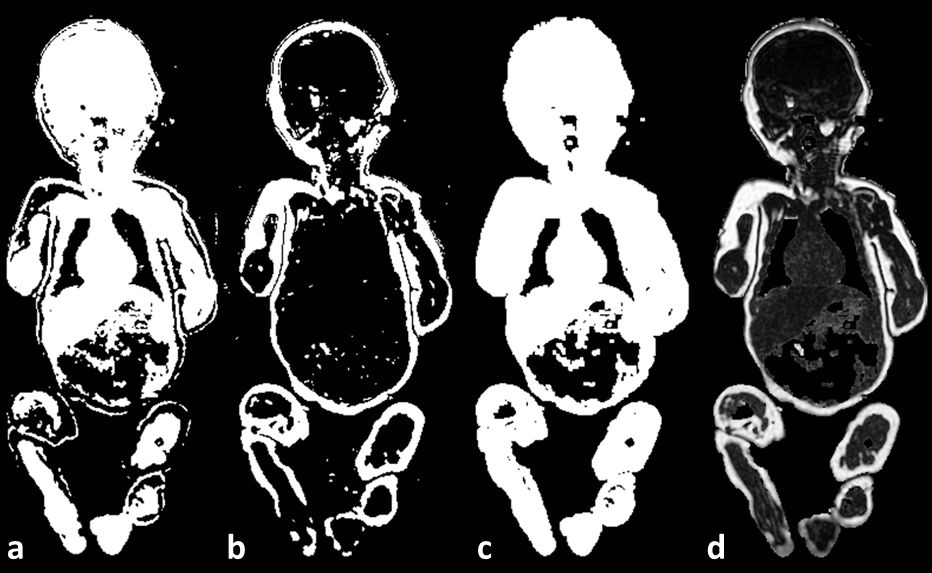
Macros were written in ImageJ (Rasband WS;NIH) to create fat fraction maps by calculation of F/(F + W) [Figure 1,2]. The total fat fraction (%FF) represents the area under the histogram ≥50% fat normalized to the total histogram area. The total body weight was estimated using: MRI Weight = Total Volume (cc) [%FF * 0.90 (g/cc) + (1 - %FF) * 1.06 (g/cc)].2 The lean body mass was calculated as the Total Volume (cc) * (1-%FF) * 1.06 (g/cc).
A Pearson’s Correlation Coefficient (R) from the linear regression
analysis compared MRI and actual measures of weight along with a two-tailed
t-test of p<0.05. A multiple regression accounted for age and group as
covariates when comparing lean body mass between pre-term (n=15) and term
(n=10) infants. The Bland-Altman difference test was performed to
determine the 95% limits of agreement of adiposity on repeat testing.
RESULTS
Chemical
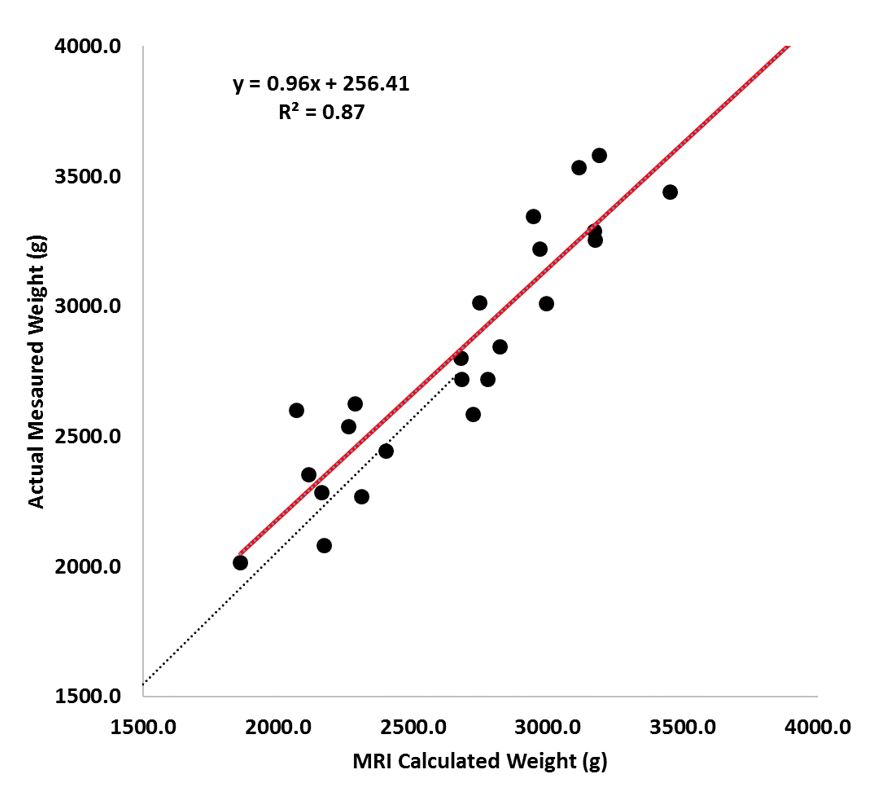
shift images were obtained in 42 seconds. MRI calculated whole body mass
correlated closely with measured body weight (R2=0.87;p<0.001).[Figure 3]
The linear regression yielded: Actual Measured Weight (g) = 0.96 * MRI
Calculated Weight (g) + 256.4 g.
Scan-rescan
analysis demonstrated a 95% limit of agreement of 1.3% adiposity. Preterm
infants were born at median 25.7wks gestation with birth weight 840g. At
term corrected age, former preterm infants were lighter than term born controls
2519g versus 3094g regressing out age and group as covariates (p=0.005).
However,
this was not due to reduced percentage adiposity 26% versus 24% (p=0.28).
At term corrected age, former preterm infants had significantly reduced
lean body mass compared to term born controls 1935g versus 2416g (p=0.002).
DISCUSSION
In this current cohort of 25 infants,
chemical shift MRI proved to be a rapid, accurate and repeatable method of body
composition analysis that may be feasible for implementation in routine
nutritional management of preterm-born infants. Body weight calculated by
chemical shift MRI was highly correlated with actual measured body weight.
Furthermore, these chemical shift MR images can be used to quantify lean
body mass and fat mass with high repeatability. Chemical shift MRI is also
highly detailed as we were able to visualize both total and regional adipose
tissue depots at 1 mm3 isotropic resolution. In seeking to better
understand the differential growth of preterm versus full-term infants, it may
be important to track not just whole body fat accumulation but also the fat
distribution; with such high resolution.
CONCLUSION
In summary, chemical shift MRI represents a safe, rapid, robust and detailed method of body composition analysis that holds potential to reform the way we monitor growth in newborns and to optimize the nutritional management of those infants born preterm. As growth and nutrition during the neonatal period are critical determinants of an infant’s later development and health status, novel imaging methods such as chemical shift MRI may allow clinicians to continue to advance strategies for optimally nourishing and monitoring growth in newborns.Acknowledgements
No acknowledgement found.References
1. Ma J. Magn Reson Med. 2004;52:415-419.
2. Ward SR, Lieber RL. J Biomech. 2005;38:2317-2320.
Figures