2444
MT contrast in the Post-mortem Neonate: A pilot study1UCL GOS Institute of Child Health, London, United Kingdom, 2Department of Radiology, Great Ormond Street Hospital for Children NHS Trust, London, United Kingdom
Synopsis
Post-mortem MRI imaging (PMMR) is rapidly becoming a useful tool in the minimally invasive autopsy of fetal and perinatal death allowing clinical diagnosis and assessment of major congenital abnormalities. A recent study suggested that magnetisation transfer values may be a more specific measure of post-mortem heart abnormalities, but there has little application of MT imaging in this area. We performed a preliminary exploration of MT contrast and MT pulse optimisation in whole body PMMR in neonates as part of a multi-parameter mapping protocol.
Introduction
Paediatric autopsy rates have declined over recent decades, leading to increased use of post-mortem magnetic resonance imaging in children based on visual radiological assessment, which has a comparatively high diagnostic accuracy rate1. However, it is complicated by the wide-ranging ages, sizes, maturation states, post-mortem interval and multiple disease types. It also requires whole body imaging, covering multiple organs with many different T1 and T2 values within the imaging volume. Therefore, while conventional T1w and T2w imaging has been shown to be useful, contrast is often not optimal. A recent study suggested that magnetisation transfer (MT) ratio may be a more specific post-mortem measure of heart abnormalities2 and MT is sensitive to myelination in the brain however there is very little application of MT imaging in this area to date. We have been developing a multi-parametric mapping (MPM) pipeline for post-mortem (PM) fetal whole body imaging, that can generate R1 (1/T1), R2* (1/T2*) and MT maps based on an existing approach using spoiled gradient echo images3 and variable flip angles4. Here, we performed a preliminary exploration of MT contrast and MT pulse optimisation as part of a multi-parameter mapping protocol.Methods
We acquired PMMR imaging in 5 neonates, mean gestational age 37 weeks, range (29-42 weeks) at 3T. Bodies were stored at 4°C and brought straight from the mortuary wrapped in insulating material to aid temperature stability. Whole body (vertex to mid-thigh) quantitative MPM images were performed with a 3T Siemens Prisma. Proton density and T1 multi-echo 3D fast low angle shot (FLASH) acquisitions3,4, (PDw: TR/FA 24.5ms/6°; T1w: TR/FA 24.5ms/21°, eight equidistant echo times (TEs between 2.34-18.72ms), RF transmit field map and one B0 field map5,6 alongside four MT weighted acquisitions with saturation pulses of 180, 220, 260 and 300 degrees were acquired. The image resolution for all sequences was 1mm isotropic. Details of MT measurement can be found in Helms 20107. Maps were calculated using in-house software in SPM (http://www.fil.ion.ucl.ac.uk/spm) based on Weiskopf et al3. ROIs were drawn manually in the major organs of white and grey matter, myocardium and liver using MIPAV (https://mipav.cit.nih.gov/) and plotted on the MT maps.Results
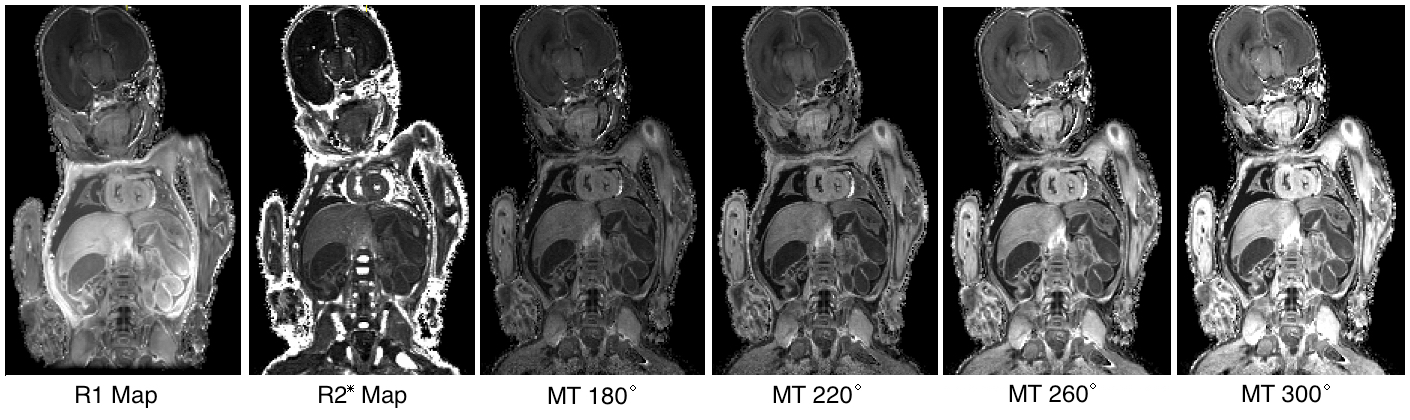
Fig. 1 shows example quantitative maps in a PM neonate. The R1 and MT maps show high contrast in the brain and organs of the body. It can be seen that the semi quantitative MT saturation maps have higher MT values at higher MT pulse angles. SAR was 1.01, 1.47, 2.02, and 2.66 W/Kg for 180, 220, 260 and 300 degree pulses respectively. Clinical SAR limits usually constrain the saturation pulse angle to 220 degrees in-vivo but this restriction is unnecessary ex-vivo.
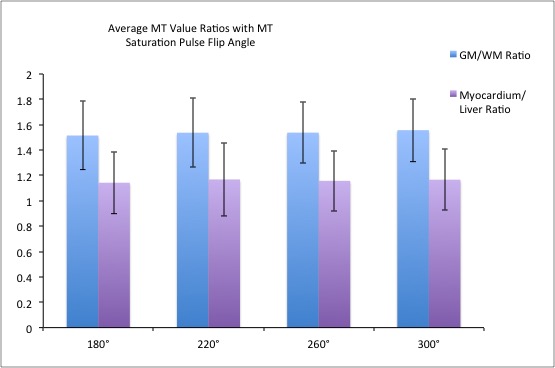
Ratios of MT value in the brain (GM/WM) and the body (Myocardium/Liver) are shown in Fig. 2 for the four MT saturation pulse flip angles. There is high contrast particularly in the brain. It can be seen that there is no significant increase in contrast ratio between tissues with MT saturation pulse angle. The error bars represent the inter-subject standard deviation.
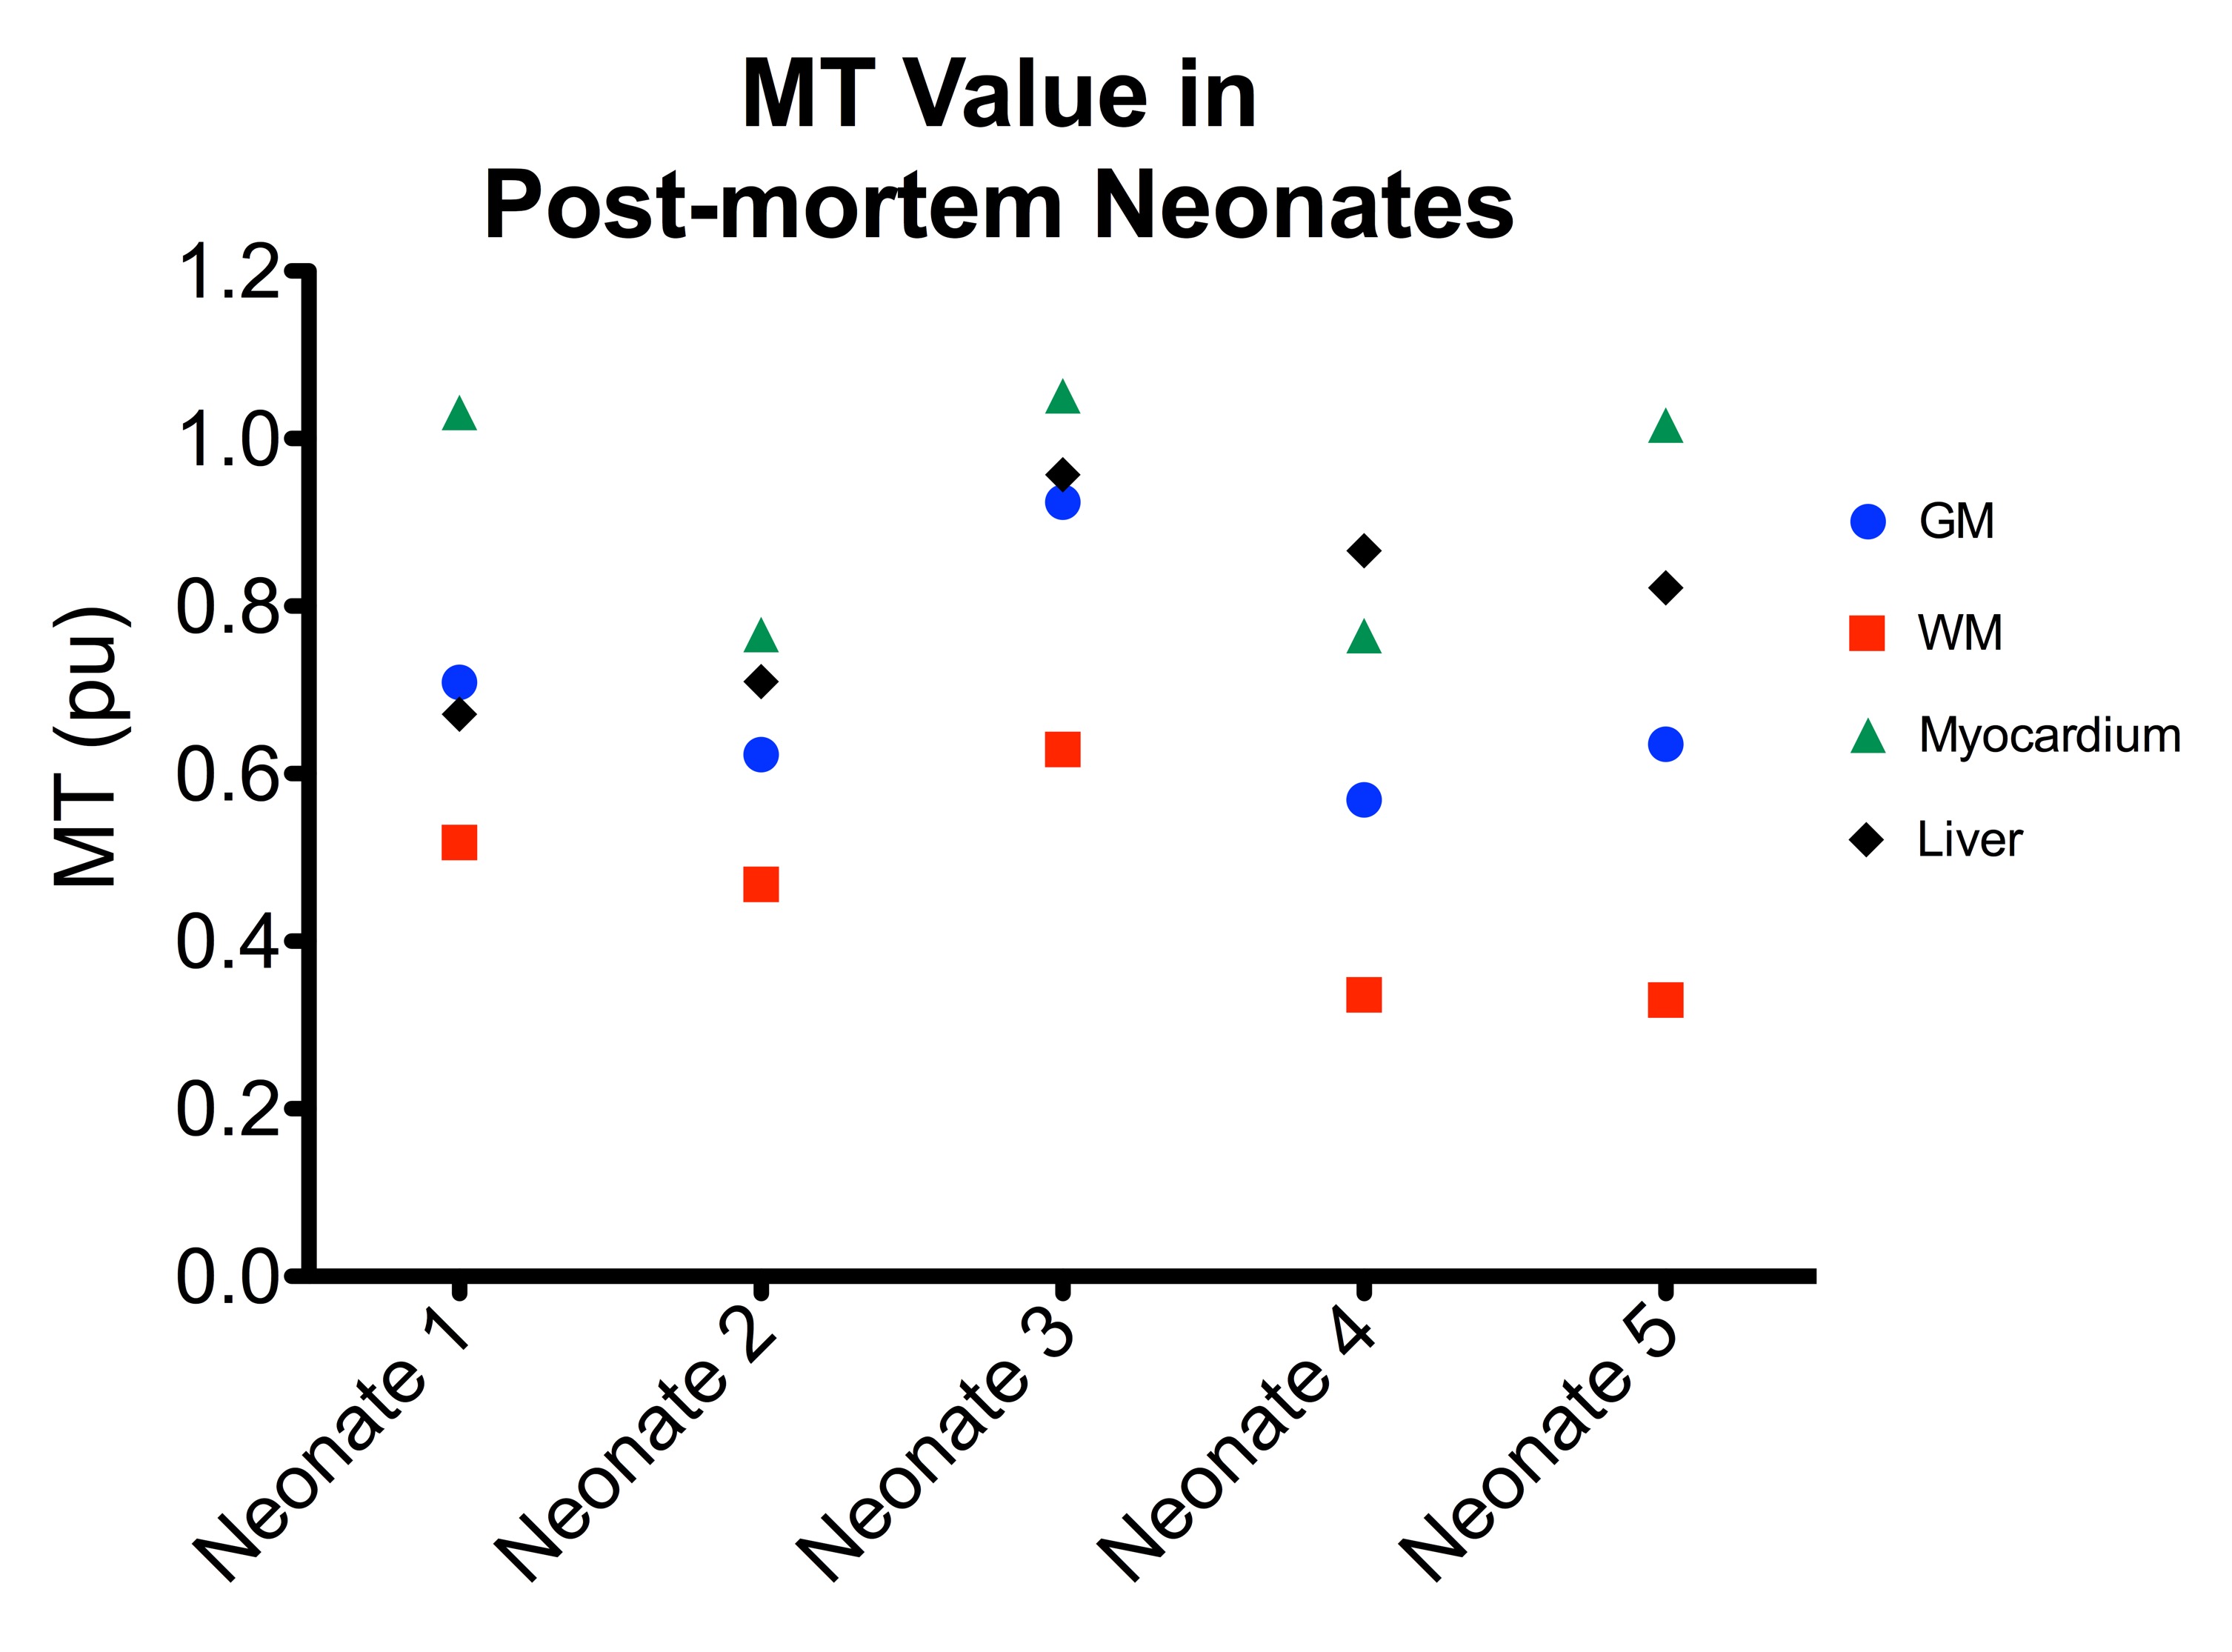
High contrast between MT value was achieved in the brain in the five neonates (Fig. 3). There is a wide variation in individual MT values in the brain and body. This, in combination with Fig. 3, shows that the MT values are highly variable between subjects which might be due to differing clinical factors such as maturation or time from death.
Discussion
Multi-parametric (MP) maps have been acquired in post-mortem neonates. The images obtained are of high quality and show strong tissue contrast. MT maps, that are semi-quantitative, showed increased signal with increased MT saturation pulse, however the contrast was very similar. The brain, myocardium and liver showed highly variable MT values and further work will evaluate a larger number of neonates for cardiac abnormalities2 and liver abnormalities using the MT maps with comparison to histologic markers.Acknowledgements
We would like to acknowledge Prof N. Weiskopf, Dr A. Lutti and Dr K. Pine at the Universite de Laussanne for the use of their sequences and reconstruction software. This research was funded by the National Institute for Health Research (NIHR) and supported by the Great Ormond Street Hospital Biomedical Research Centre. Dr O Arthurs is funded by an NIHR Clinician Scientist Fellowship award (NIHR-CS-012-002) and the NIHR Great Ormond Street Hospital Biomedical Research Centre.References
1. Arthurs OJ, Taylor AM, Sebire NJ. Indications, advantages and limitations of perinatal postmortem imaging in clinical practice. Pediatric radiology 2015; 45(4): 491-500.
2. Crooijmans HJ, Ruder TD, Zech WD, et al. Cardiovascular magnetization transfer ratio imaging compared with histology: a postmortem study. Journal of magnetic resonance imaging : JMRI 2014; 40(4): 915-9.
3. Weiskopf N, Suckling J, Williams G, et al. Quantitative multi-parameter mapping of R1, PD(*), MT, and R2(*) at 3T: a multi-center validation. Frontiers in neuroscience 2013; 7: 95.
4. Helms G, Dathe H, Dechent P. Quantitative FLASH MRI at 3T using a rational approximation of the Ernst equation. Magnetic resonance in medicine 2008; 59(3): 667-72.
5. Lutti A, Hutton C, Finsterbusch J, Helms G, Weiskopf N. Optimization and validation of methods for mapping of the radiofrequency transmit field at 3T. Magnetic resonance in medicine 2010; 64(1): 229-38.
6. Lutti A, Stadler J, Josephs O, et al. Robust and fast whole brain mapping of the RF transmit field B1 at 7T. PLoS One 2012; 7(3): e32379.
7. Helms G, Dathe H, Dechent P. Modeling the influence of TR and excitation flip angle on the magnetization transfer ratio (MTR) in human brain obtained from 3D spoiled gradient echo MRI. Magnetic resonance in medicine 2010; 64(1): 177-85.
Figures