2443
A Study of Lung Function Variability in Chronic Obstructive Pulmonary Disease Using Hybrid Hyperpolarized 3He Imaging1Radiology, University of Pennsylvania, Philadelphia, PA, United States, 2Anesthesiology and Critical Care, University of Pennsylvania, Philadelphia, PA, United States
Synopsis
To better understand variable lung function in COPD, we imaged a subset of COPDGene subjects at baseline, one week post-baseline and one month post-baseline using a multifaceted hyperpolarized (HP) 3He scheme to measure apparent diffusion coefficient (ADC), fractional ventilation (FV), alveolar oxygen tension (PAO2) and oxygen uptake (R) variability.
Introduction
Respiratory system responses to smoking and other toxins are extremely heterogeneous. While most smokers’ lungs show functional deterioration similar to normal age-related decline, 25% undergo a much steeper functional decline1. Additionally, recent large-scale studies have identified lower lung function in early adulthood as important in the later genesis of COPD, challenging the accepted model of COPD as uniformly characterized by rapidly deteriorating lung function2. To better understand variable lung function in COPD, we imaged a subset of COPDGene subjects using a multifaceted hyperpolarized (HP) 3He scheme to measure apparent diffusion coefficient (ADC), fractional ventilation (FV), alveolar oxygen tension (PAO2) and oxygen uptake (R) in a single acquisition3. To determine the test-retest repeatability and between-cohort differences and variability of these markers, patients were imaged three times over the course of one month to study short- and long-term disease progression.Materials and Methods
We previously presented a multi-breath wash-in hybrid imaging protocol that simultaneously provides all functional and structural parameters of HP 3He MRI (ADC, FV, PAO2 and R) in under 2 minutes using 1 litre of imaging gas diluted with nitrogen and 21% oxygen3. To show this protocol’s reproducibility, we plan to image 15 human subjects from 3 cohorts: healthy nonsmokers, asymptomatic smokers, and symptomatic smokers (recruited from COPDGene). Imaging was performed in a whole body 1.5-T MRI system (Siemens MAGNETOM) using a flexible 8-channel (2×4 phased array) chest coil (Stark, Germany) and a 2D multi-slice GRE image set with 6 ~25mm coronal slices (adjusted to cover the whole lung with a 20% inter-slice gap), MS=6x48x36 (~8×8 mm2 planar resolution), α≈6°, TR/TE=7.0/3.3ms. Imaging acceleration was performed using GRAPPA (~2×). The FV image series consisted of 6 normoxic breaths (3He:N2:O2 ~1:3:1) at 5.5s intervals, followed by a combined PAO2/ADC series, including the accelerated, interleaved ADC image pair. Total imaging time was approximately 1 minute, including 2-4 practice breaths containing 4He and a 10-second breath-hold (Figure 1). To account for minor position changes during the sequence, a non-rigid affine-based co-registration was performed on spin density maps from all seven time-points and all the back-to-back and weekly and monthly sessions before fitting. For segmentation, automatic contrast-limited adaptive histogram equalization with a grey-scale threshold was applied to mask background noise and segment the lung (9). For analysis on the same basis for statistical comparisons, an atlas of the lung was generated by summing all the existing data and applying a smoothing Gaussian filter. The analysis was performed from the top (whole-lung analysis) to bottom (full resolution); global (whole-lung) and slice ADC, R and FV values were calculated based on the signals summed over the subject’s whole lung and slice at each time point. Comparisons were also performed in bins of n×n×m voxels to maintain regionality while minimizing error due to limited signal-to-noise in individual voxels. Back-to-back imaging in each session (5-10 minutes) was used to obtain technical reproducibility, which was in turn used to assess longer-term (weekly and monthly) variability. Pulmonary function tests (PFTs) and St. George’s Respiratory Questionnaire (SGRQ) were also obtained before each MRI session. Global repeatability is compared between imaging and non-imaging parameters; regional repeatability of imaging parameters is used to study the short– and long-term variability in at-risk smokers.Results and Discussion
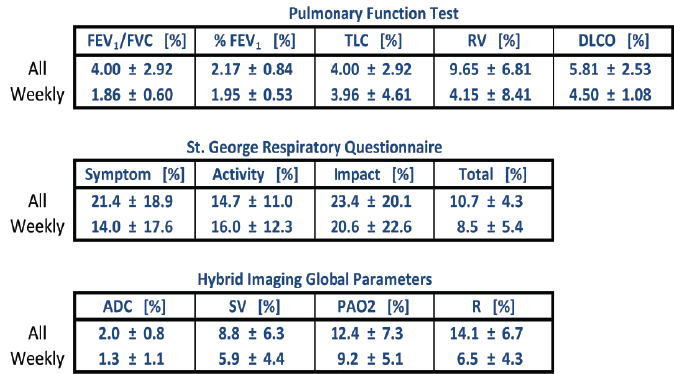
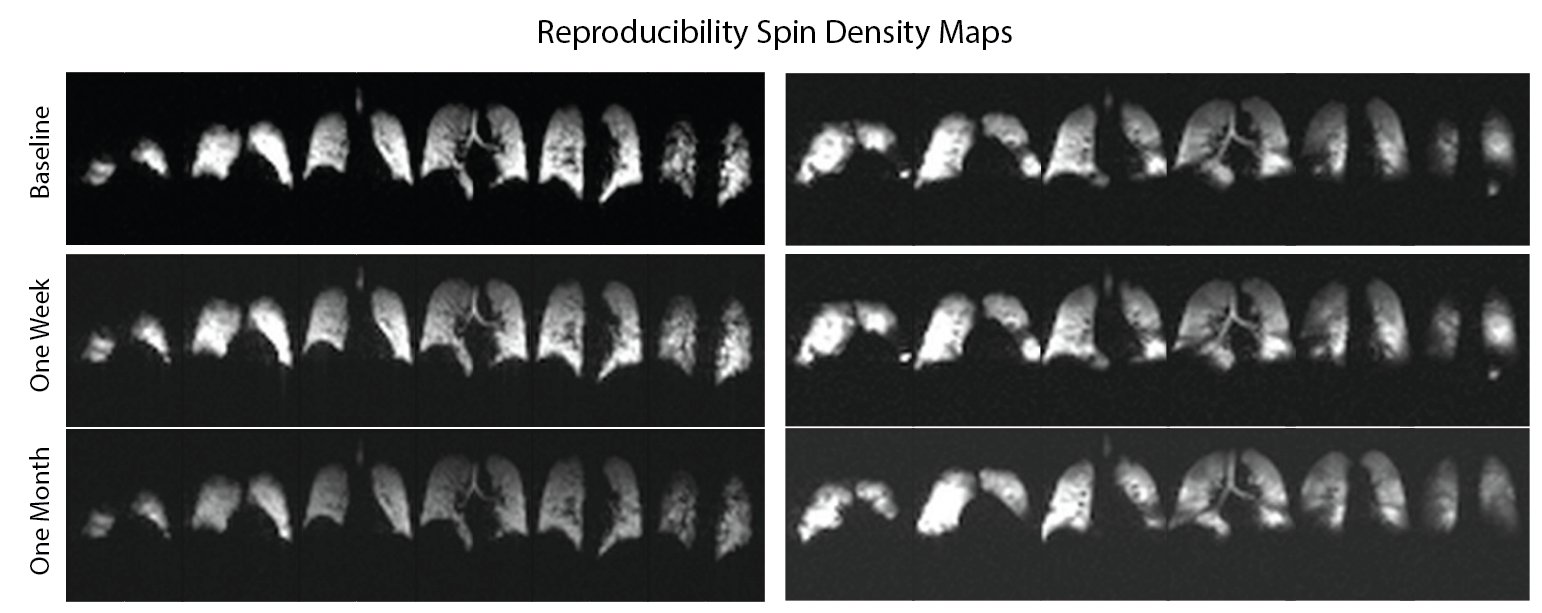
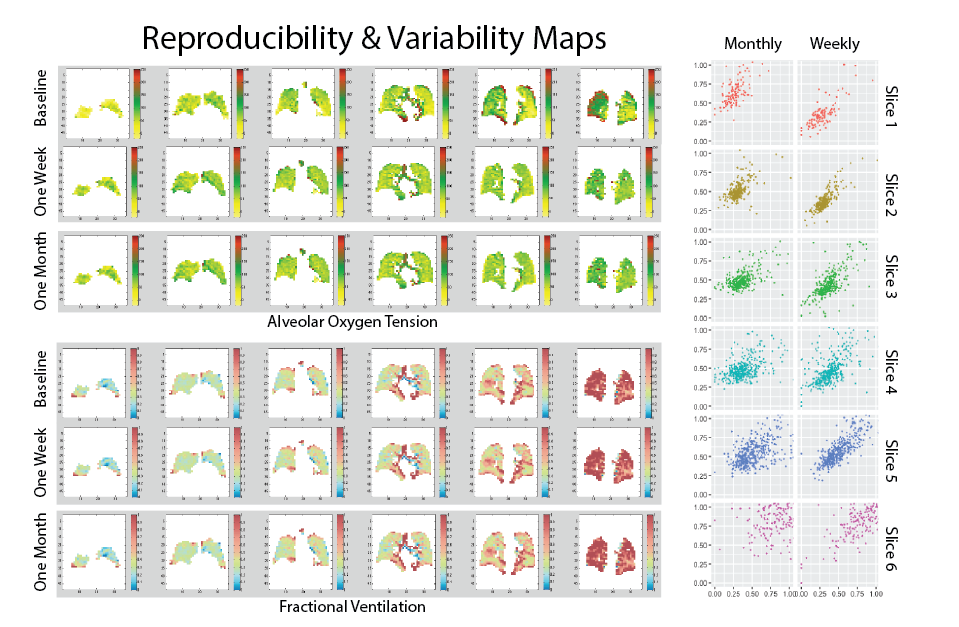
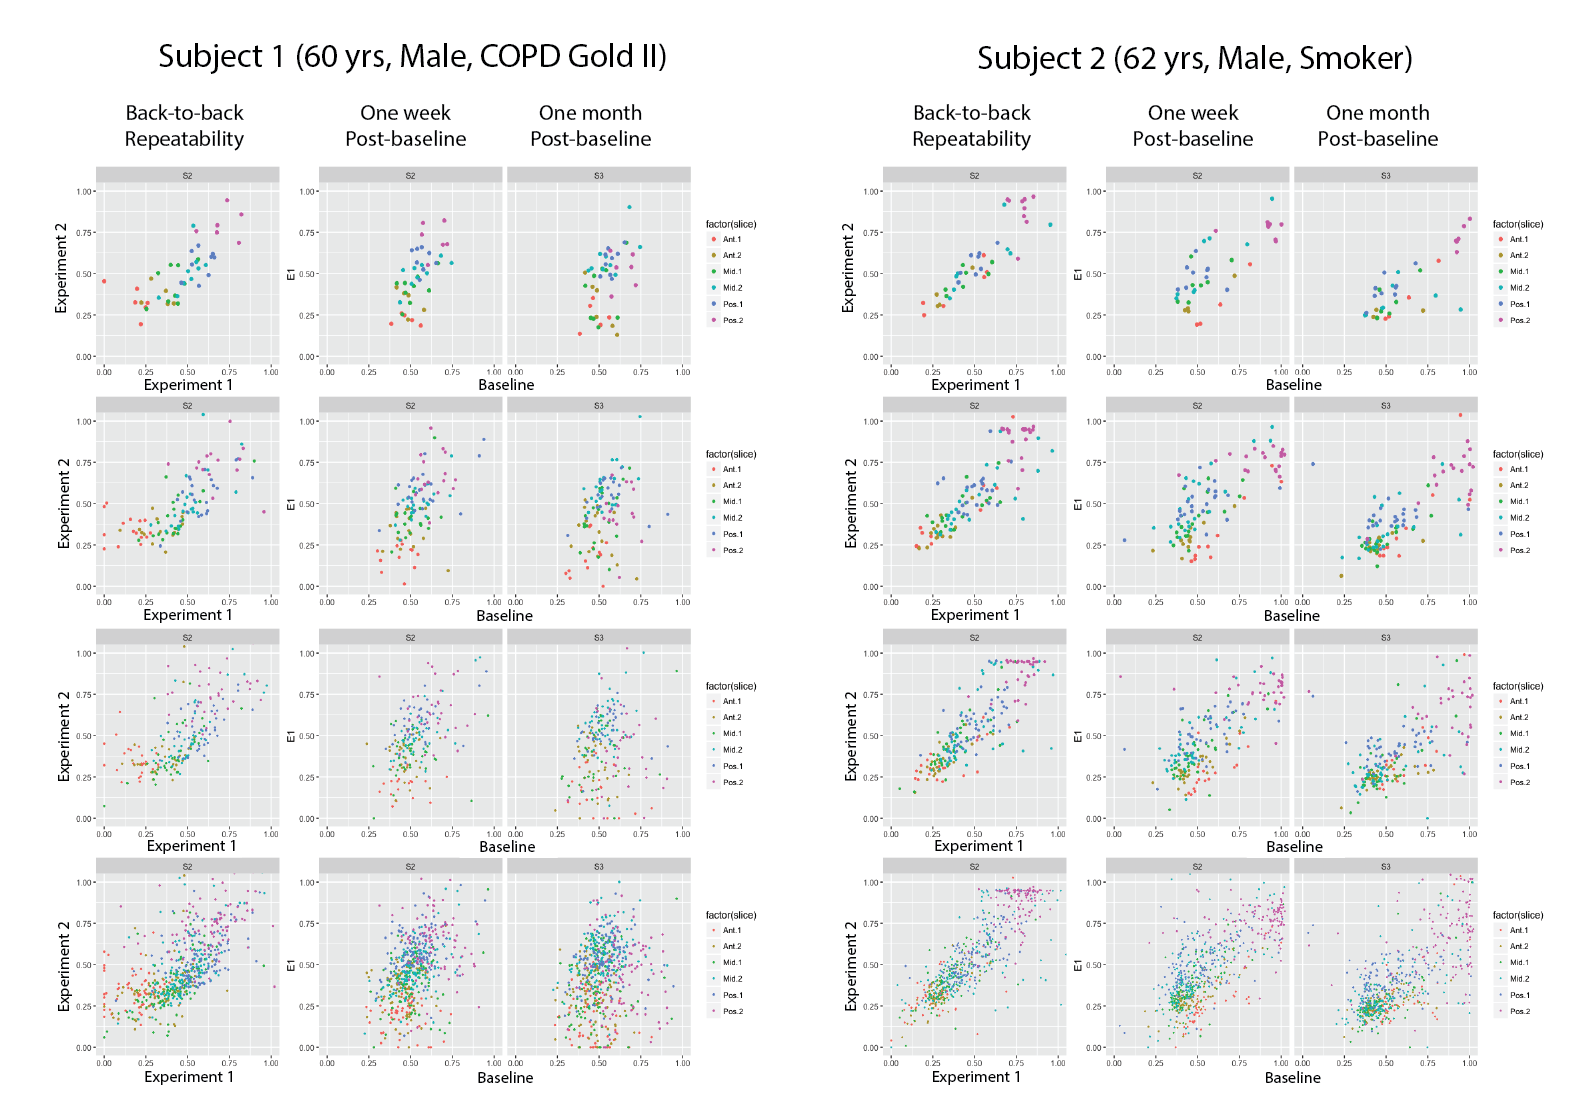
5 symptomatic smokers (FEV1/FVC=66±8%) were imaged three times to this point: at baseline, 1 week post-baseline, and 1 month post-baseline. Table 1 compares the coefficients of variance (COV) between imaging and global non-imaging parameters at each time point. SGRQ (COV>10%) variability was higher than that of imaging parameters both one week and one month post-baseline, while all PFT parameters were the least variable, with the exception of residual volume (COV<6%). As expected, ADC was the most repeatable imaging parameter (COV=2%), while oxygen uptake variability was substantially higher (6.5% and 14.1% at one week and one-month post-baseline, respectively). Representative maps of imaging parameters and their short- and long-term repeatability are shown in Figure 2 and Figure 3. Pixel-by-pixel correlation (Figure 4) is significantly lower when monthly (0.423±0.226) and weekly (0.692±0.286) measurements are compared (P=0.003). The intra-class correlation coefficient was 0.668±0.325 for the COPDers imaged thus far.Conclusion
This is an ongoing reproducibility study whose end results are contingent upon comparison with healthy subjects. To this point, the corrected variability in imaging markers (accounting for repeatability results) was significantly higher than that of PFTs. We hypothesize that this is due to the higher sensitivity of our regional imaging markers as well as the real physiological variability in symptomatic smokers, but this should be tested by imaging healthy nonsmokers.Acknowledgements
No acknowledgement found.References
1. F Løkke, P Lange, H Scharling, et al. Developing COPD: a 25 year follow up study of the general population, Thorax 2006; 61(11):935–939.
2- Lange P, Celli B., Agustí A, et al. Lung-Function Trajectories Leading to Chronic Obstructive Pulmonary Disease, NEJM2015; 372:2
3- Hamedani H, Clapp JT, Kadlecek SJ, et. Regional fractional ventilation by using multibreath wash-in 3He MR imaging. MRM 2017; 78(2),611-624
Figures
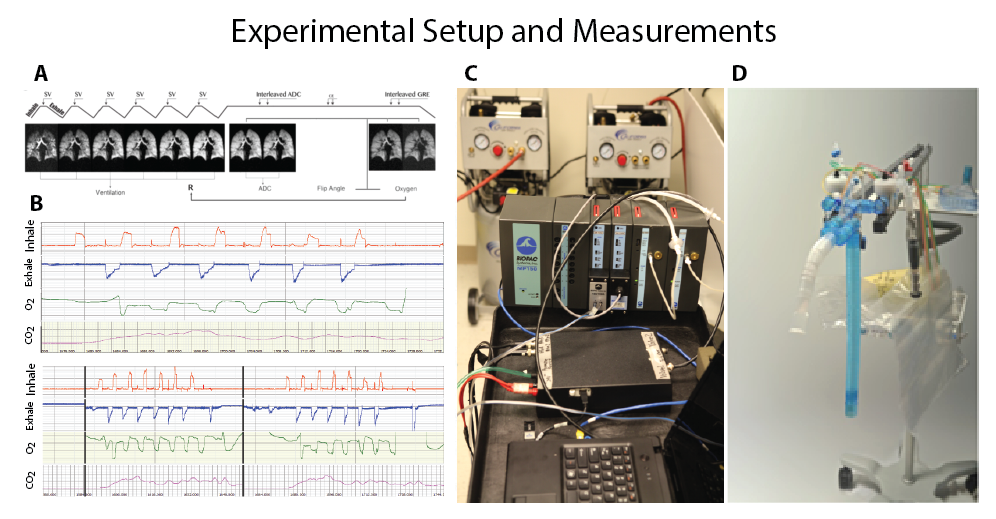
Figure 1- A) the breathing and imaging protocol, B) measurements of flows, volumes and inspired and expired gas concentrations, C) the experimental setup and the gas delivery device.