2442
A paired approach to the segmentation of proton and hyperpolarized gas MR images of the lungs1Polaris, The University of Sheffield, Sheffield, United Kingdom, 2INSIGNEO, The University of Sheffield, Sheffield, United Kingdom, 3Academic Unit of Clinical Oncology, The University of Sheffield, Sheffield, United Kingdom, 4Sheffield Children’s Hospital, Sheffield Children’s NHS Foundation Trust and Sheffield Teaching Hospitals NHS Foundation Trust, Sheffield, United Kingdom
Synopsis
Quantitative analyses of hyperpolarized gas and 1H lung MRI together provide quantitative information on lung obstruction. Quantification requires segmentation of the ventilated and non-ventilated regions of the hyperpolarized gas MRI and definition of the lung cavity from the paired 1H MRI. Spatial fuzzy c-means segmentation was developed to segment these image pairs simultaneously. Error measures with respect to manual reference segmentations and qualitative grading showed significant improvements when compared to an established method. This work may help towards standardisation and automation of lung ventilation image analysis, and help improve accuracy and reproducibility.
Introduction
Quantitative analysis of hyperpolarized (HP) gas ventilation MRI and 1H lung MRI together has been shown to be valuable in the early detection of obstructive lung disease, for example in children with cystic fibrosis1,2. These numerical assessments require the segmentation of both the functional image, typically acquired using a hyperpolarized gas as an inhaled ventilation tracer, and the anatomical 1H image. The resulting partitioning of the lung region into ventilated and non-ventilated subsets is used directly to determine the percentage defect volume metric - the percentage of lung volume that is not ventilated3,4; furthermore, by spatially constraining the computation to the ventilated region, additional metrics, e.g. the assessment of ventilation heterogeneity5, can be quantified. The key role played by these metrics highlights the importance of advances towards automation in order to reduce subjectivity in the assessments and the time required to perform image analysis.Methods
Image Segmentation
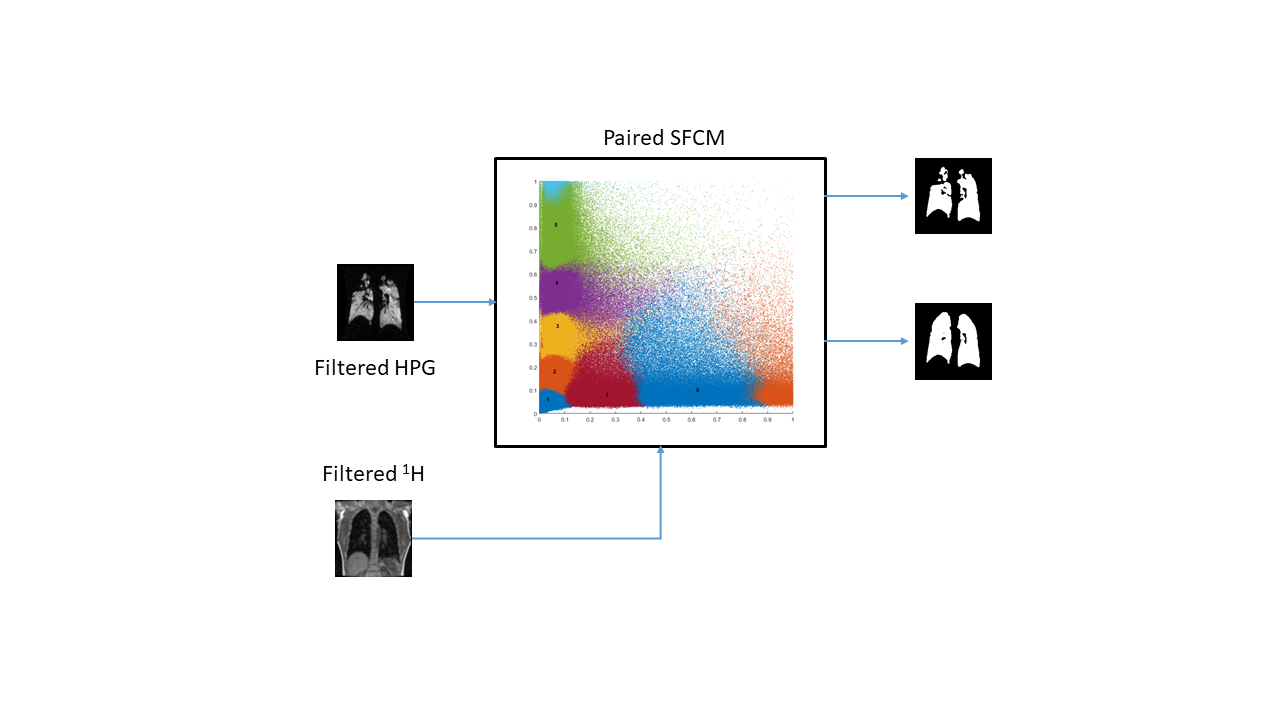
A new approach was developed by applying the spatial fuzzy c-means (SFCM) clustering6,7 to vector-valued images as input in order to take advantage of the combined information arising from the co-location of HP gas and proton acquisitions. The actual segmented regions are determined by thresholding the membership functions of specific clusters and combining them into lung regions and ventilated regions (figure 1). Subsequently, an ad-hoc noise removal stage for the proton mask further refines the final outcome. This new approach takes place in, and updates, the workflow currently in use7, where bilateral filters pre-process the images before the 2-tuple SFCM takes place, and users manually highlight the airways and refine, where necessary, the segmented regions in itksnap8 to complete the workflow.
Quantitative Performance Assessment
The performances of the new (paired) method and the original (independent) method7 were quantified by comparing them to a manually-edited ground-truth and computing a relative error measure9 as $$err = \frac{FP + FN}{TP}$$ where the standard abbreviations for True/False Positives and Negatives are used.The relative errors for both structural and ventilated regions were computed on seven data sets comprised of same-breath hyperpolarized 3He and 1H MRI10,11 at 1.5T (GE HDx, Milwaukee, WI), selected from a clinical database to include a broad spectrum of phenotypical representations and one healthy volunteer.
Segmentation-Quality Grading
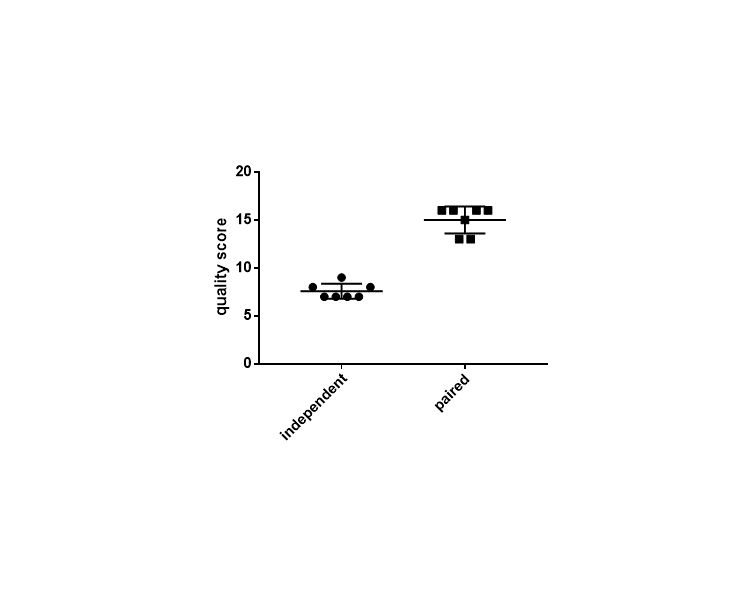
The perceived quality of the segmentation results was also assessed on the same seven data sets. A blinded evaluation was carried out where four experienced readers graded the two methods against the seven cases; detailed instructions were given to the graders and a training session was performed. For each case, each reader scored the outcome of each method according to the expected amount of manual editing ‑ the highest score corresponding to negligible amount of manual editing and the lowest score to an expected extensive editing on most of the image slices.
The computed relative errors and the qualitative grades were tested for significant difference between the two segmentation methods using the Wilcoxon rank sum test.
Results
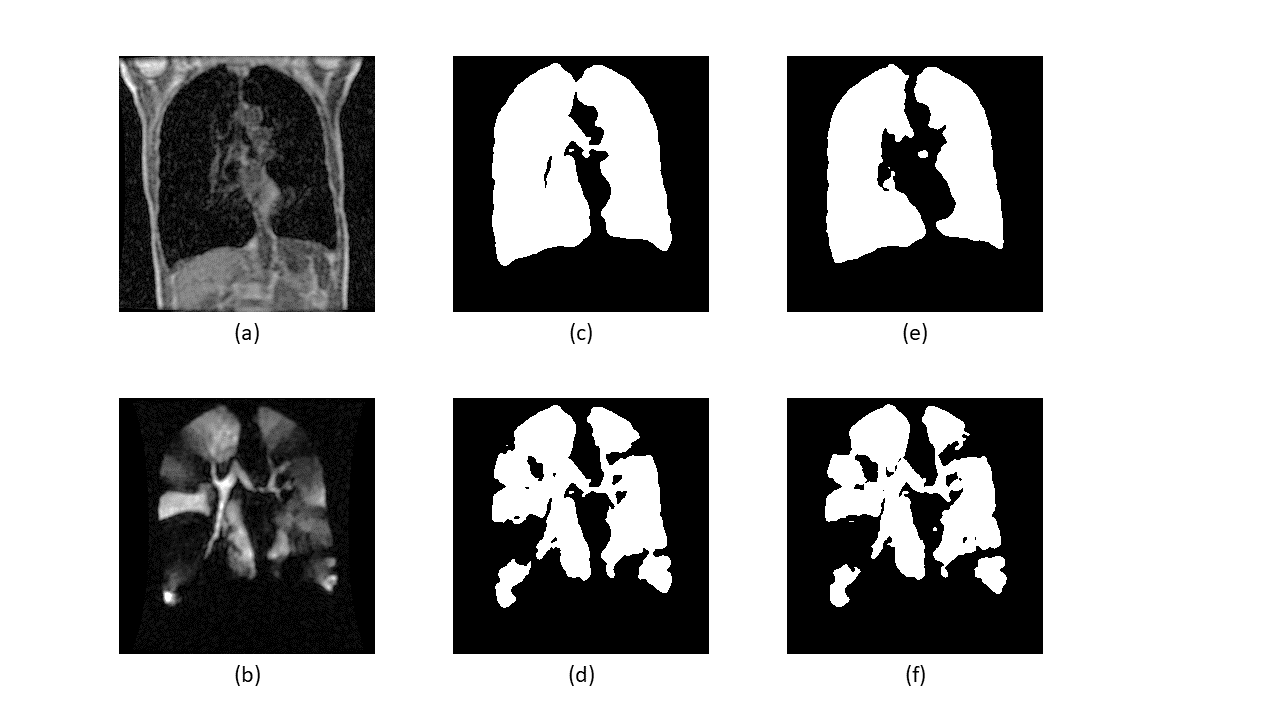
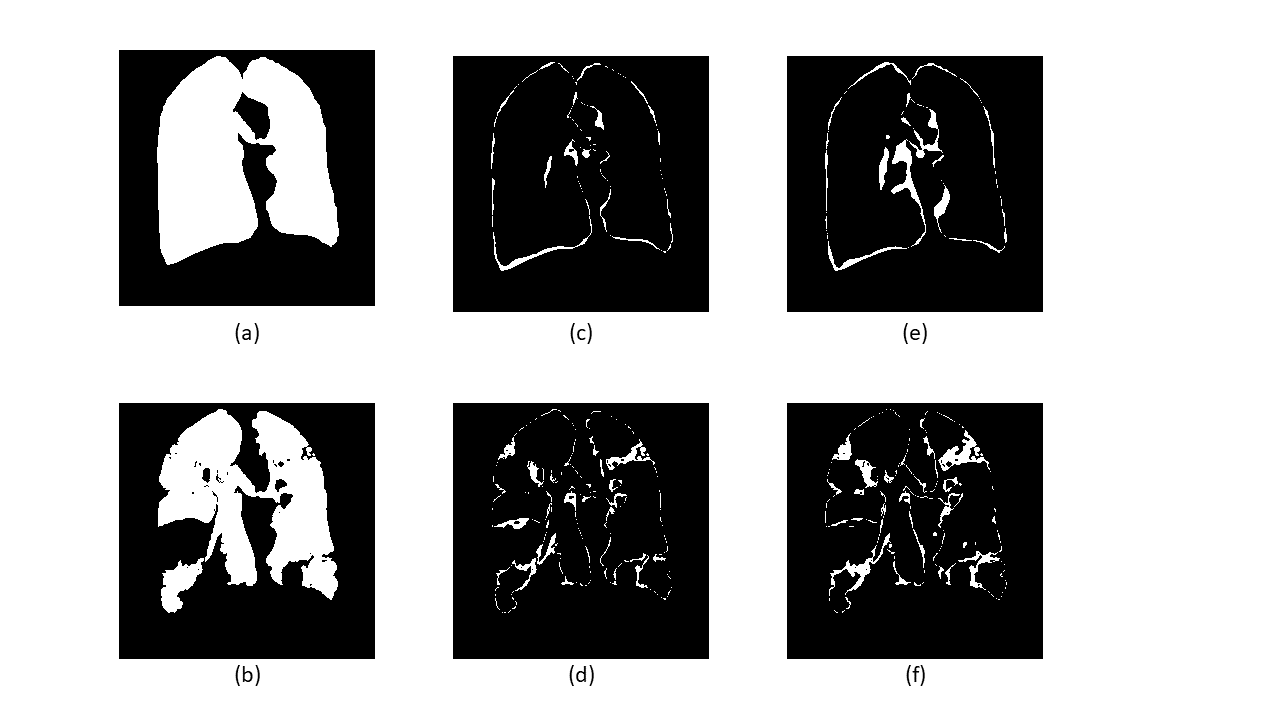
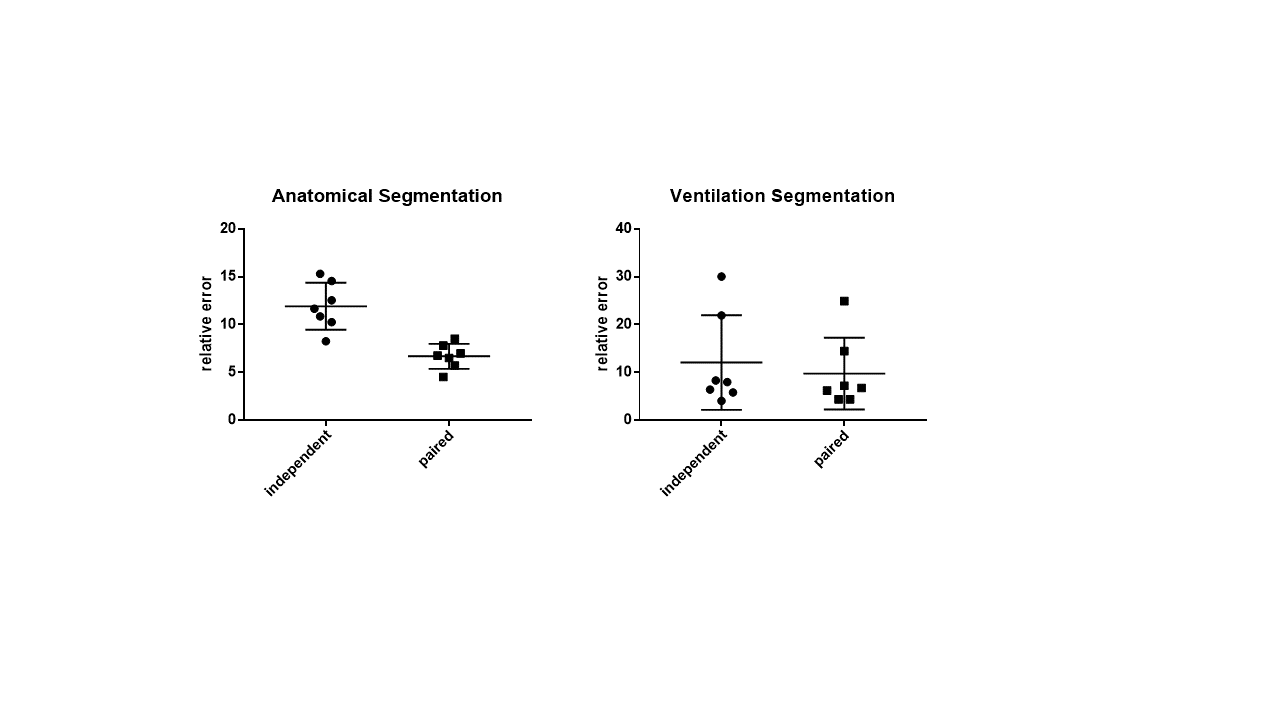
Figure 2 shows the results of the two different segmentation methods applied to a representative image slice of a proton/HP gas pair and Figure 3 shows the respective errors when compared to the ground truth. Figure 4 shows the relative errors for each method, with a significant difference between the methods of p=0.0012 for the anatomical images. The median relative errors for the paired segmentation technique were 6.7 and 6.8 for the anatomical and ventilation segmentations respectively, compared to 11.7 and 8.0 for independent segmentation. Figure 5 reports the outcomes of the grading process, the difference between the two methods being significant (mean independent=1.9, mean paired=3.8, p<0.001).Discussion
The new (paired) segmentation method significantly improved performance, decreasing the relative error for both anatomical and ventilation masks (figure 4). The masks computed by the new method were also perceived as markedly better than the original (independent) SFCM method (Figure 5), which supports the reduction in relative error from a qualitative point of view. It is also worth noting that the HP gas/proton image pairing makes it possible to increase the amount of spatial homogeneity in the SFCM clustering and, consequently, the combined segmentation approach shows an improved resilience to noise and motion artifacts.
Conclusion
The proposed combined segmentation method produced results significantly closer to the manual ground-truth segmentation than independent SFCM clustering, and reduced the expected amount of manual editing required. This may contribute to standardisation and automation of lung ventilation image analysis by reducing manual input, thus enabling improved accuracy and reproducibility while decreasing editing time.Acknowledgements
This work was supported by NIHR grant NIHR-RP-R3-12-027 and MRC grant MR/M008894/1.The views expressed in this publication are those of the author(s) and not necessarily those of the NHS, the National Institute for Health Research or the Department of Health.References
- Marshall, Helen, et al. "Detection of early subclinical lung disease in children with cystic fibrosis by lung ventilation imaging with hyperpolarised gas MRI." Thorax 2017;72:760-762.
- Kanhere N, Couch MJ, Kowalik K, Zanette B, Rayment JH, Manson D,
Subbarao P, Ratjen F, Santyr G. Correlation of LCI with hyperpolarized
129Xe magnetic resonance imaging in pediatric CF subjects. Am J Respir Crit Care Med. 2017;196(8):1073-1075
- Woodhouse N, Wild JM, Paley MN, Fichele S, Said Z, Swift AJ, van Beek EJ. Combined helium‐3/proton magnetic resonance imaging measurement of ventilated lung volumes in smokers compared to never‐smokers. Journal of magnetic resonance imaging 2005;21(4):365-9.
- Kirby M, Pike D, Coxson HO, McCormack DG, Parraga G. Hyperpolarized 3He ventilation defects used to predict pulmonary exacerbations in mild to moderate chronic obstructive pulmonary disease. Radiology. 2014;273(3):887-96.
- Tzeng YS, Lutchen K, Albert M. The difference in ventilation heterogeneity between asthmatic and healthy subjects quantified using hyperpolarized 3 He MRI. Journal of applied physiology. 2009;106(3):813-22.
- Chuang KS, Tzeng HL, Chen S, Wu J, Chen TJ. Fuzzy c-means clustering with spatial information for image segmentation. computerized medical imaging and graphics. 2006 Jan 31;30(1):9-15.
- Hughes PJ, Horn FC, Collier GJ, Biancardi A, Marshall H, Wild JM. Spatial fuzzy c‐means thresholding for semiautomated calculation of percentage lung ventilated volume from hyperpolarized gas and 1H MRI. Journal of Magnetic Resonance Imaging. 2017;63: 658–666.
- Yushkevich PA, Piven J, Hazlett HC, Smith RG, Ho S, Gee JC, Gerig G. User-guided 3D active contour segmentation of anatomical structures: significantly improved efficiency and reliability. Neuroimage. 2006;31(3):1116-28.
- Biancardi AM, Wild JM. New Disagreement Metrics Incorporating Spatial Detail–Applications to Lung Imaging. In Annual Conference on Medical Image Understanding and Analysis 2017;804-814.
- Wild, J.M., et al., Synchronous acquisition of hyperpolarised 3He and 1H MR images of the lungs–maximising mutual anatomical and functional information. NMR in Biomedicine 2011; 24(2):130-134.
- Horn FC, Tahir BA, Stewart NJ, Collier GJ, Norquay G, Leung G, Ireland RH, Parra‐Robles J, Marshall H, Wild JM. Lung ventilation volumetry with same‐breath acquisition of hyperpolarized gas and proton MRI. NMR in Biomedicine. 2014;27(12):1461-7.
Figures