2429
Breast phyllodes tumor: histogram analysis of the apparent diffusion coefficient for assessment of tumor grading1Department of MRI, The First Affiliated Hospital of Zhengzhou University, Zhengzhou, China, 2GE Healthcare, China, Beijing, China
Synopsis
Phyllodes tumors are uncommon, biphasic, fibroepithelial lesions of the breast, characterized by leafy stromal fronds capped by benign bilayered epithelium. Grading of breast phyllodes tumors is critical for diagnosis, treatment options and preoperative evaluation. This study is to assess the feasibility of diffusion weighted image (DWI) for determining phyllodes tumors grades in the femoral breast. Our results reveal that histogram analysis of apparent diffusion coefficient (ADC) parameters derived from DWI can be used to classify the benign and malignant breast phyllodes tumors patients. This can be applied for clinical diagnose and treatment.
Introduction
Phyllodes tumor of the breast accounts for <1% of breast tumor [1] and about 2%-3% of fibroepithelial neoplasms. These tumors are composed of epithelial elements and a connective tissue stroma. The tumors can be classified as benign, borderline and malignant. Studies have shown that the recurrence rate of benign PT is about 8%, borderline and malignant PT recurrence rate is about 30%, about 22% malignant PT can occur distant metastasis [2]. In order to reduce the recurrence rate, NCCN guidelines recommend borderline or malignant tumor resection margins > 1cm or partial mastectomy, and benign tumor margins include at least the normal breast tissue within the range of 1cm. Therefore, preoperative correct diagnosis of breast PT pathological type is of great significance for the treatment. The ADC histogram is based on voxel which can reflect the whole section of the information in a comprehensive way. The purpose of this study is to assess the feasibility of the histogram analyses of ADC for determining phyllodes tumors grades in the femoral breast.Methods
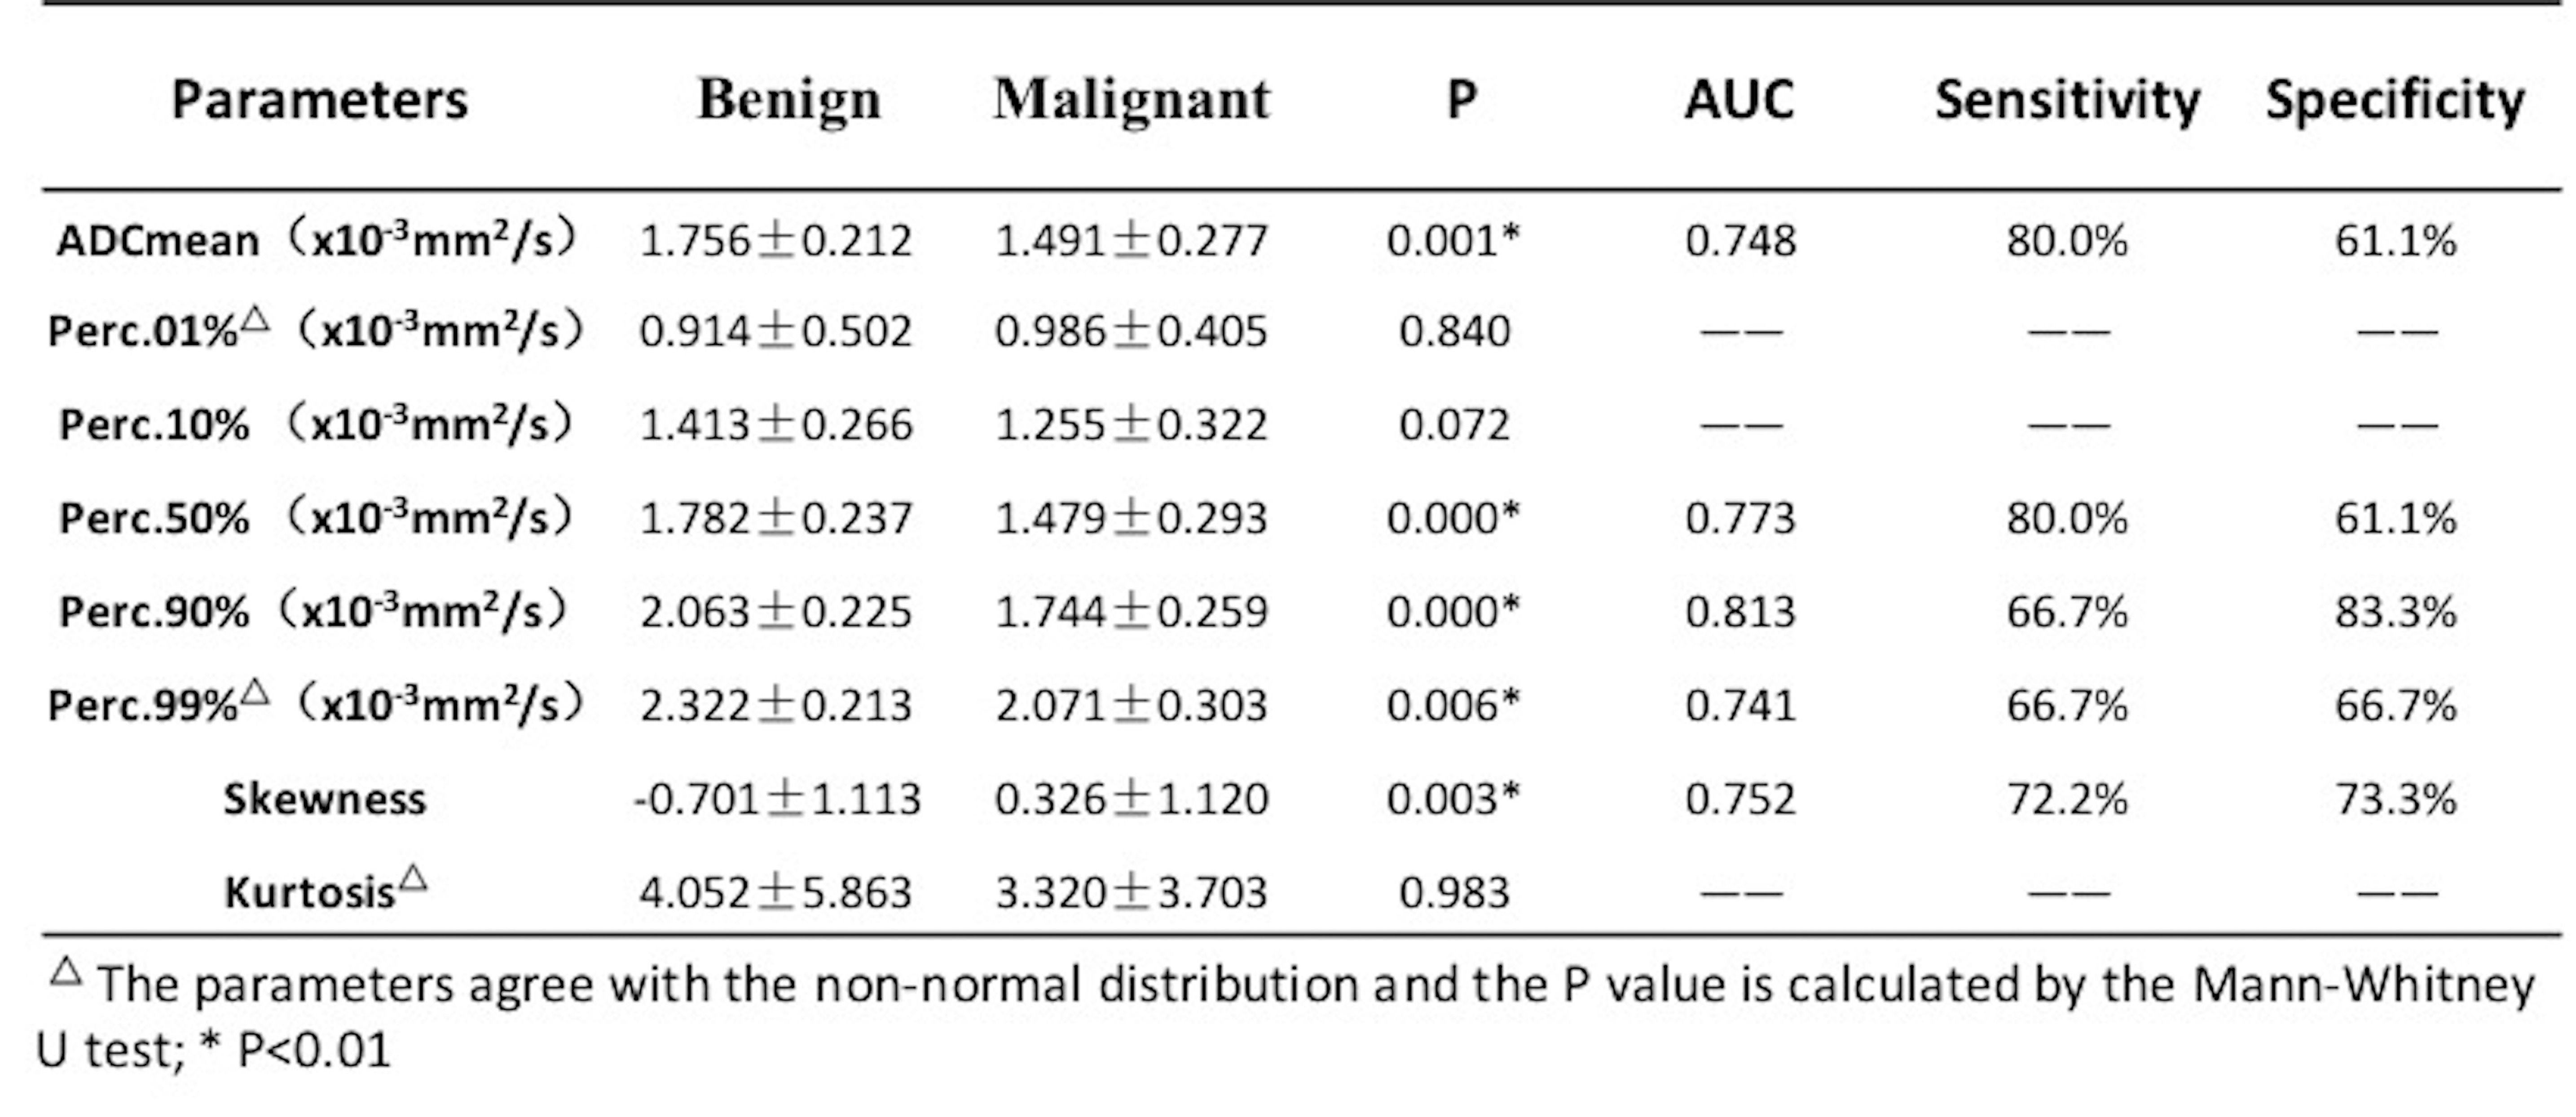
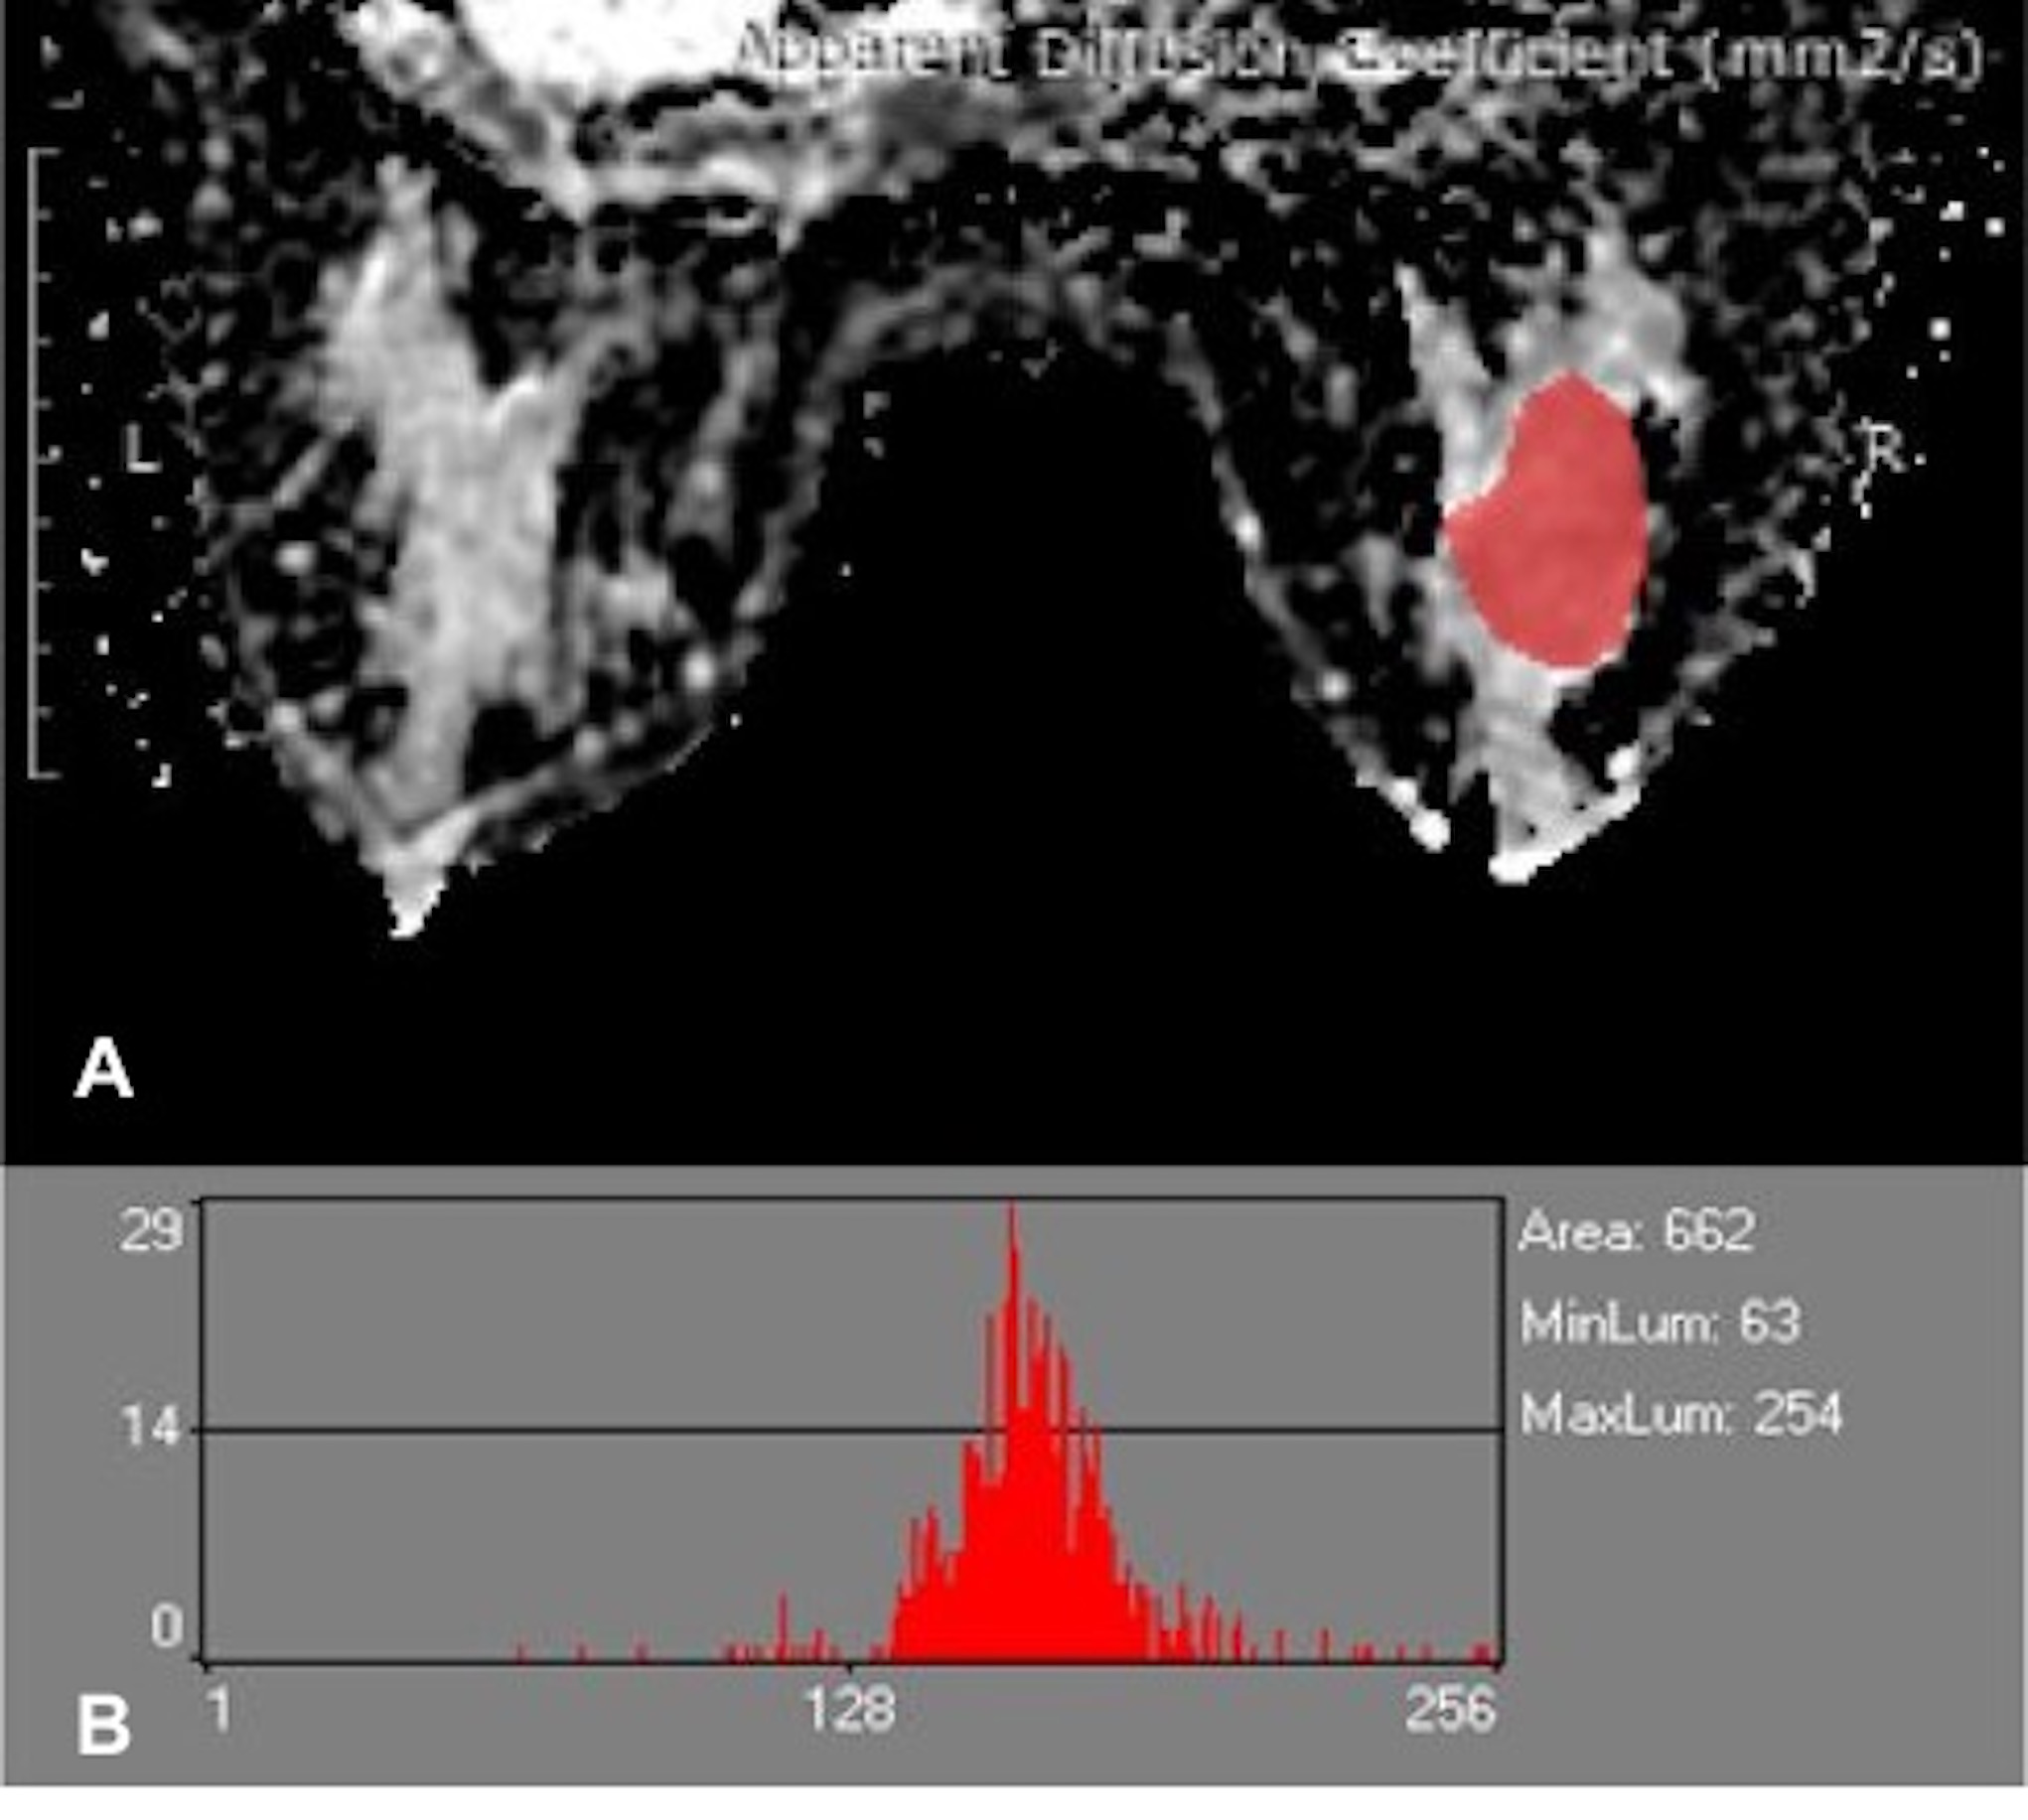
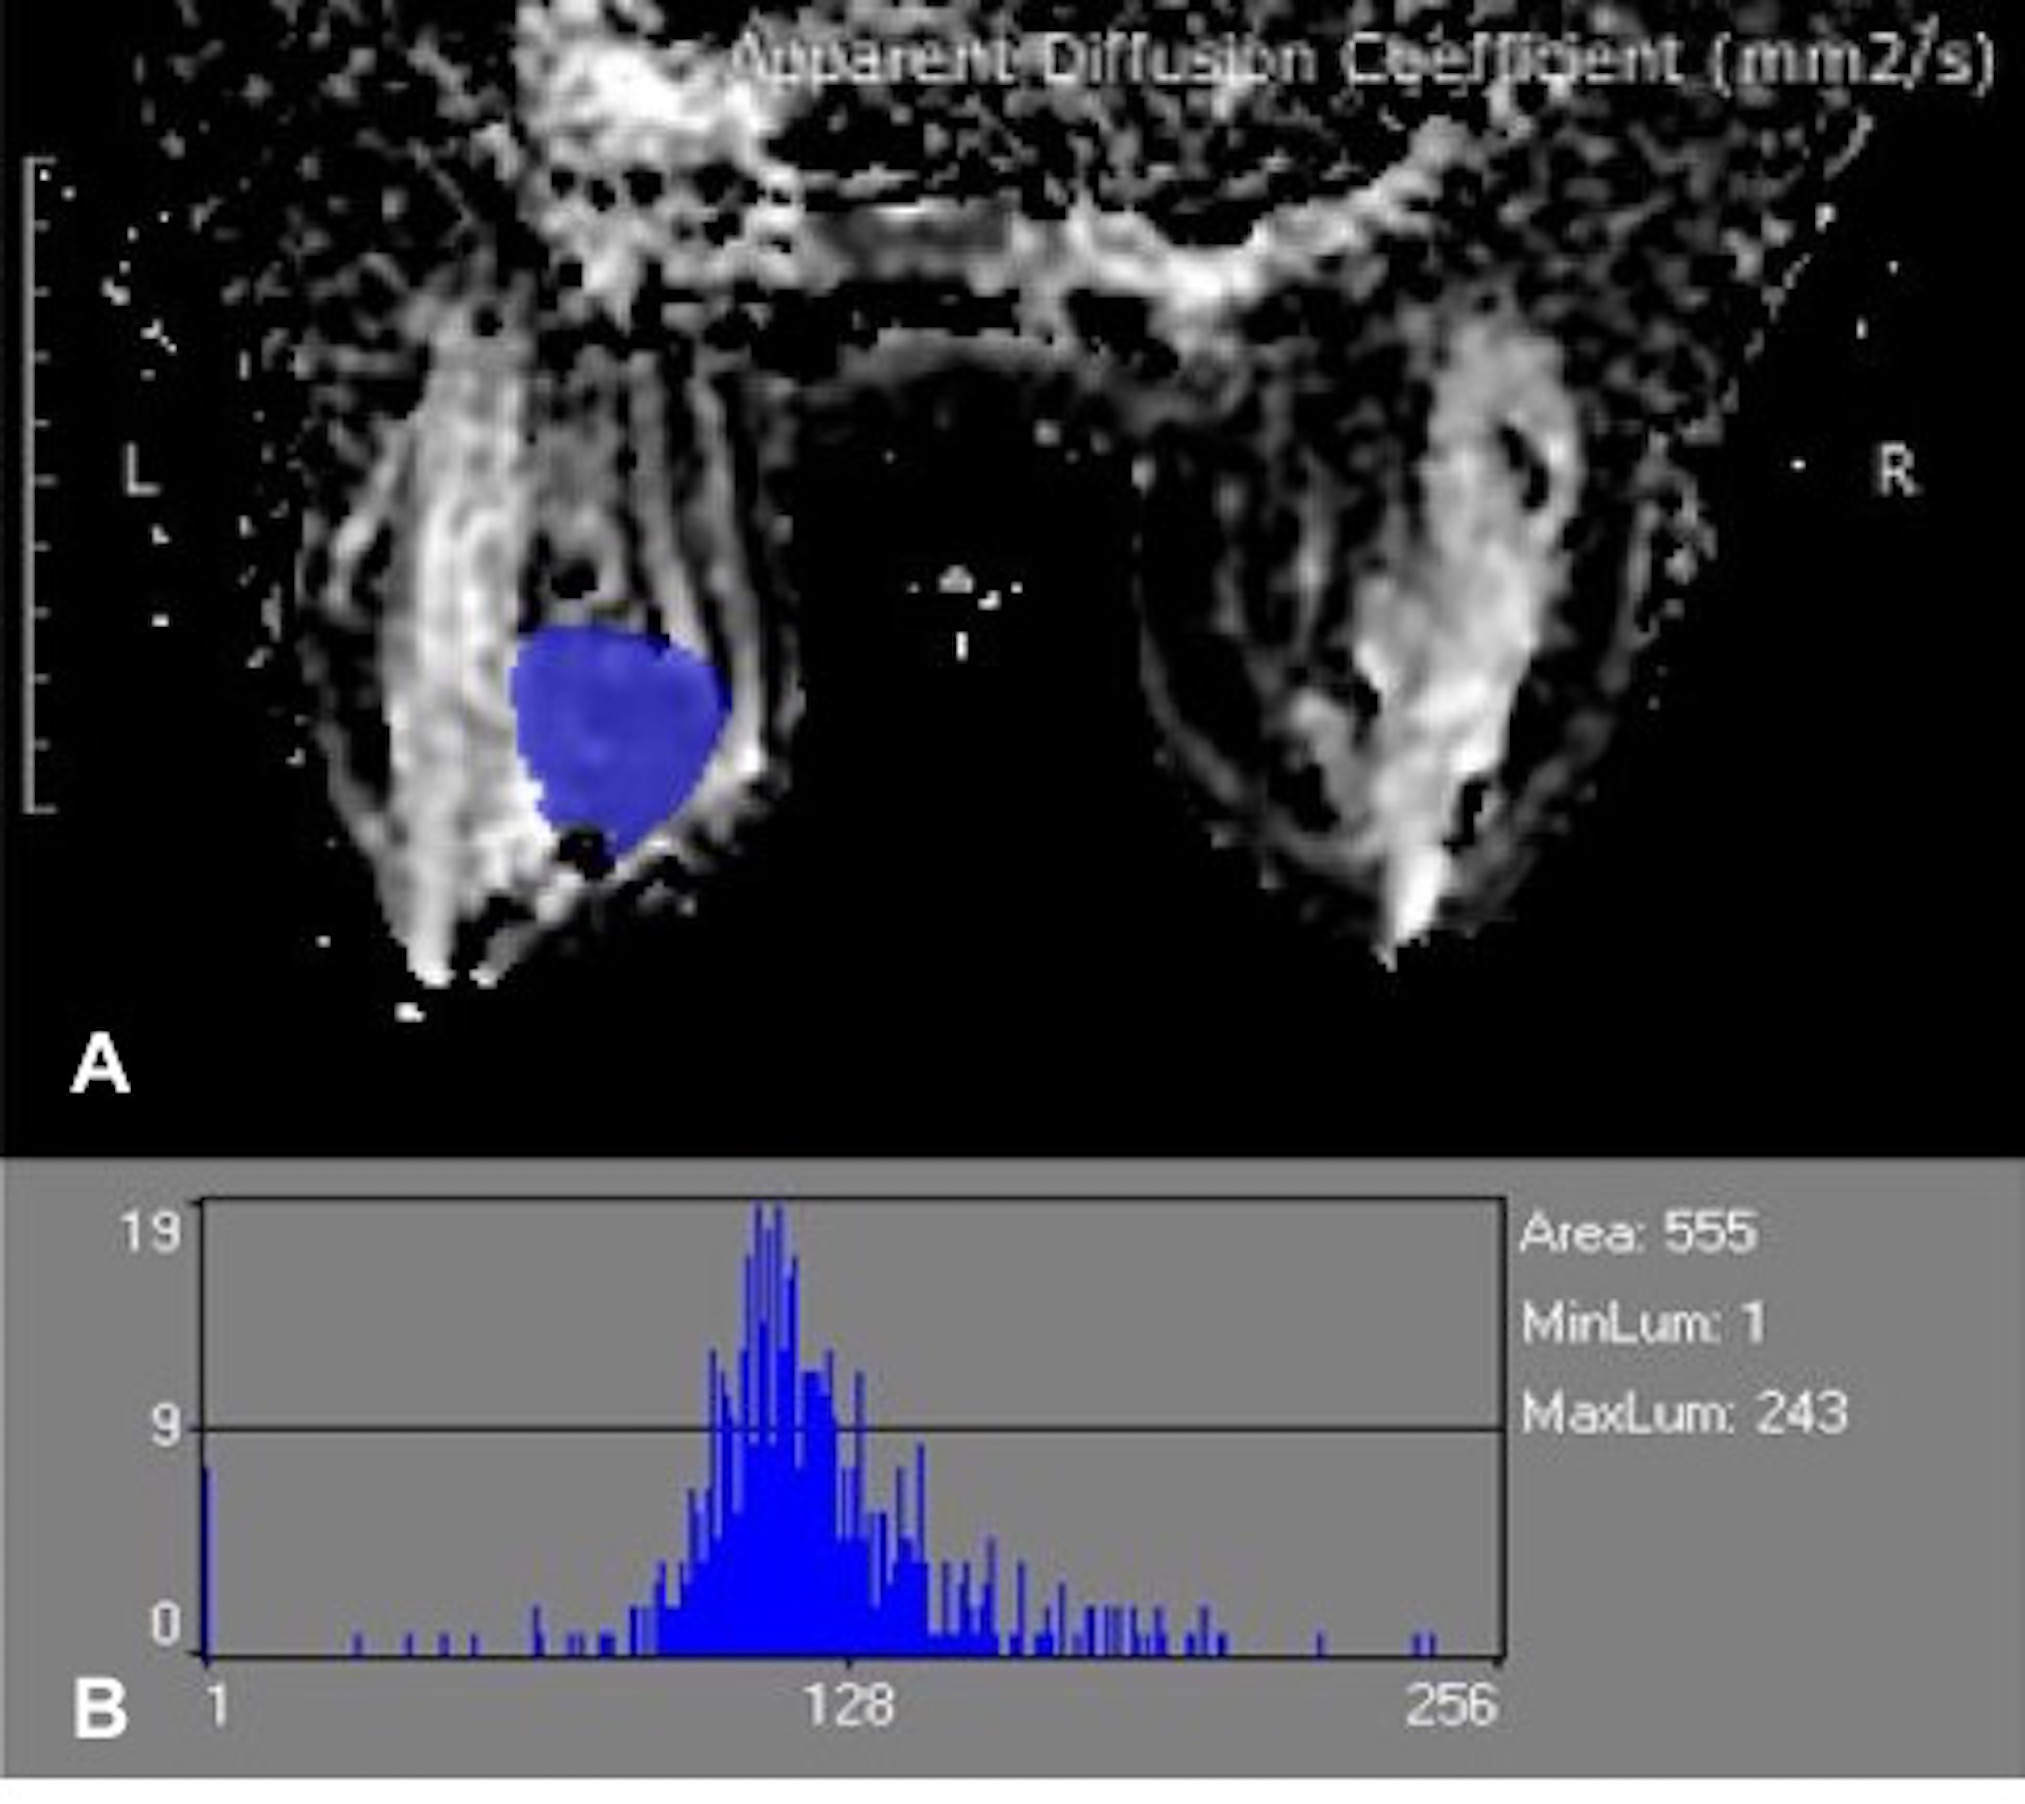
Forty-eight patients (average age 45±1.4 years, age range 20-62 years) with phyllodes tumors of breast were recruited in this study. They were examined on 3.0T GE Discovery 750 with 8 channel bilateral breast coil. Axial plane DWI data was acquired for 1 minute 16 seconds using single-shot spin-echo pulse sequence (TR/TE- 3600 s/minimum, thickness 4mm, space 1mm, Matrix-128×128, FOV-320mm×224mm, b-values 0, 800s/mm2, NEX 6). Breast lesions were divided into benign group (n=30) and malignant group (n=18) according to their pathological characteristics. The ADC maps were automatically generated after scan and were transported to the software MaZda (MaZda 4.6, The Technical University of Lodz, Institute of Electronics, http://www.eletel.p.lodz.pl/programy/mazda/index.php?action=mazda_46) for further post-processing. MaZda is an effective tool for texture analysis and offers an approach for texture feature extraction, selection and reduction [3]. In MaZda, regions of interest with arbitrary shapes, as shown in Fig. 1A and Fig.2A, were drawn on the middle section of lesion by radiologist with over 5 years of experience in the diagnosis of breast lesions. The histogram-based features included mean, 0.1th, 10th, 50th, 90th, and 99th percentiles of ADC, skewness, and kurtosis were calculated. 10th, 99th percentiles and kurtosis of ADC of malignant and benign lesions were compared by the Mann-Whitney U tests. And other parameters were analyzed by student t test. P<0.01 was considered significant. Receiver operation curve (ROC) analysis was performed in the parameters which were significant difference to assess the sensitivity and specificity in the diagnosis of breast lesions.Results
The values of ADC mean, 50th, 90th, and 99th percentiles of ADC, skewness showed significantly differences among the two groups. The ROC analysis between benign group and malignant group showed that the 90th percentile ADC achieved the highest area under curve (AUC) at 0.813. In addition, the current results showed that the sensitivity /specificity of these five parameters in the diagnosis of malignant were 80.0% /61.1%, 80.0%/61.1%, 66.7%/83.3%, 66.7%/66.7% and 72.2%/73.3%. (Shown in Table 1) Figure 1 and 2 showed the ROI and histogram distribution of two typical patients.Discussion
Conclusion
In conclusion, the results that ADC histogram parameters between benign and malignant groups were significantly different suggested these parameters can use as an efficient biomarker in grading of breast phyllodes tumors. The histogram-based features will become a great potential tool for clinical diagnosis and treatment in breast phyllodes tumors.Acknowledgements
No acknowledgement found.References
[1] FA Tavassoli,P Devilee,World Health Organization classification of tumors: Pathology and genetics of tumors of the breast and female genital organs.Lyon:IARC Press,2003:103-107.
[2] Tan PH , Thike AA, Tan WJ, Thu MM, Busmanis= I, Li H, Chay WY, Tan MH; The Phyllodes Tumour Network Singapore. Predicting clinical behaviour of breast phyllodes tumours: a nomogram based on histological criteria and surgical margins. J Clin Pathol. 2011.
[3] Szczypinski PM, Strzelecki M, Materka A, Klepaczko A. MaZda–a software package for image texture analysis. Comput Methods Programs Biomed. 2009;94(1):66–76.
Figures