2428
New frontiers: the role of Arterial Spin Labeling (ASL) and Diffusion Tensor Imaging (DTI) to differentiate between malignant and benign breast lesions.1Radio-diagnosis, Institute of Nuclear Medicine and Allied Sciences (INMAS), Delhi, India
Synopsis
There was the time when contrast enhancement was critical to identify and differentiate malignant from benign tumor, but as the field of MR has made strides towards advanced imaging, we now can use the methods which doesn't require contrast. It is especially helpful in end stage renal patients. As the world demographic is slowly tilting towards geriatric population it will soon become essential to come up with alternative ways to detect the malignant pathologies independent of exogenous contrast. In our study we have demonstrated by plotting the ROC curve that ASL and DTI are promising methods to detect breast cancer.
Purpose
Diffusion tensor imaging picks up the architectural distortions. Arterial spin labeling give perfusion maps by utilizing the water as a contrast medium itself. Both of these techniques do not require contrast therefore clinically significant where contrast is contraindicated e.g. renal diseases. As the world's demographic trend is shifting towards the geriatric population, therefore it is critical that we come up with alternative to contrast methods. As the old age is risk factor for renal disease and also for cancer.
ASL have been used to differentiate the grades of glioma and proved as successful as the dynamic susceptibility weighted contrast MRI (1). ASL has also been tried in breast cancer characterization by Kawashima et al by comparing it with CT perfusion and contrast MR perfusion(2). Diffusion tensor imaging have been shown to be of value to detect breast cancer as in cancer the diffusion anisotropy is lower compared to benign lesions (3,4,5,6,7). But none of the study yet has plotted ROC curve to give sensitivity and specificity of ASL in differentiating breast cancer from benign breast lesions. Also these two methods were never combined together to give combined sensitivity to differentiate breast cancer from benign breast lesions without using an exogenous contrast agent.
Methods and Materials
44 women with breast lesion detected on mammography, USG or MR underwent advanced MR imaging. DTI was performed at 3Telsa (Skyra Siemens) in 12 directions using a diffusion-weighted echo planar sequence. 2D ASL (Arterial Spin Labelling) protocol was modified with TI of 1800ms and TR of 4000. Analysis of DTI and ASL data was done by dedicated post processing team using MATLAB-2017a, FSL and ASL 2.0 toolbox.(8,9) Taking histopathology as Gold Standard, ROC curves were plotted.Results
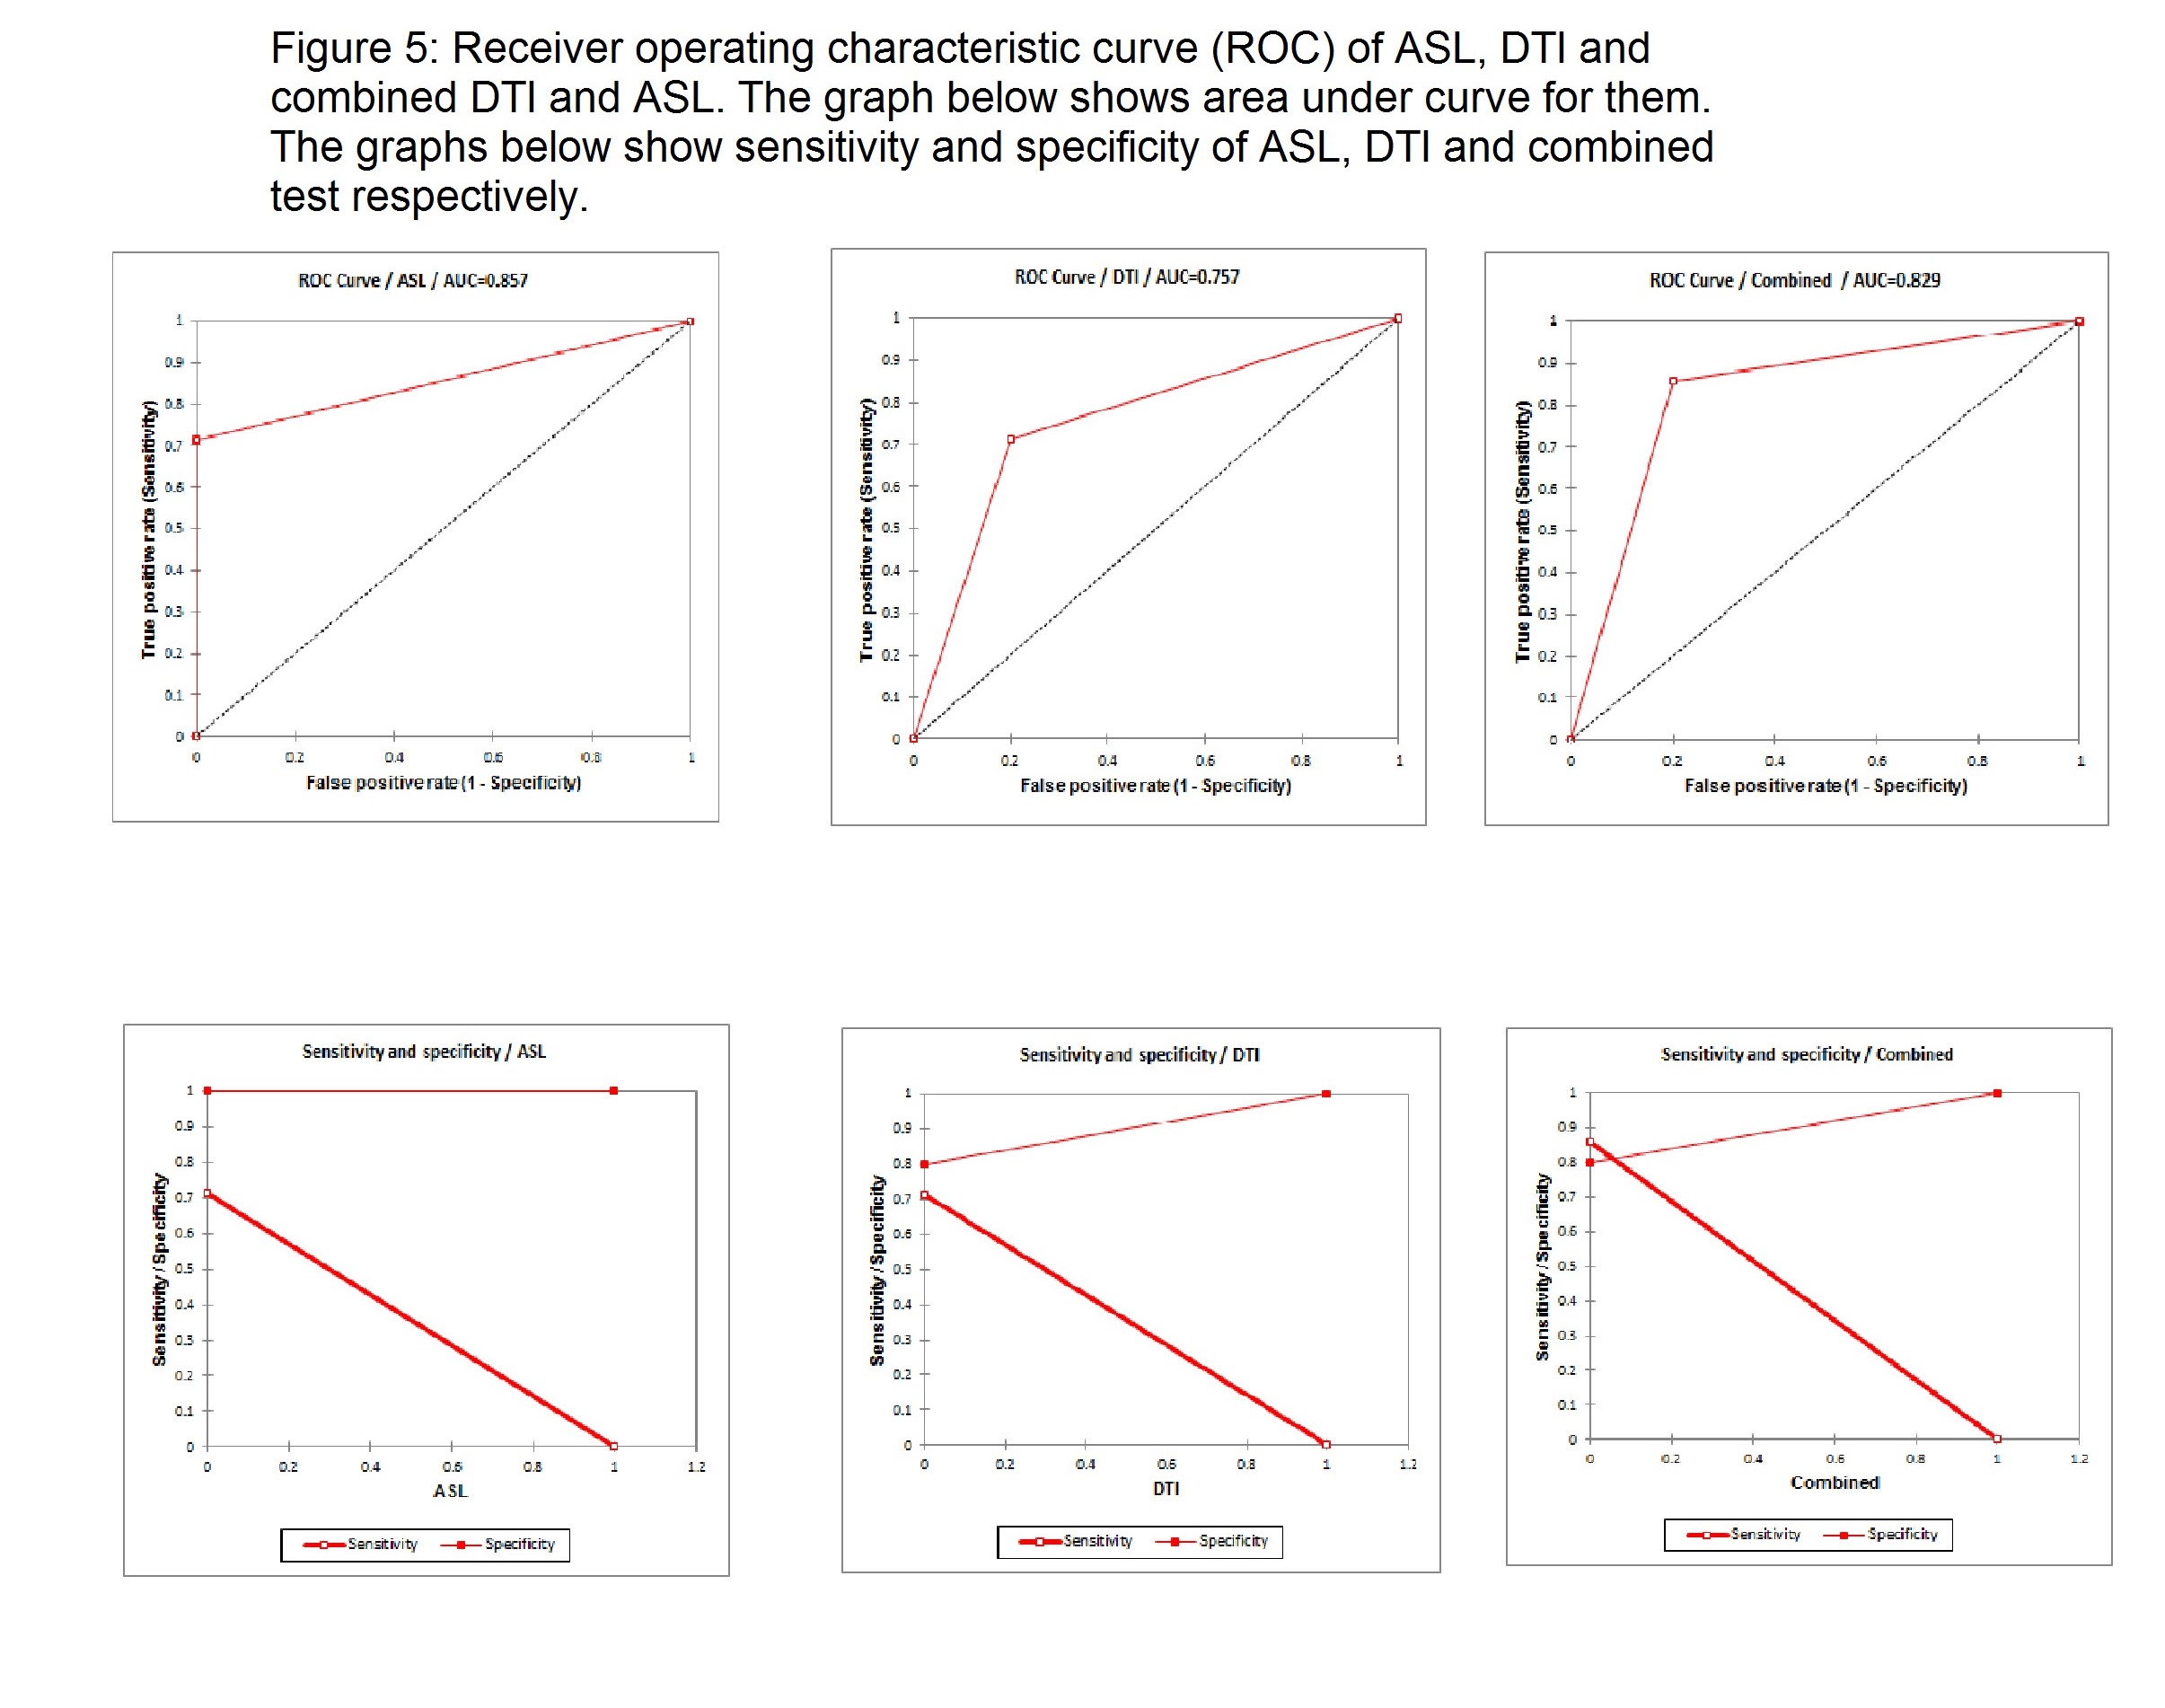
Total of 44 lesions were detected on MRI. ROC curve showed ASL has 72% sensitivity, 89.5% specificity, 79.5% accuracy, 10% FPR. The blood flow to the malignant lesions was significantly higher (350 ml/100gm tissue/sec, SD: 100ml) compared to benign lesions (150ml/100gm tissue/sec, SD: 90ml) (p value<0.05). ROC curve for DTI showed 80% sensitivity, 78% specificity, 79% accuracy, 21 % FPR. Combined DTI and ASL had increased sensitivity of 84%.Conclusion
This study demonstrates advanced MR imaging using ASL and DTI has good specificity for differentiating breast cancer from benign lesions. With ASL quantification of blood flow to malignant and benign lesion is possible. The sensitivity of combined ASL and DTI method is better that the sensitivity of both independently.Acknowledgements
Ze Wang who helped in learning the ASL analysis, he is affiliated with the center for Functional Neuroimaging and Department of Neurology, University of Pennsylvania, School of Medicine, Philadelphia.References
- Warmuth C, Gunther M, Zimmer C. Quantification of blood flow in brain tumors: comparison of arterial spin labeling and dynamic susceptibility-weighted contrast-enhanced MR imaging. Radiology. 2003 Aug;228(2):523-32.
- Kawashima M, Katada Y, Shukuya T, Kojima M, Nozaki M. MR perfusion imaging using the arterial spin labeling technique for breast cancer. Journal of Magnetic Resonance Imaging. 2012 Feb 1;35(2):436-40.
- Partridge SC, Ziadloo A, Murthy R, et al. Diffusion tensor MRI: preliminary anisotropy measures and mapping of breast tumors. J Magn Reson Imaging 2010;31:339–347.
- Partridge SC, Murthy RS, Ziadloo A, et al. Diffusion tensor magnetic resonance imaging of the normal breast. Magn Reson Imaging 2010; 28:320–328. 67.
- Yamaguchi K, Nakazono T, Egashira R, et al. Diagnostic performance of diffusion tensor imaging with readout-segmented echo-planar imaging for invasive breast cancer: correlation of ADC and FA with pathological prognostic markers. Magn Reson Med 2016;Sci.
- Baltzer PAT, Schafer A, Dietzel M, et al. Diffusion tensor magnetic res- € onance imaging of the breast: a pilot study. Eur Radiol 2011;21:1–10.
- Jiang R, Ma Z, Dong H, et al. Diffusion tensor imaging of breast lesions: evaluation of apparent diffusion coefficient and fractional anisotropy and tissue cellularity. Br J Radiol 2016;89:20160076.
- Ze Wang, Geoffrey Aguirre, Hengyi Rao, JiongJiong Wang, Anna R. Childress, John A. Detre, Empirical ASL data analysis using an ASL data processing toolbox: ASLtbx, Magnetic Resonance Imaging, 2008, 26(2):261-9.
- Ze Wang, Improving cerebral blood flow quantification for arterial spin labeled perfusion MRI by removing residual motion artifacts and global signal fluctuations, Magnetic Resonance Imaging, 2012 (in press). http://dx.doi.org/10.1016/j.mri.2012.05.004.
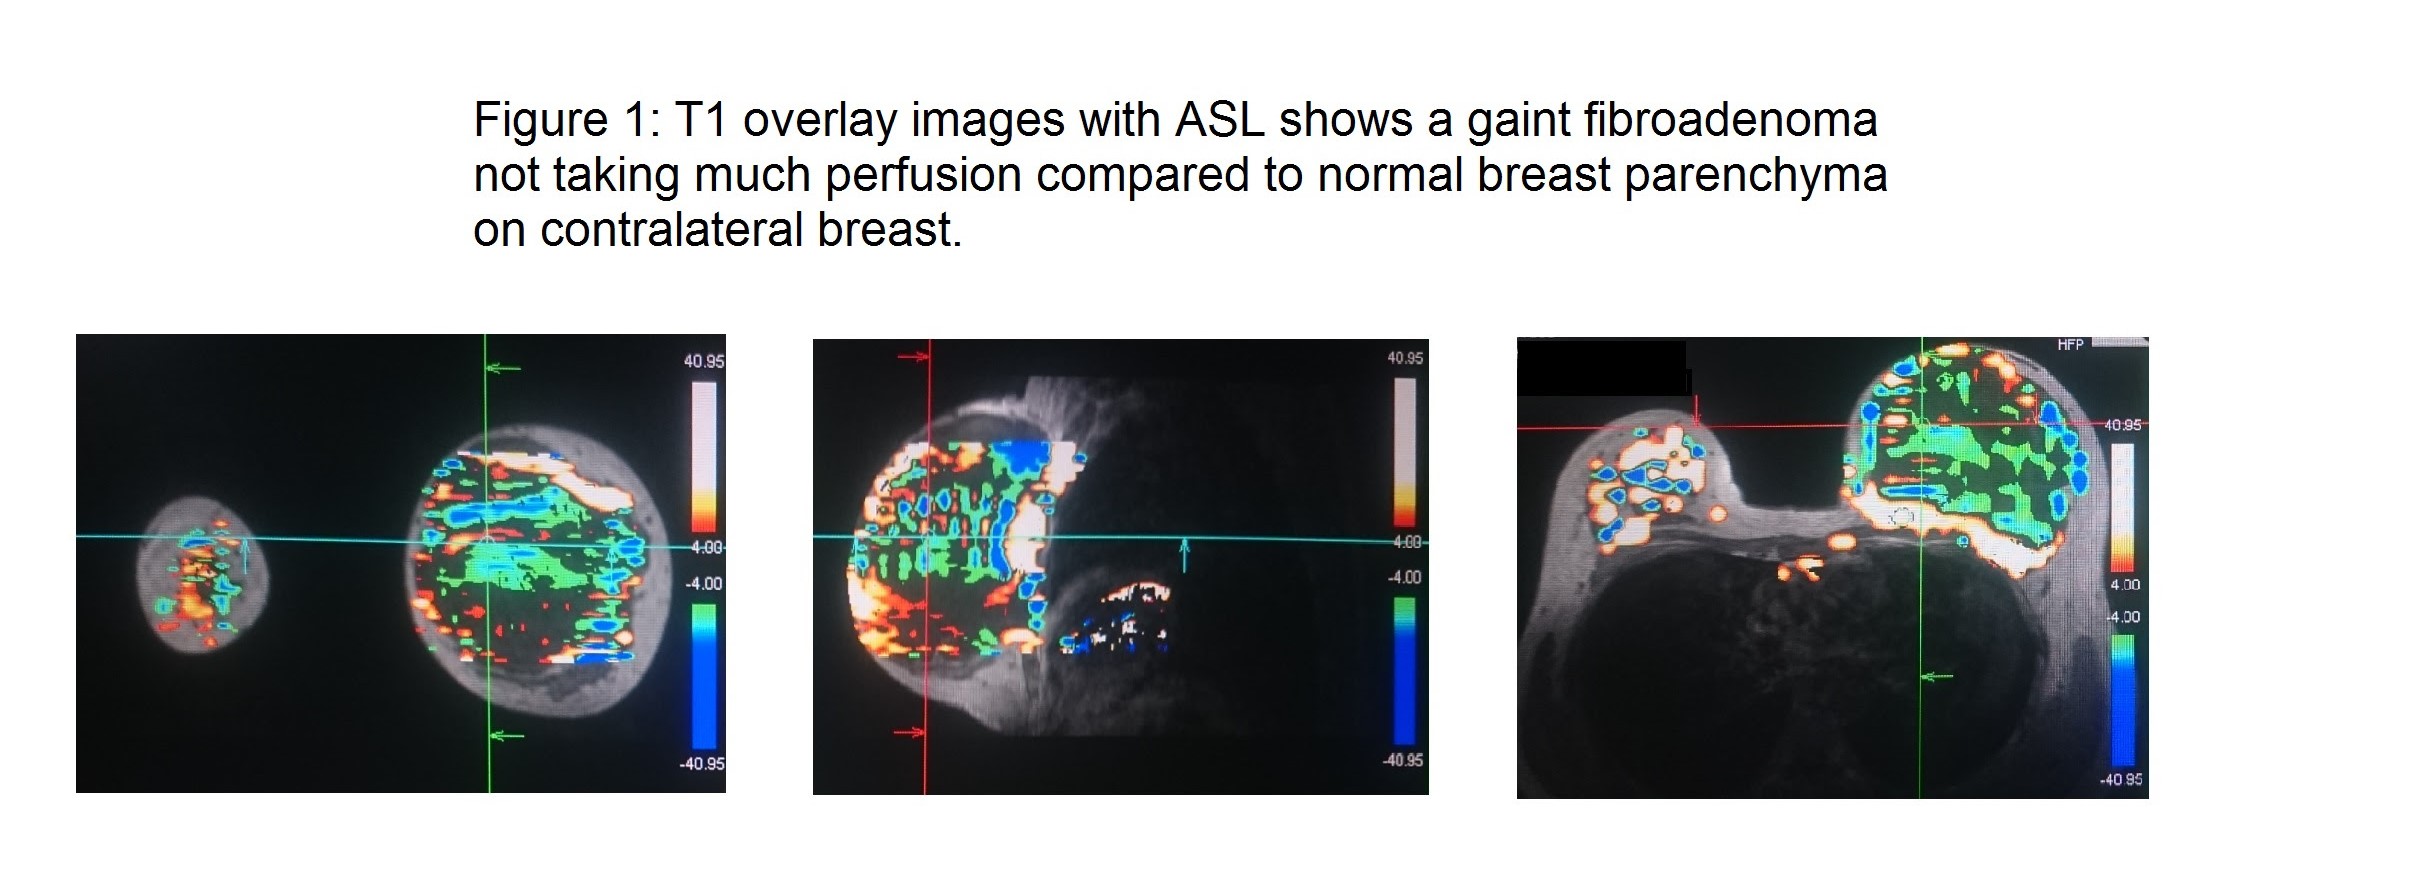
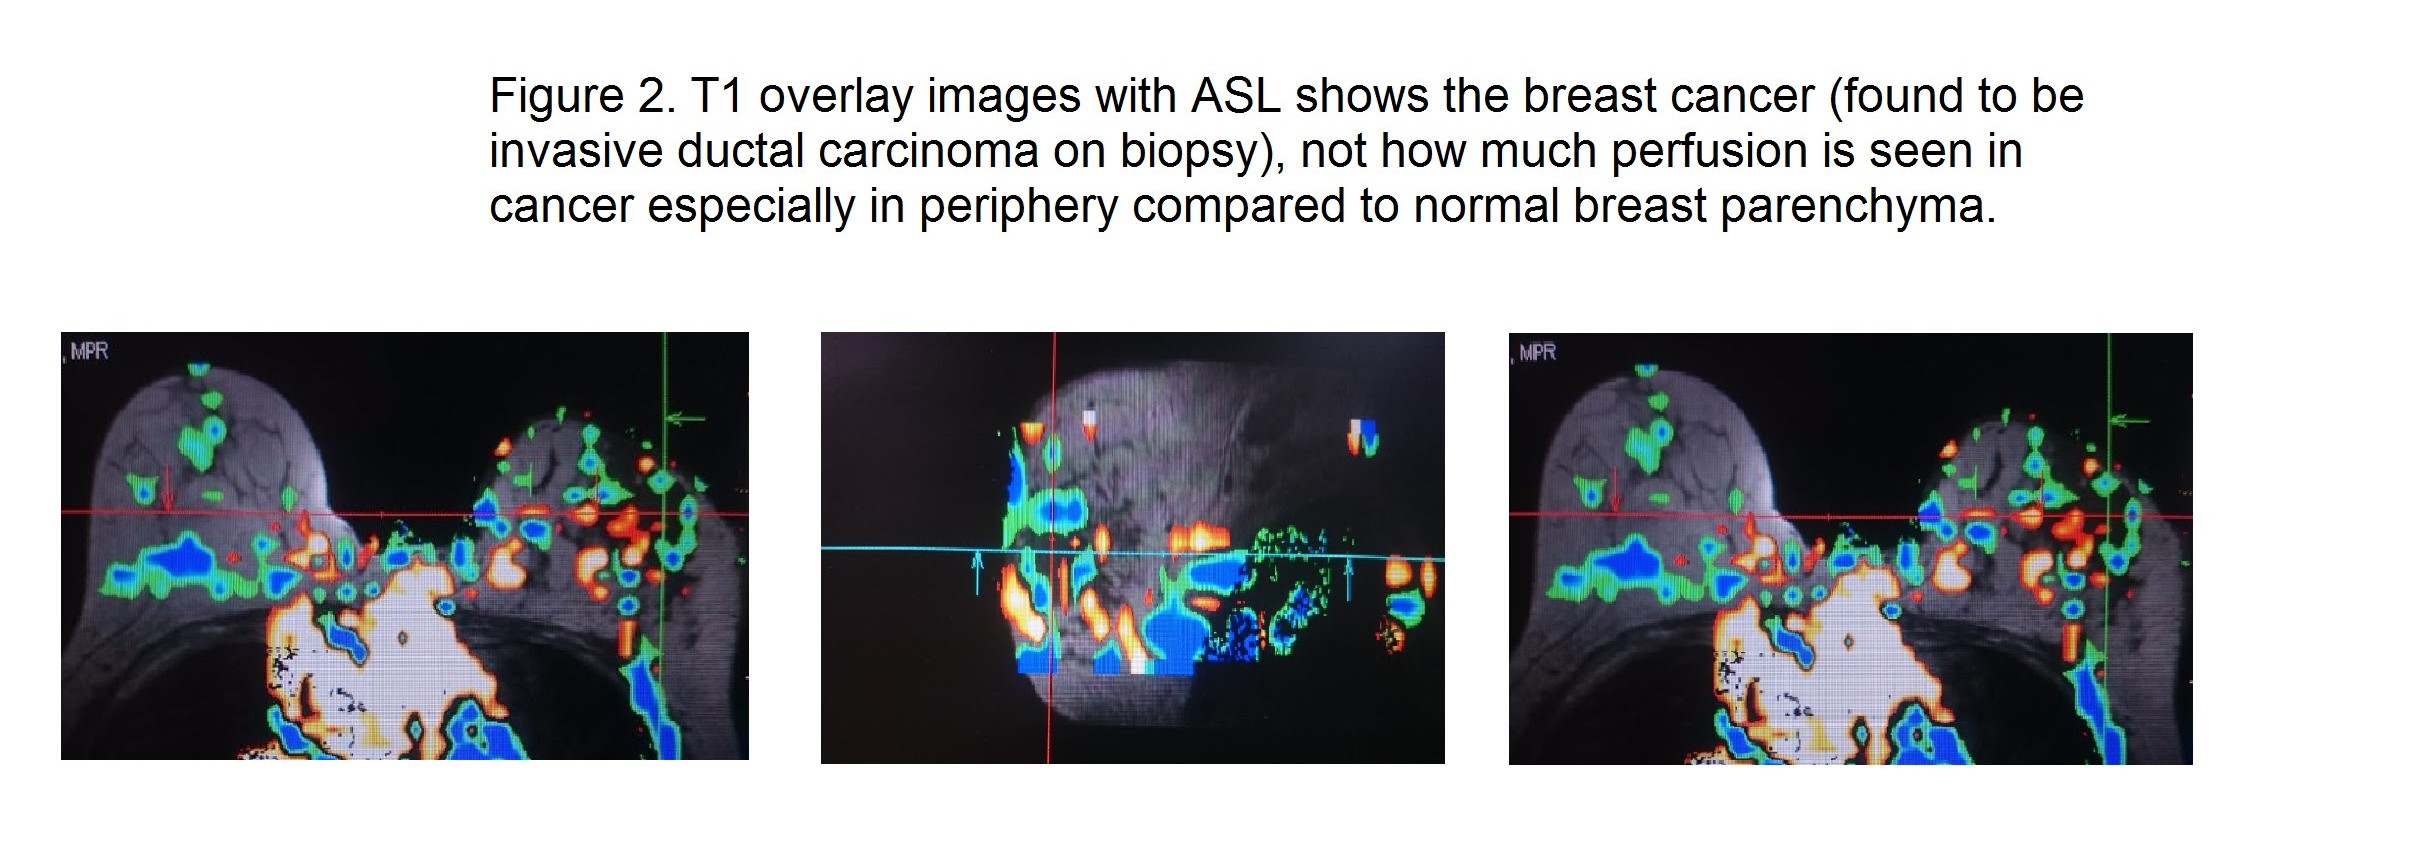
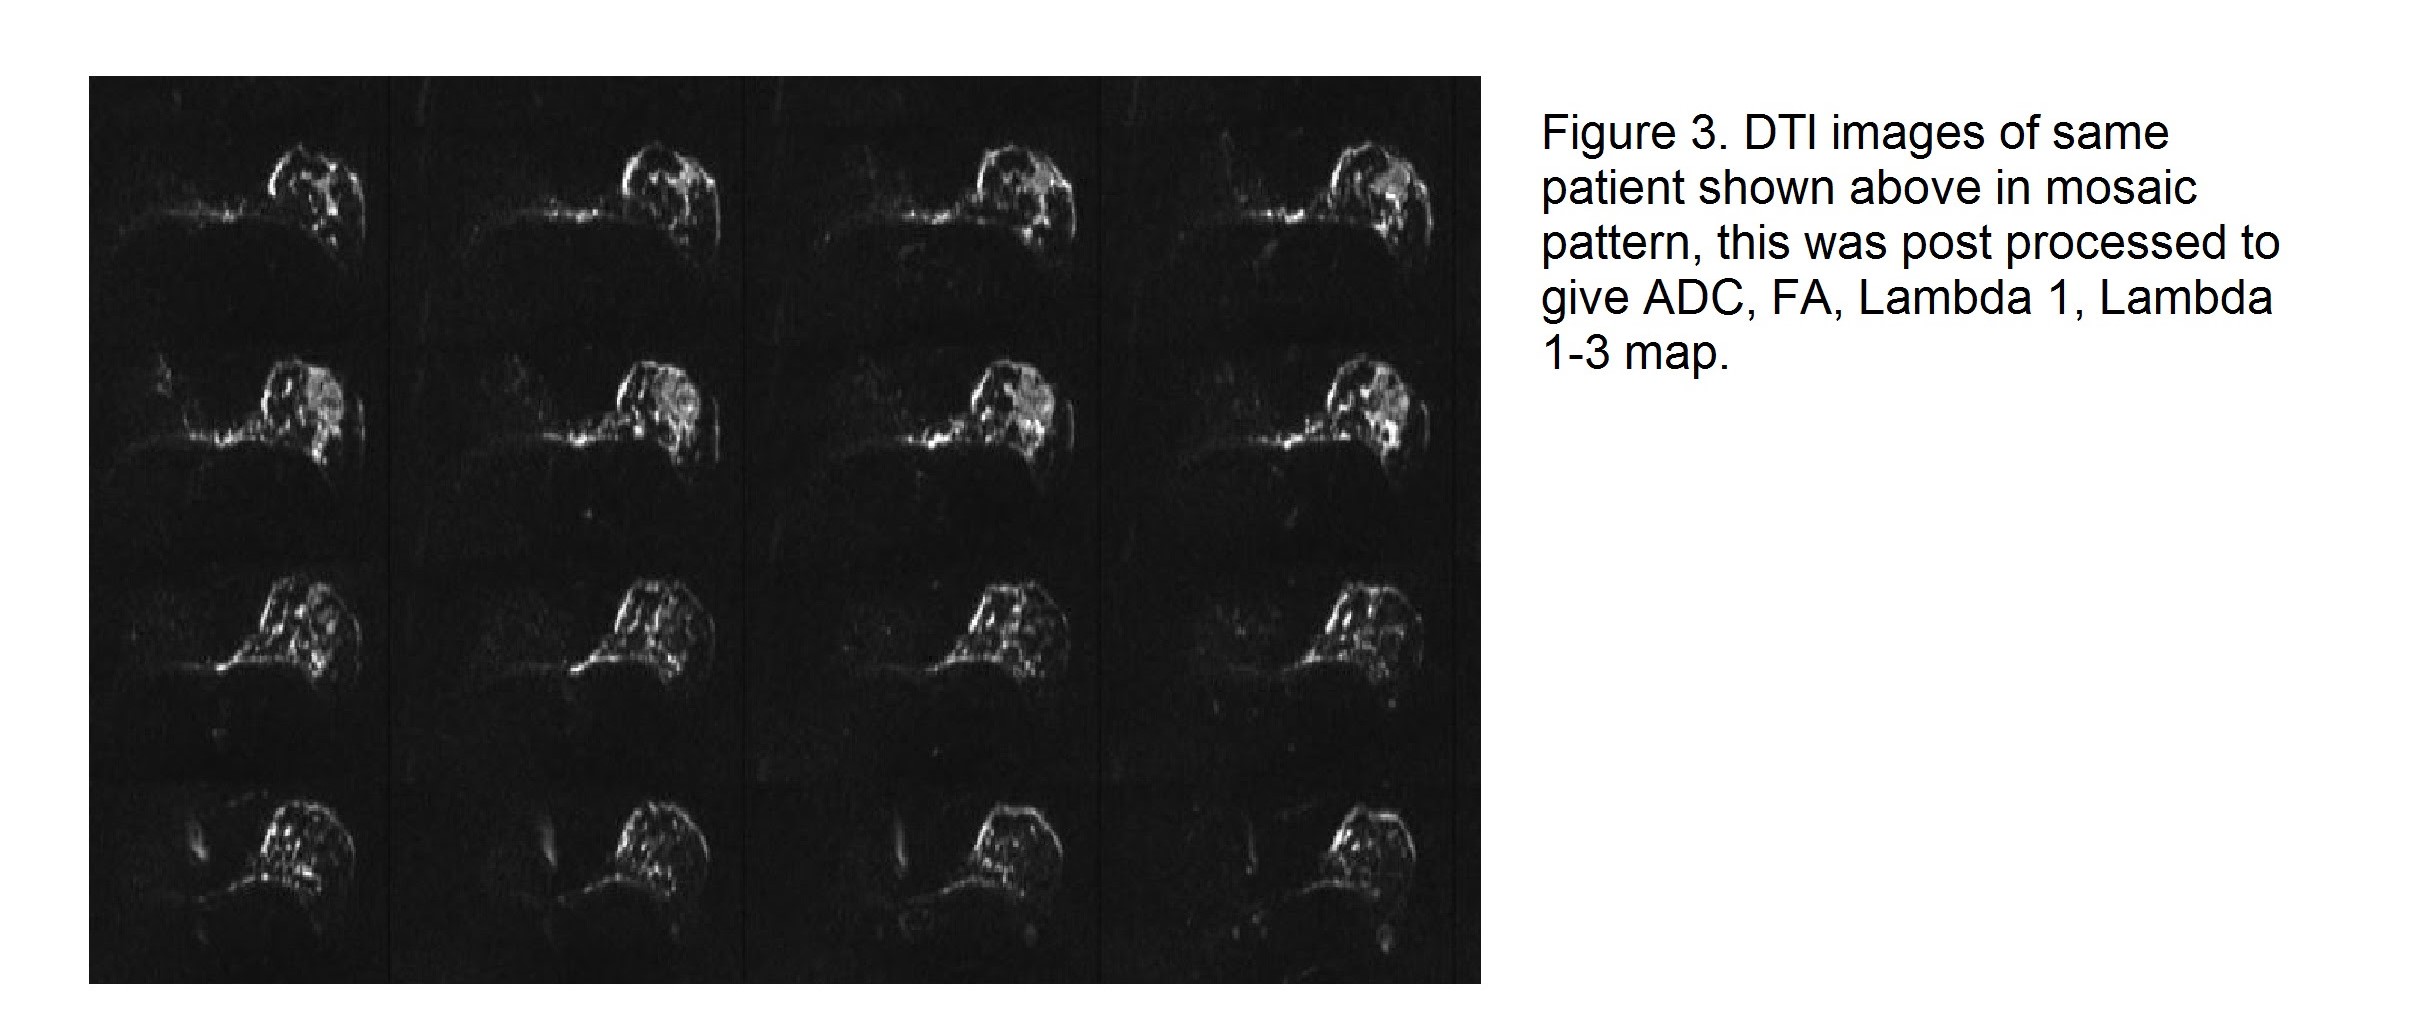
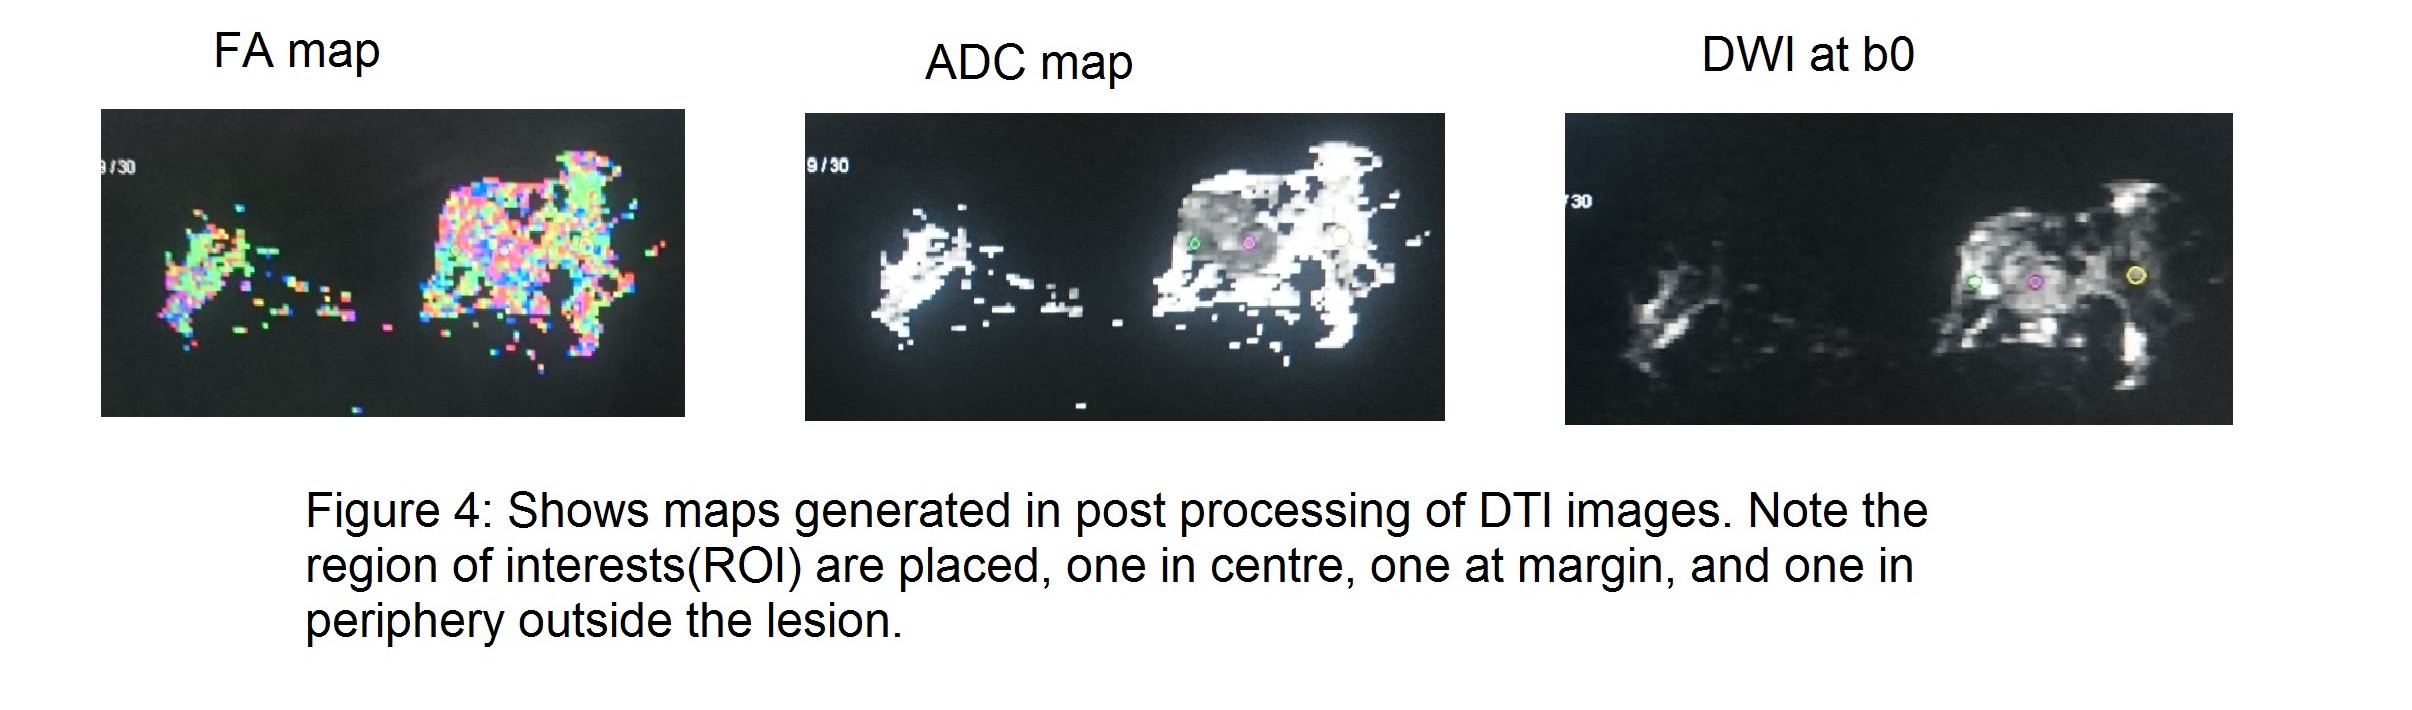
Figures