2422
Radiomic analysis of breast can distinguish benign phyllodes tumors from fibroadenomas1Radiology, The First affiliated hospital of Dalian Medical University, Dalian, China, 2Life science, GE Healthcare, Shenyang, China, 3GE healthcare, Beijing, China
Synopsis
The distinction between phyllodes tumor of breast (PTB) and fibroadenoma(FA) is clinically important, as approximately 20-30% of resected PTBs are malignant. Only limited information on the MRI characteristics of PTB is available. This study was performed to compare the MRI features (radiomics) of PTBs and FAs, which may resemble each other on conventional MRI.
Target audience
Clinicians, radiologists and Scientists who are interested in personalized, precision medicine of breast tumors.Purpose
To assess the feasibility of distinguishing benign PTBs from FAs using MRI features (radiomics).Methods
MRI (1.5T) from 64 female patients with pathological diagnosed benign PTBs (N=28) and FAs (N=36), were retrospectively analyzed. The apparent diffusion coefficient (ADC) maps(b=0, 700s/mm2), obtained by diffusion-weighted imaging (DWI) acquisitions, were analyzed through 66 radiomic features on O.K. software (Omni Kinetics, GE Healthcare, China), including three sub-groups, intensity-based (first order statistics, FOS) and texture (gray level co-occurrence matrix, GLCM; and gray level run length matrix, GLRLM) features. Feature selection (sequential forward floating search) and classification (k-nearest neighbor classifier) were performed to distinguish PTBs from FAs. Classification was performed using the three different sub-groups of features separately as well as all the features together. The parameters were compared between PTBs and FAs, the diagnostic performance based on different parameters was quantified with ROC curve.Results
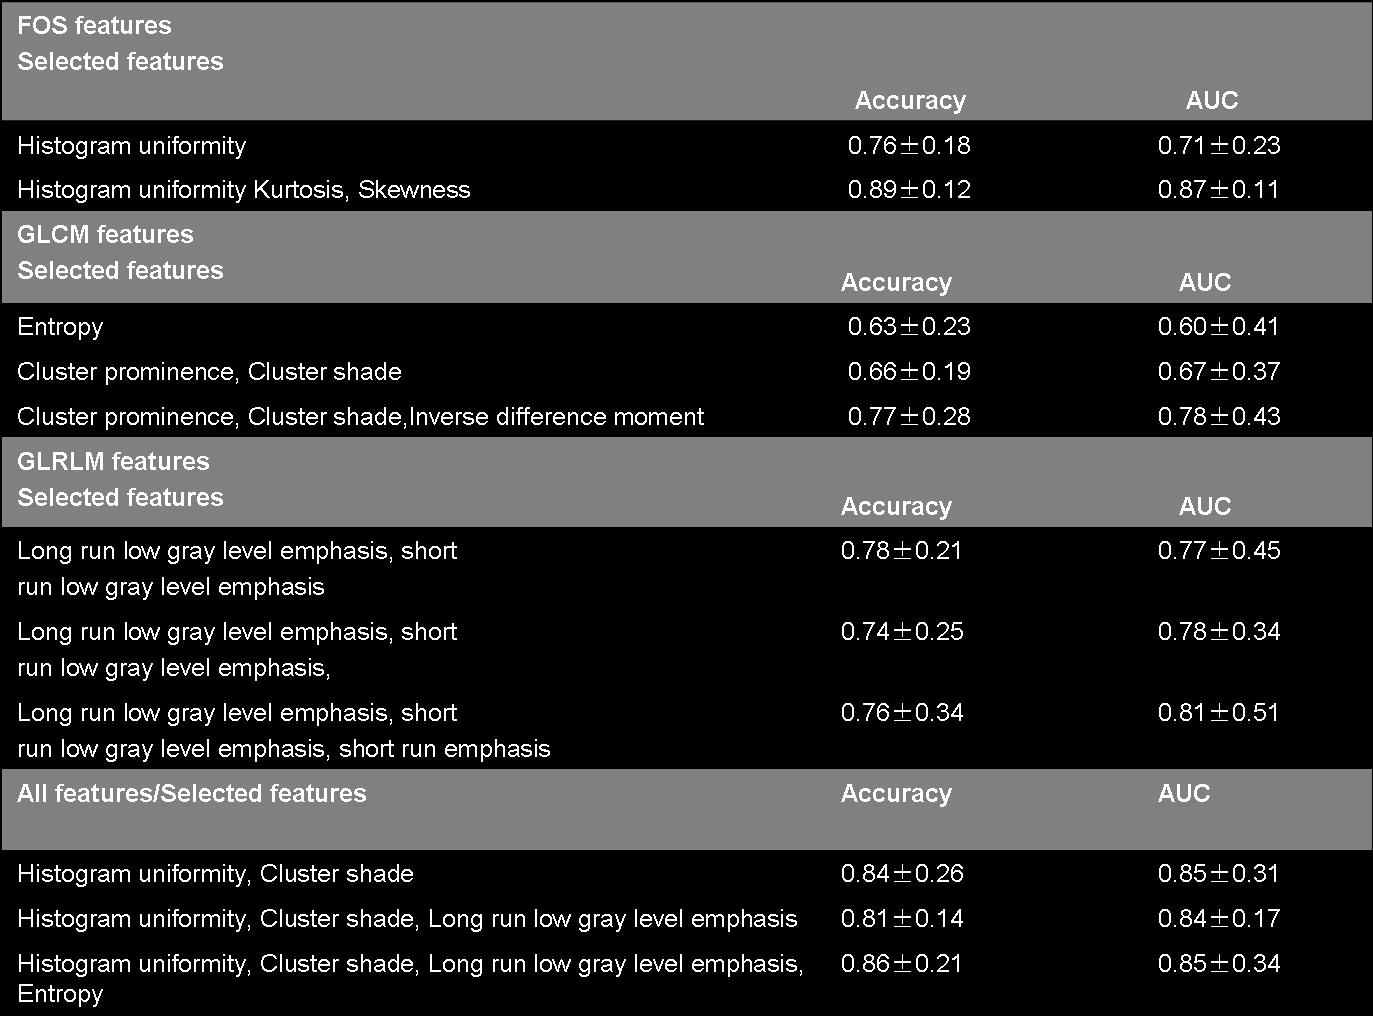
FA lesions had a higher and less disperse ADC values compared with PTB ones: most of FOS related to intensity are higher for the FAs, while FOS related to signal variability were higher in the PTBs (e.g. the feature Kurtosis is 2.37±0.31 versus 4.24±0.43, P=0.003) (Fig1). The GLCM features related to cluster shade was higher in the PTBs and inverse difference moment (IDM) was higher in the FAs. When performing classification, the best accuracy is obtained with a maximum of three features for each subgroup, FOS features being those leading to the best classification (accuracy 0.89±0.12, AUC 0.87±0.11) (Tab1).Discussion and Conclusion
In the present study, signal intensity/time curve assessment or the enhancement pattern on MRI was not significantly capable of differentiating between PTBs and FAs[1,2]. There are only a few reports regarding the differentiation between benign PTBs and FAs on DWI. No significant difference of ADC value was found between these two benign breast tumors[2]. Radiomics has applied to oncology recently[3,4]. The feature kurtosis implies the reverse, that the mass of the distribution is concentrated towards a spike the mean. Cluster shade was a measure of the skewness and uniformity of the GLCM. A higher cluster shade implies greater asymmetry. In this study, the capability of radiomic features to characterize and/or differentiate PTBs and FAs was assessed. Good accuracy and AUC could be obtained using only few Radiomic features, belonging to the FOS class.Acknowledgements
This work has not received any funding.References
[1] Duman L, Gezer NS, Balci P, et al. Differentiation between phyllodes tumors and fibroadenomas based on mammographic sonographic and MRI features. Breast Care (Basel). 2016, 11(2): 123-7.
[2] Kamitani T, Matsuo Y, Yabuuchi H, et al. Differentiation between benign phyllodes tumors and fibroadenomas of the breast on MR imaging. Eur J Radiol. 2014, 83(8): 1344-9.
[3] Sun K, Chai W, Fu C, et al. Diffusion-Weighted Imaging-guided MR Spectroscopy in Breast Lesions using Readout-Segmented Echo-Planar Imaging. Eur Radiol. 2016, 26(6):1565-74.
[4] Kim EJ, Kim SH, Park GE,et al. Histogram analysis of apparent diffusion coefficient at 3.0t: Correlation with prognostic factors and subtypes of invasive ductal carcinoma. J Magn Reson Imaging. 2015, 42(6):1666-78.
Figures
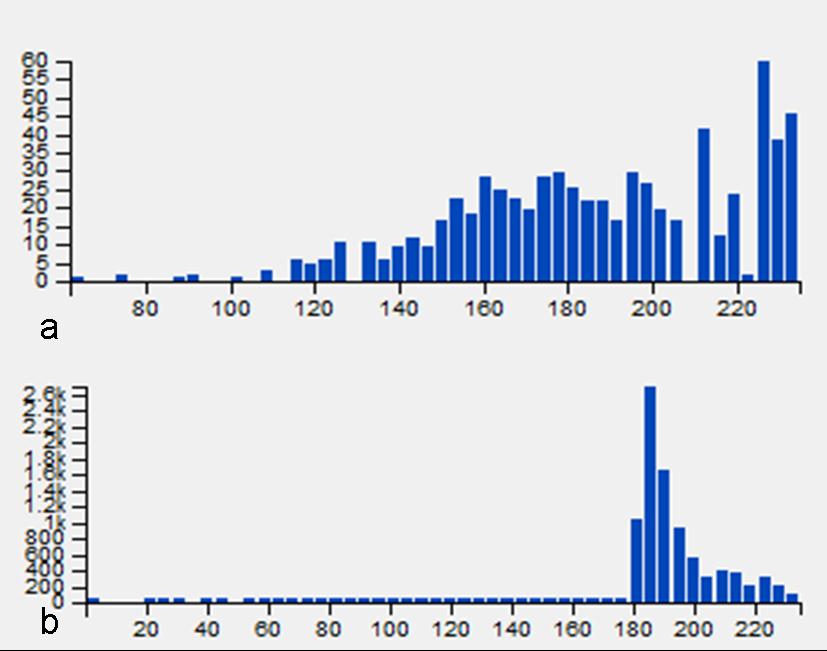
Fig 1 a Radiomics Features of ADC (FA lesion): Skwness=-0.463, Kurtosis=2.851, IDM=0.418, Cluster shade=4.377, Minintensity=219, Maxintensity=960, Medianintensity=567.27;
b Radiomics Features of ADC (PTB lesion): Skwness=-3.892, Kurtosis=3.765, IDM=0.371, Cluster shade=-100.874, Minintensity=82, Maxintensity=330, Medianintensity=263.04.