2421
T2 star for breast invasive ductal carcinoma histopathological grade1Department of Radiology, Jiangxi Cancer Hospital, Nanchang, China, 2Philips Healthcare, Beijing, Beijing, China
Synopsis
Chemical shift encoded MRI (CSE-MRI) utilizes the water-fat signal model method, and its corresponding T2*mapping has less artifacts from water-fat shift. We extracted the fat-influence-free T2* to investigate the correlation between T2 * mapping and histological grading of breast invasive ductal carcinoma, and found T2 * value for IDC-3 significantly higher than in IDC-2. This finds may provide more understanding of invasive ductal carcinoma microstructure and metabolism.
Purpose
Chemical shift encoded MRI (CSE-MRI)(1、2)is a fast, low flip angle excitations 3D imaging method, which uses multi-echo scanning and multiple fat peaks modeling (with T2 star) for quantitative water-fat separation. Water(W), fat(F) and proton density fat fraction(PDFF, also refer as FF) images are calculated, also R2 star (T2 star) effect is considered in the multi-echo signal model. In 1990, Ogawa et al(3)firstly uncovered the mechanism of BOLD-MR in rat brain and found that the highly deoxygenated blood in the brain produced highly BOLD contrast, and high R2* value represents low oxygen consumption in the tissue. Studies found that the T2 * also reflects tissue iron deposition, new metabolism, tissue hypoxia and cell edema(4.7).It is known that hypoxia can reduce the sensitivity of chemotherapy and radiotherapy(5.6). Hence T2* mapping helps identify the degree of malignancy and guide the treatment of cancer (7).
Invasive ductal carcinoma is the most common malignant breast tumor. The degree of cell edema, which directly impacts T2*, is also related to the histological grade of breast invasive ductalcarcinoma. However, challenges were found in regular T2* calculation with multiple gradient echoes sequence images due to mixed effect from fat chemical shift and its longer T2 star. Herein, we used CSE-MRI scan to calculate T2* mapping in patients confirmed with breast invasive ductal carcinoma, and investigated the correlation between T2 * value and the histological grade of invasive ductal carcinoma of the breast.
Methods
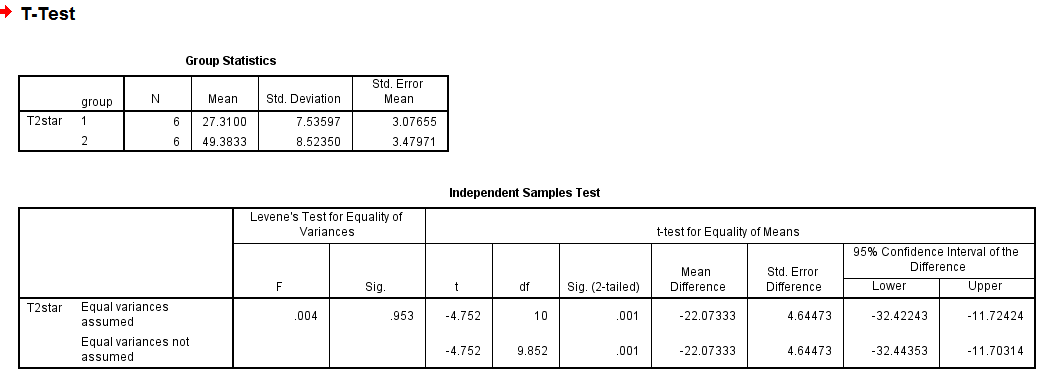
Images from twelve female patients with pathologically confirmed breast invasive ductal carcinoma(IDC), of which 6 cases are IDC-2 and 6 cases are IDC-3, were collected retrospectively. Patients were scanned with mDIXON quant protocol (CSE-MRI implementation) on a 3.0T MRI unit (Ingenia, Philips Healthcare, Best, the Netherlands). CSE-MRI were set as:TR, 7.1 ms; 6echos with delta TE 0.7ms with TE1 1.01ms; FOV 340×300×180 mm; FA=3; resolution=2.5×2.5×3.0mm and acceleration factor SENSE=2. Region of interest(ROI) were drawn based on CSE-MRI outputs (W, F, PDFF) also T1W and T2W images. T2* was measured at the target region with the fatty tissue excluded using fat fraction threshold (25%)(8), and analyzed statistically.Results
T2* of target region for pathologically confirmed IDC-2 patients is 27.31±7.54ms; while it is 49.38±8.52ms for IDC-3 cases. With the test cases under this study, the result is statistically significant with the independent sample t test,p <0.05.Conclusion and Discussion
T2 * value measured with CSE-MRI for IDC-3 is higher than in IDC-2, which results from difference in the microstructure and chemical environment of breast invasive ductal carcinoma. In the malignant breast invasive ductal carcinoma, the normal duct cells are gradually replaced by pleomorphic tumor cells, and the proliferation of tumor cells makes the tissue metabolism faster, cellular hypoxia and edema severer, eventually leads to prolonged T2*. Some previous studies(9.10) showed shortened T2 * indicating severer hypoxia in more malignant tumors, and the BOLD-MRI study(11)concluded a strong correlation between prostate cancer’s hypoxia and high R2 * value,which are contradictory to our results. Different tumors may respond differently in T2 * mapping. In addition to that, our finding could result from the structural complexity and cell edema, overcoming the opposite effect of hypoxia.
This study shows that T2 * is associated with histological grade of breast invasive ductal carcinoma; and T2 * mapping may help to provide information about tumor microstructure. Only IDC-2 and IDC-3 cases were currently found retrospectively in this study, more clinical evidence are to be explored to validate the results in value of T2 * for diagnosing breast cancer.
Acknowledgements
No acknowledgement found.References
[1] .Kukuk, GM. et al., Comparison between modified Dixon MRI techniques, MR spectroscopic relaxometry, and different histologic quantification methods in the assessment of hepatic steatosis. European Radiology, 2015 Apr 23.
[2] .Kijowski, R., et al., Improved fat suppression using multipeak reconstruction for IDEAL chemical shift fat-water separation: Application with fast spin echo imaging. Journal of Magnetic Resonance Imaging, 2009. 29(2): p. 436-442.
[3] .Ogawa S, Lee TM, Kay AR, Tank DW.Brain magnetic resonance imaging with contrast dependent on blood oxygenation.Proc Natl Acad Sci U S A. 1990 Dec; 87(24):9868-72.
[4] .Huanzhou Yu ,Charles A. McKenzie.Multiecho Reconstruction for Simultaneous Water Fat Decomposition and T2* Estimation.JOURNAL OF MAGNETIC RESONANCE IMAGING ,2007.26:1153–1161.
[5] .Busk M, Horsman MR. Relevance of hypoxia in radiation oncology: pathophysiology, tumor biology and implications for treatment. Q J Nucl Med Mol Imaging. 2013;57:219–234.
[6] .Liu M, Guo X, Wang S, Jin M, Wang Y, Li J, et al. BOLD-MRI of breast invasive ductal carcinoma: correlation of R2* value and the expression of HIF-1α. Eur Radiol. 2013;23:3221–3327.
[7] .Seo M, Ryu JK, Jahng GH, Sohn YM.Estimation of T2* Relaxation Time of Breast Cancer: Correlation with Clinical, Imaging and Pathological Features.Korean J Radiol. 2017 Jan-Feb;18(1):238-248.
[8] .Xiaoqi Wang and Lan Liu. T2* Mapping for Breast Tumor .in Proc 24nd Annual Meeting ISMRM. 2016/11/13.
[9] .Hohenberger P, Felgner C, Haensch W, Schlag PM. Tumor oxygenation correlates with molecular growth determinants in breast cancer. Breast Cancer Res Treat. 1998;48:97–106.
[10] .Höckel M, Vaupel P. Tumor hypoxia: definitions and current clinical, biologic, and molecular aspects. J Natl Cancer Inst. 2001;93:266–276.
[11] .Hoskin PJ, Carnell DM, Taylor NJ, et al.Hypoxia in prostate cancer: correlation of BOLD -MRI with pimonidazole immunohistochemistry initial observations[J].313. Int J Radiat Oncol Biol Phys. 2007,68:1065-1071.
Figures
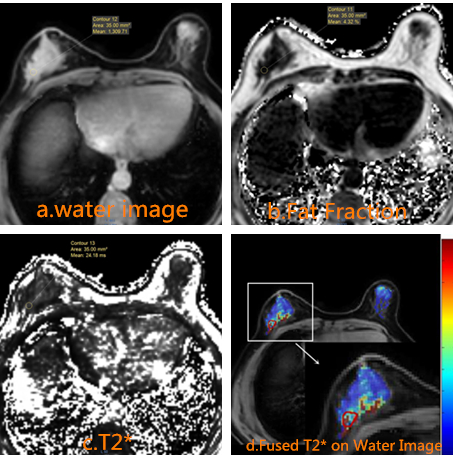
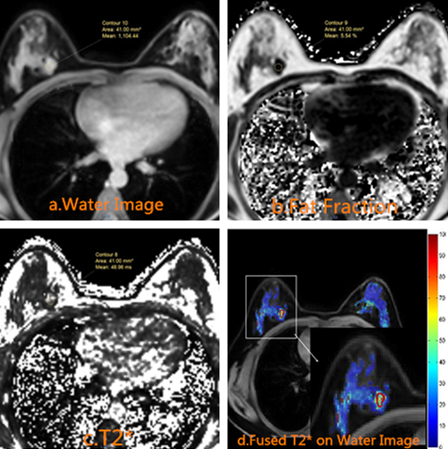
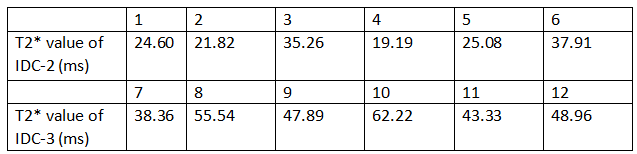
Figure 3.The table contains the T2 * values for 12 patients with breast invasive ductal carcinoma.