2419
Rapid and Simultaneous T1, T2 and Diffusion Quantification using MR Fingerprinting in the BreastYun Jiang1, Katherine L. Wright1, Jesse Hamilton2, Wei-Ching Lo2, Ananya Panda1, Gregor Körzdörfer3,4, Shota Hodono5, Michael A. Boss6, Nicole Seiberlich1,2, Vikas Gulani1,2, and Mark A. Griswold1,2
1Radiology, Case Western Reserve University, Cleveland, OH, United States, 2Biomedical Engineering, Case Western Reserve University, Cleveland, OH, United States, 3Siemens Healthcare GmbH, Erlangen, Germany, 4Friedrich-Alexander Universität Erlangen-Nürnberg, Erlangen, Germany, 5Department of Physics and Astronomy, Ohio Northern University, Ada, OH, United States, 6National Institute of Standards and Technology, Boulder, CO, United States
Synopsis
High quality, distortion-free T1, T2 and diffusivity maps in breast imaging are simultaneously generated using MRF framework. A good agreement of T1, T2 and ADC between the proposed MRF method and the traditional spin echo methods is demonstrated in a phantom and in vivo in breast imaging. This method enables the simultaneous collection of T1, T2 and diffusion maps for tissue characterization without the need to co-register separately acquired maps as in conventional MRI.
Introduction:
T1, T2, and diffusivity can be used in characterizing tissue properties and microstructure (1). However, the simultaneous measurement of T1, T2 and diffusivity is clinically challenging using conventional MR methods due to the long acquisition times needed to measure each property. In breast MR imaging, previous studies have shown that malignant and benign lesions have significant differences in T1, T2 and diffusivity (2,3). In this study, we extended the MRF framework (4) for a simultaneous and rapid quantification of T1, T2 and apparent diffusion coefficient (ADC) in breast imaging. The co-registered T1, T2 and ADC maps generated by the proposed method enable identification and characterization of tissues by exploring the multidimensional distribution of these three properties, which has the potential for characterizing lesions in the breast without the EPI related distortions prevalent in conventional approaches.Methods:
Multiple magnetization preparation modules including T1-inversion, T2-preparation (6), diffusion-preparation (7), and fat saturation were inserted in a FISP-based MRF sequence (5) to increase the T1, T2 and diffusion sensitivity and suppress the fat signal. The proposed pulse sequence thus contained one inversion recovery (TI of 21ms), four T2-preparation modules with TE of 20 ms, 30 ms, 50 ms and 80 ms and four diffusion-preparation modules with b-values of 50, 150, 300 and 500 s/mm2. After each magnetization preparation module, 48 time points were acquired with a repetition time (TR) of 6.42 ms and flip angle which varied from 4° to 25°. Each time point was acquired with one interleaf of a variable density spiral trajectory. The spiral requires 24 interleaves to fully sample the inner 25% of k-space and 48 interleaves to meet the Nyquist criterion with a spatial resolution of 1.6×1.6 mm2 for a field of view of 400 mm2. A total acquisition of each slice is within 60 seconds. The MRF dictionary was calculated using these acquisition parameters in Bloch equation simulations. The dictionary included a total of 173922 elements with T1 values ranging from 10 – 3000 ms, T2 from 2 – 800 ms and ADC from 0 – 3500×10-6 mm2/s. All experiments were performed on a Siemens MAGNETOM Aera 1.5T scanner (Siemens Healthcare GmbH, Erlangen, Germany) with an 8-channel breast receiver array. For validation, a homemade phantom consisting of 5 tubes with various concentration of Polyvinylpyrrolidone (PVP) solution doped with MnCl2 was scanned with the proposed MRF method as well as an inversion-recovery spin echo for T1, a multiple single echo spin echo for T2 and a diffusion-weighted spin echo for ADC values at room temperature. In vivo imaging was performed after informed consent in this IRB-approved study. T1, T2 and ADC values of each voxel were simultaneously derived by matching the undersampled signals to the dictionary.Results:
Figure 1a shows the T1, T2 and ADC maps from the doped PVP phantoms. The mean and standard deviation of each property of each tube were calculated from 160 pixels within a circular ROI drawn on the maps. Figure 1b shows the correlation curves of each of the properties estimated by the proposed method plotted against the reference values from spin echo based methods. Linear trends show that all three parameters from MRF are in good agreement with their standards. Figures 2 and 3 show T1, T2, ADC and proton density maps as well as a T1-weighted anatomical image and ADC maps estimated by clinical DW-EPI from two representative volunteers. An average T1 of 1065±162ms, T2 of 55±6ms and ADC of 1491±368 ×10-6 mm2/s for fibroglandular tissues were obtained from these two normal subjects, which agrees well with the literature values acquired at 1.5T (3,8). ADC values estimated from the proposed method are also in a good agreement with the diffusion map sequentially acquired by conventional scans (1496±243 ×10-6 mm2/s).Discussion:
These preliminary results demonstrate that quantitative T1, T2 and ADC values can be simultaneously measured in breast tissue using the MRF framework. Due to the use of the spiral trajectory, T1, T2 and ADC maps can be generated without the traditional geometric EPI distortion in diffusion images. Further studies will include additional patient studies for characterizing lesions in the breast using this three-property quantitative space along with clinical data.Conclusion:
An extended MRF method for generating high quality T1, T2 and ADC maps in the breast was presented. This method enables the identification and characterization of breast tissues by making use of the multidimensional distribution of these three properties.Acknowledgements
This work was supported by Siemens Healthcare and NIH grants 1R01EB016728-01A1, 5R01EB017219-02, R01HL094557, and R01DK098503.References
- Hürlimann M., Venkataramanan L. Quantitative Measurement of Two-Dimensional Distribution Functions of Diffusion and Relaxation in Grossly Inhomogeneous Fields. J Magn Reson. 2002;157(1):31-42. doi:10.1006/jmre.2002.2567.
- Edden, R. A. E., Smith, S. A., & Barker, P. B. (2010). Longitudinal and Multi-Echo Transverse Relaxation Times of Normal Breast Tissue at 3 Tesla. Journal of Magnetic Resonance Imaging : JMRI, 32(4), 982–987. http://doi.org/10.1002/jmri.22306
- Iima M1, Le Bihan D, Okumura R, Okada T, Fujimoto K, Kanao S, Tanaka S, Fujimoto M, Sakashita H, Togashi K. Apparent diffusion coefficient as an MR imaging biomarker of low-risk ductal carcinoma in situ: a pilot study. Radiology. 2011 Aug;260(2):364-72. doi: 10.1148/radiol.11101892. Epub 2011 Jun 1.
- Ma D, Gulani V, Seiberlich N, et al. Magnetic resonance fingerprinting. Nature. 2013;495(7440):187-192. doi:10.1038/nature11971.
- Hamilton JI, Jiang Y, Chen Y, et al. MR fingerprinting for rapid quantification of myocardial T1, T2, and proton spin density. Magnetic Resonance in Medicine. 2016.
- Brittain JH, Hu BS, Wright GA, Meyer CH, Macovski A, Nishimura DG. Coronary Angiography with Magnetization???Prepared T2 Contrast. Magn Reson Med. 1995;33(5):689-696. doi:10.1002/mrm.1910330515
- Thomas DL, Pell GS, Lythgoe MF, Gadian DG, Ordidge RJ. A quantitative method for fast diffusion imaging using magnetization-prepared TurboFLASH. Magn Reson Med. 1998;39(6):950-960. doi:DOI 10.1002/mrm.1910390613.
- Rakow-Penner, R., Daniel, B., Yu, H., Sawyer-Glover, A. and Glover, G. H. (2006), Relaxation times of breast tissue at 1.5T and 3T measured using IDEAL. J. Magn. Reson. Imaging, 23: 87–91. doi:10.1002/jmri.20469
Figures
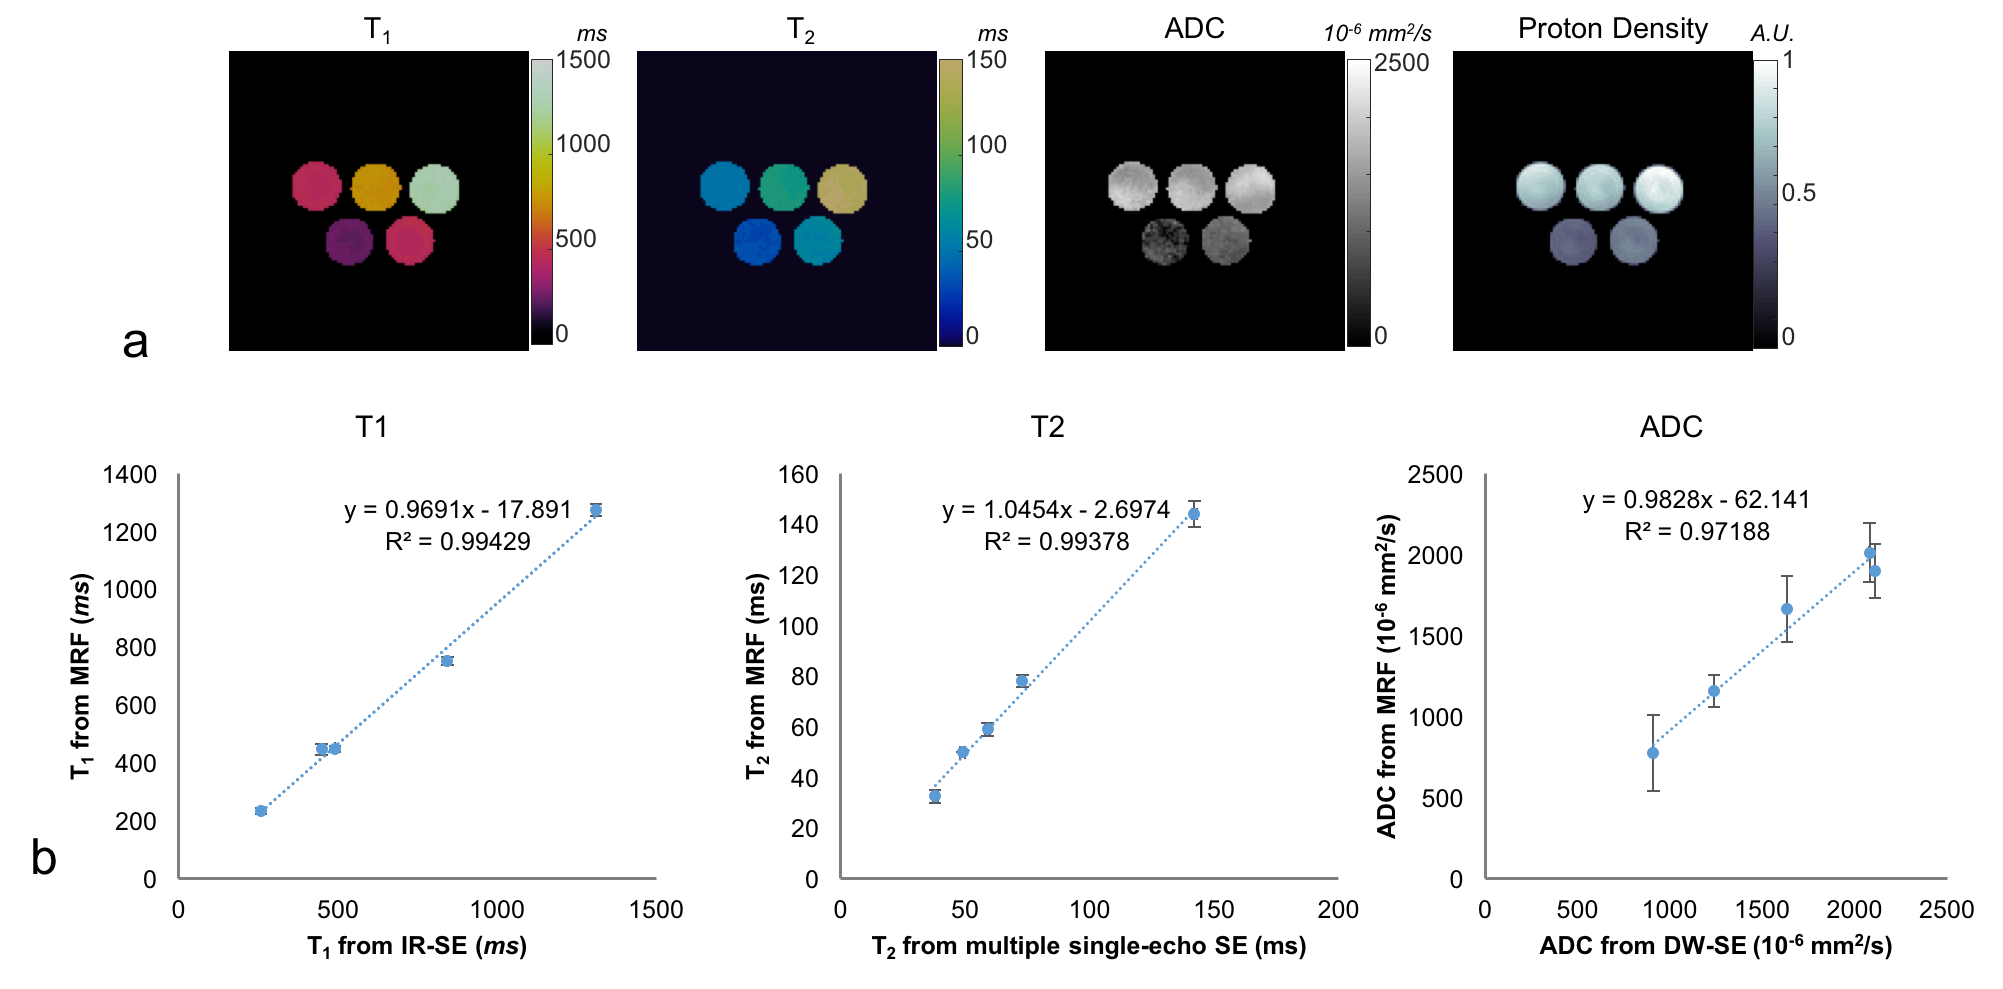
Figure 1 a) T1,
T2, ADC and proton density maps of a homemade phantom derived from the
proposed MRF method. b) T1, T2 and ADC values are plotted against their reference values measured by
spin echo based method, which shows all
three parameters from MRF are in good agreement with their standards.
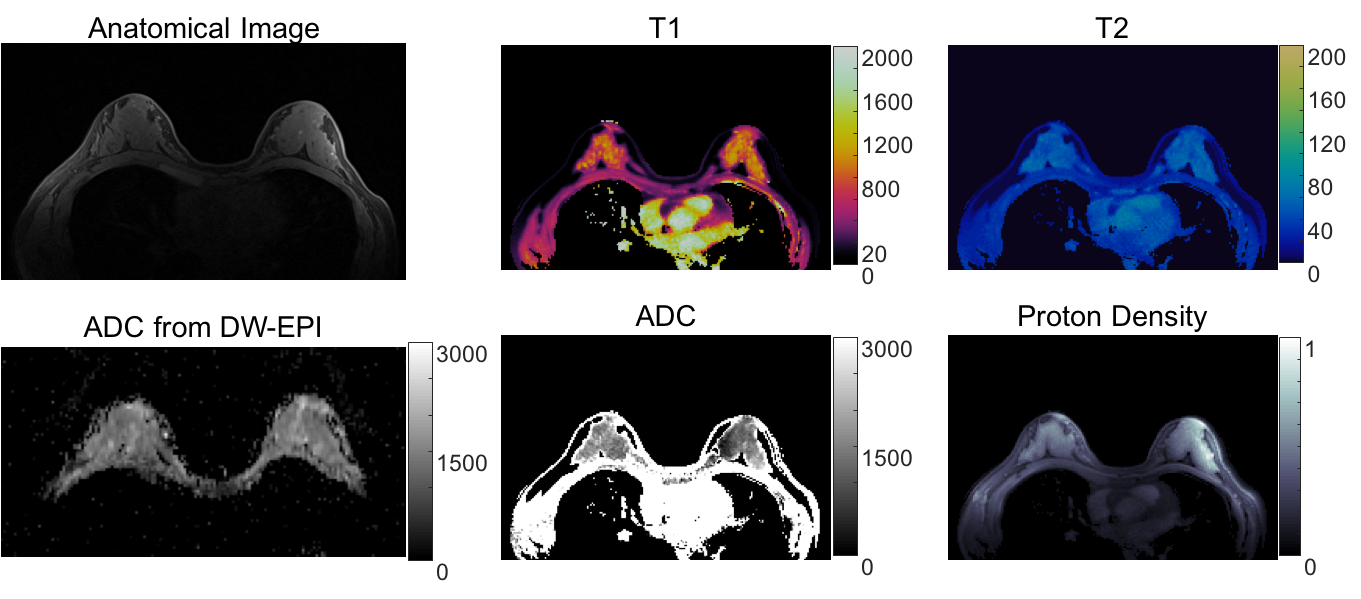
Figure 2. T1, T2, ADC and proton density maps from one volunteer and the
corresponding anatomical image and ADC map for reference. MRF maps were
acquired a spatial resolution of 1.6 × 1.6 × 5 mm3.
An average T1 of 1065±162ms, T2 of 55±6ms and
ADC of 1491±368 ×10-6 mm2/s for fibroglandular tissues
were obtained from MRF maps,
which agrees well with the literature values
acquired at 1.5T.
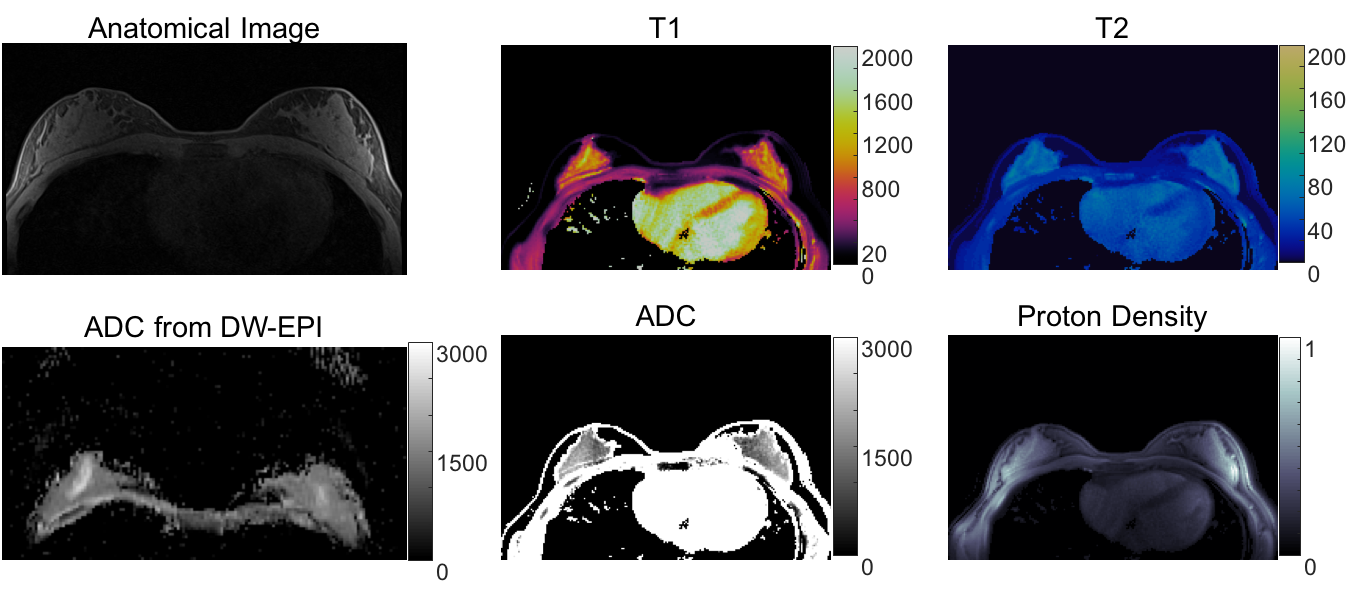
Figure 3. T1, T2, ADC and proton density maps from 2nd volunteer and the corresponding anatomical image and ADC map for reference.
ADC values (1491±368 ×10-6 mm2/s) of fibroglandular
tissues estimated from the
proposed method are also in a good agreement with the diffusion map sequentially
acquired by conventional scans (1496±243 ×10-6 mm2/s).