2418
A MRI-based breast density measure which is directly comparable to mammographic density1Biomedical Engineering, Stony Brook University, Stony Brook, NY, United States, 2Stony Brook University Cancer Center, Stony Brook, NY, United States, 3Hematology and Oncology, Stony Brook Medicine, Stony Brook, NY, United States, 4Biomedical Engineering, Shenzhen University, Shenzhen, China, 5Guangdong Key Laboratory for Biomedical Measurements and Ultrasound Imaging, Shenzhen, China, 6Applied Mathematics and Statistics, Stony Brook University, Stony Brook, NY, United States, 7University of Arizona Cancer Center, Tucson, AZ, United States, 8Medical Imaging, University of Arizona, Tucson, AZ, United States, 9Epidemiology and Biostatistics, University of Arizona, Tucson, AZ, United States, 10University of Hawaii Cancer Center, Honolulu, HI, United States, 11Pathology, Stony Brook Medicine, Stony Brook, NY, United States, 12Computer Science, Stony Brook University, Stony Brook, NY, United States, 13Radiology, Stony Brook Medicine, Stony Brook, NY, United States, 14Psychiatry, Stony Brook Medicine, Stony Brook, NY, United States
Synopsis
High breast density is an independent risk factor for breast cancer. Mammography, the most widely used method for breast density determination, is limited by ionizing radiation exposure and its relatively low reliability for density assessment. We propose an automated, safe, and highly reproducible breast density measurement based on fat-water decomposition MRI. The technique yields a measure directly comparable to mammographic density which is easy for clinicians to use and for patients to understand.
Purpose
Breast density (BD) measures the proportion of fatty and fibroglandular tissues in the breast, and high BD is a significant independent risk factor for breast cancer1-4. As such, accurate measurement of BD has emerged as a priority for assessing breast cancer risk and evaluating the efficacy of putative chemopreventive agents aimed at reducing BD. Currently, mammography is the most widely used method for BD quantification but ionizing radiation limits its use in studies requiring frequent monitoring. Previously, we developed a BD estimation technique based on fat-water decomposition MRI5. In this work, we optimized this measure based on its concordance with mammographic density (MD), thereby developing a robust MRI-based BD (MRD) measure that is directly comparable to MD.Methods
This study included 40 women receiving tamoxifen for treatment of early stage breast cancer or as primary chemoprevention. The fat-water MRI data were collected on two scanners. 35 scans were performed on a 1.5T GE Signa NV-CV/i scanner using a radial IDEAL gradient and spin-echo pulse sequence in the axial orientation to generate quantitative fat fraction maps of the entire breast volume6. The remaining 5 scans were performed on a 3T Siemens Skyra using an 3D Cartesian 6-echo gradient echo pulse sequence with a similar fat-water separation technique. The total acquisition time was <5 minutes for both sequences. A validated automated breast segmentation7 was applied to all scans. We built a signal model to mathematically correct the fat-water signal bias due to the intrinsic limitation of this chemical shift based fat-water separation technique. BD measure was then calculated as FraGW5, which accounts for the fraction amount of fibroglandular tissue (FraGland) and actual water content (FraWater) in the breast.
Breasts containing implants or treated with radiation therapy were excluded from study. In total, 42 breasts were identified from the 40 patients. All patients received digital mammography within 6 months from the date of the MRI scan and had MD changes < 10% between baseline and follow-up mammograms (1-2 years apart). MD, as the reference standard, was assessed using a well-established quantitative method (Cumulus)8. Pearson correlation was performed between MD and FraGW. The data points were fitted to a conversion curve: y=axb, by which MRD was generated based on FraGW to be directly comparable to MD. To evaluate the concordance between MRD and MD, the root-mean-square error (RMSE) of leave-one-out cross-validation was calculated.
Results
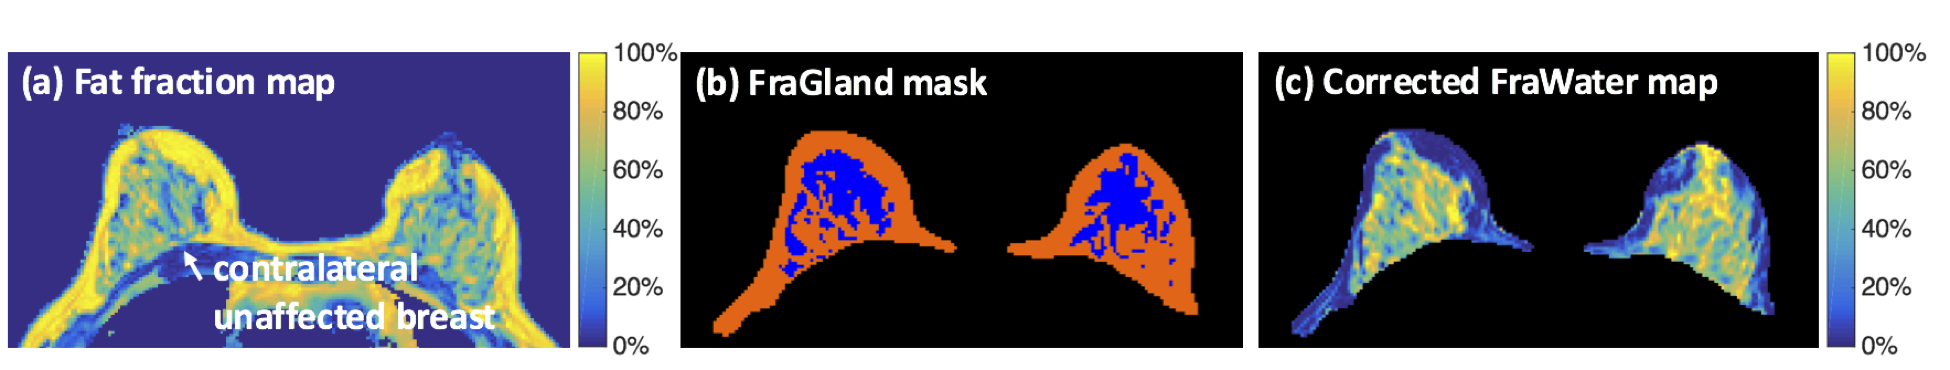
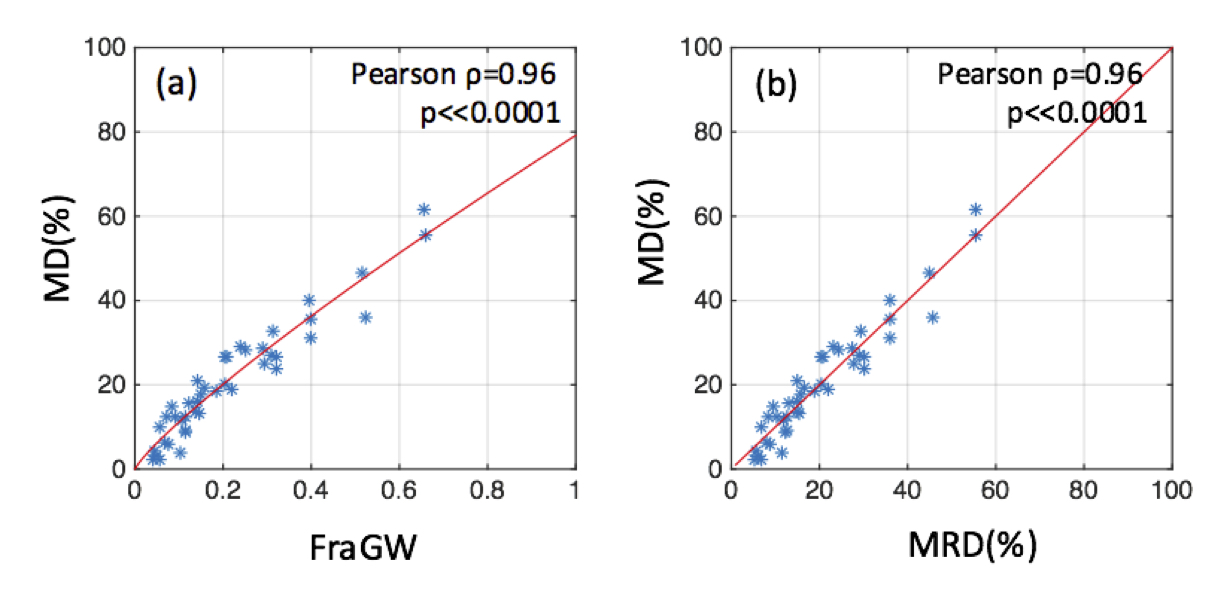
Derived from a representative breast slice collected on the Siemens scanner, the original fat fraction map, the corresponding FraGland mask and corrected FraWater map are shown in Figure 1(a)-(c). Figure 2(a) shows the high correlation between MD and FraGW (Pearson ρ = 0.96, p<<0.0001) and the established MRD calibration curve. The leave-one-out RMSE was 4.17%, which is believed to result mainly from the low reliability of MD as the intrareader correlation coefficient of MD was only 0.92 in our quality control procedure. Figure 2(b) demonstrates that the converted MRD was strongly correlated with MD, with Pearson ρ = 0.96, p << 0.0001.Discussion and Conclusion
The proposed MRD is easy to understand for clinicians and patients, and directly comparable to previous MD measure obtained by mammogram. In addition, based on 26 test-retest scans, MRD exhibited minimal test-retest variation (1.1±1.2%) and an extremely high intraclass correlation coefficient (0.99). Therefore, this highly reproducible MRI-based BD estimation is directly comparable to MD for use in clinical practice, enables the early detection of small BD changes in clinical trials, and could potentially be used for monitoring individual treatment responses in breast cancer patients or high-risk women.Acknowledgements
This work is partially supported by NIH grants CA149417, CA161534, and Carol M. Baldwin Breast Cancer Research Fund.References
1. McCormack VA, dos Santos Silva I. Breast density and parenchymal patterns as markers of breast cancer risk: a meta-analysis. Cancer Epidemiology Biomarkers & Prevention. 2006;15(6):1159-1169.
2. Boyd NF, Dite GS, Stone J, Gunasekara A, English DR, McCredie MR, Giles GG, Tritchler D, Chiarelli A, Yaffe MJ. Heritability of mammographic density, a risk factor for breast cancer. New England Journal of Medicine. 2002;347(12):886-894.
3. Engmann NJ, Golmakani MK, Miglioretti DL, Sprague BL, Kerlikowske K. Population-Attributable Risk Proportion of Clinical Risk Factors for Breast Cancer. JAMA oncology. 2017.
4. Boyd NF,
Martin LJ, Bronskill M, Yaffe MJ, Duric N, Minkin S. Breast tissue composition
and susceptibility to breast cancer. Journal
of the National Cancer Institute. 2010.
5. Ding J,
Thompson PA, Gao Y, Marron MT, Wertheim BC, Altbach MI, Galons J-P, Roe DJ,
Wang F, Maskarinec G, Thomson CA, Stopeck A, Huang C. Accurate and Reliable
Fat-Water MRI Breast Density Measurements. Paper presented at: ISMRM 25th
Annual Scientific Meeting & Exhibition, 2017; Honolulu.
6. Huang C, Altbach MI. Multi-Mask Multi-Seed Free Growing Field Map Estimation Algorithm for Iterative Multi-Point Water-Fat Decomposition. Paper presented at: ISMRM 17th Annual Scientific Meeting & Exhibition, 2009; Honolulu, Hawaii, USA.
7. Ding J, Thompson PA, Marron MT, Altbach MI, Roe D, Galons J-P, Thomson CA, Wang F, Stopeck A, Huang C. The test-retest reliability of fat-water ratio MRI derived breast density measurements and automated breast segmentation. Paper presented at: ISMRM 24th Annual Scientific Meeting & Exhibition, 2016; Singapore.
8. Byng JW, Yaffe MJ, Jong RA, Shumak RS, Lockwood GA, Tritchler DL, Boyd NF. Analysis of mammographic density and breast cancer risk from digitized mammograms. Radiographics. 1998;18(6):1587-1598.
Figures