2417
Resting-state fMRI functional connectivity is confounded by the hemodynamic response function (HRF)1Department of Psychiatry and Biobehavioral Sciences, University of California Los Angeles, Los Angeles, CA, United States, 2Department of Electrical and Computer Engineering, Auburn University, Auburn, AL, United States, 3Department of Data Analysis, University of Ghent, Ghent, Belgium, 4Key Laboratory of Cognition and Personality, Southwest University, Chongqing, China, 5Department of Bioengineering, University of California Riverside, Riverside, CA, United States, 6Department of Psychology, Auburn University, Auburn, AL, United States, 7Alabama Advanced Imaging Consortium, Auburn University and University of Alabama Birmingham, Auburn, AL, United States
Synopsis
Functional MRI is an indirect measure of neural activity, as it is the convolution of the hemodynamic-response function (HRF) and latent neural response. Recent studies show variability in HRF across brain regions and individuals, with the potential to confound resting-state functional connectivity (FC) if HRF variability were ignored. Using resting-state fMRI obtained at 7T (N=47), we estimated HRF parameters using deconvolution, and tested the hypothesis that HRF variability confounds FC. We found evidence, with simulations (up to 50% error in FC) and experimental data (mean/median error = 30.5/11.5% in FC) quantifying the impact the HRF variability on FC.
Introduction
Functional MRI (fMRI) functional connectivity (FC) is used extensively for studying neural correlates of brain functioning. FMRI is an indirect measure of neural activity obtained from blood hemodynamics, and is the convolution of the hemodynamic response function (HRF) and latent neural response [1]. Most FC studies assume a standard canonical HRF during analysis. However, recent advances show variability in HRF for different brain regions across individuals [2] [3]. This raises questions regarding the reliability of FC results since it is unclear if observed changes are due to neural activity or HRF variability (HRFv). In this work, we tested the hypothesis that HRFv confounds FC estimates in the brain’s default-mode-network (DMN).Methods
We tested this hypothesis using simulations (where ground truth is known) as well as experimental fMRI data obtained in a 7T MRI scanner. Simulations were adopted from [4], wherein we simulated pairs of neural time series with known neural-FC between them, then simulated pairs of HRFs with known HRF difference between them, then convolved them to obtained pairs of fMRI time series and the fMRI-FC between them. We compared the percentage difference between neural-FC and fMRI-FC (ΔFC) and difference in HRF parameters.
Resting-state FMRI data was obtained (N=47, healthy) in a Siemens MAGNETOM 7T scanner (T2*-weighted multiband EPI, 32-channel head coil, TR/TE=1000/20ms, flip angle=70˚, multiband factor=2, voxel-size=2×2×2.4 mm3, acquisition matrix = 96×96, number of slices = 45, 11 minute scan with whole-brain coverage). Standard pre-processing was performed in SPM12 (realignment, normalization to MNI space, de-spiking, smoothing [8mm], regressing out white-matter and CSF signals and band-pass filtering [0.008-0.1Hz]). Mean time series were extracted from 58 DMN regions-of-interest (ROIs) defined by Power et.al. [5].
For deconvolution, we employed a widely-used technique by Wu et.al. [6], which simultaneously estimated the HRF and latent neural time series. HRF shape was characterized by three parameters [3]- response-height (RH), time-to-peak (TTP), full-width at half-maximum (FWHM). FC, using Pearson’s correlation, was obtained from two pipelines: data with deconvolution (DC, HRFv-minimized), and data with no deconvolution (NDC, HRFv-ignored). DC and NDC FC networks were compared (paired t-test, p<0.05, Bonferroni corrected), along with regional HRF differences, revealing potential false connectivities that resulted from HRFv.
Results
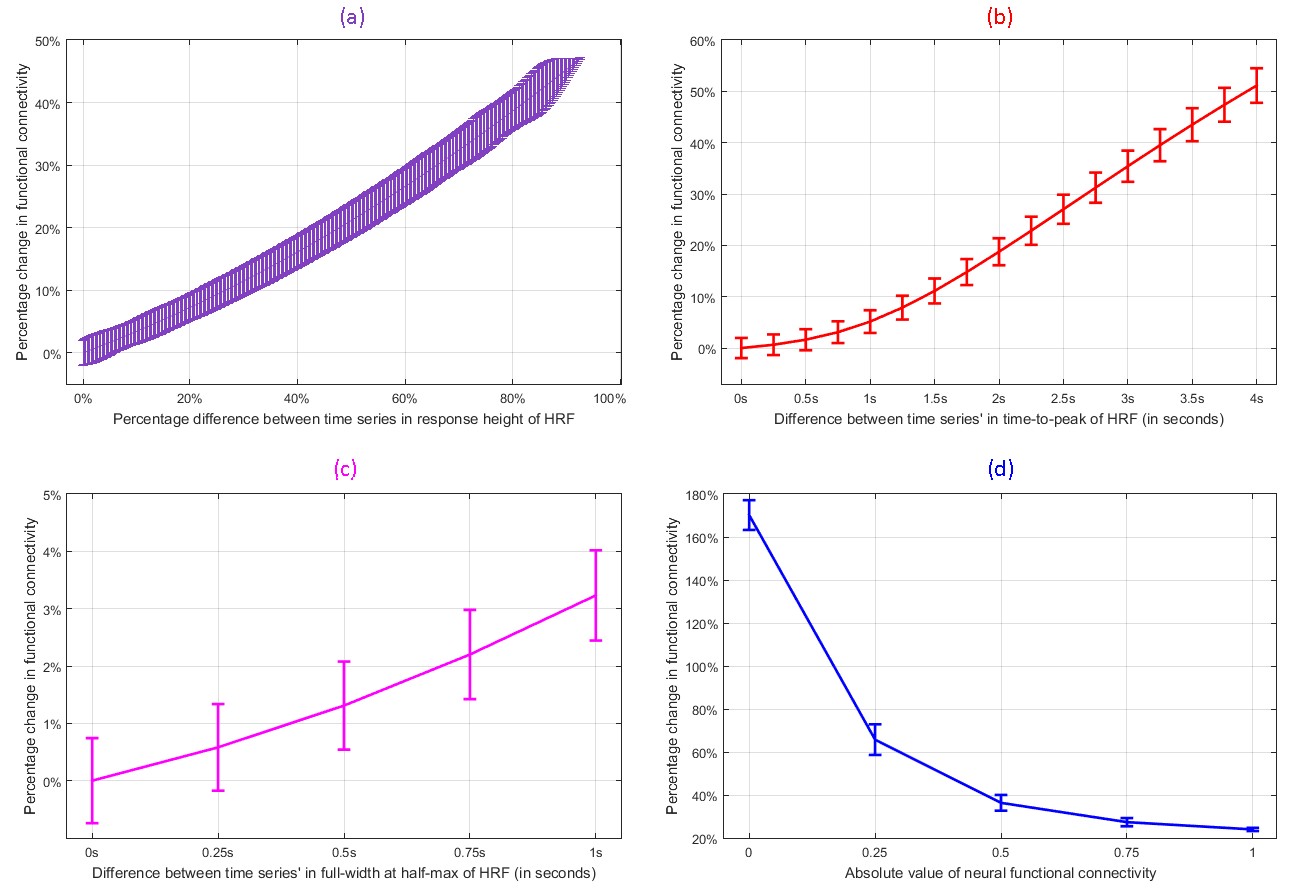
We found evidence supporting our hypothesis using both simulations and experimental data. With simulations, we found that variability in RH (and TTP) within a biologically plausible range could cause a change of up to 50% in FC (Fig.1). Change in FC was larger for smaller FC values (about 170%), which reduced to about 22% for the largest FC values. Overall, simulations revealed the landscape and limits of the impact of HRFv on FC.
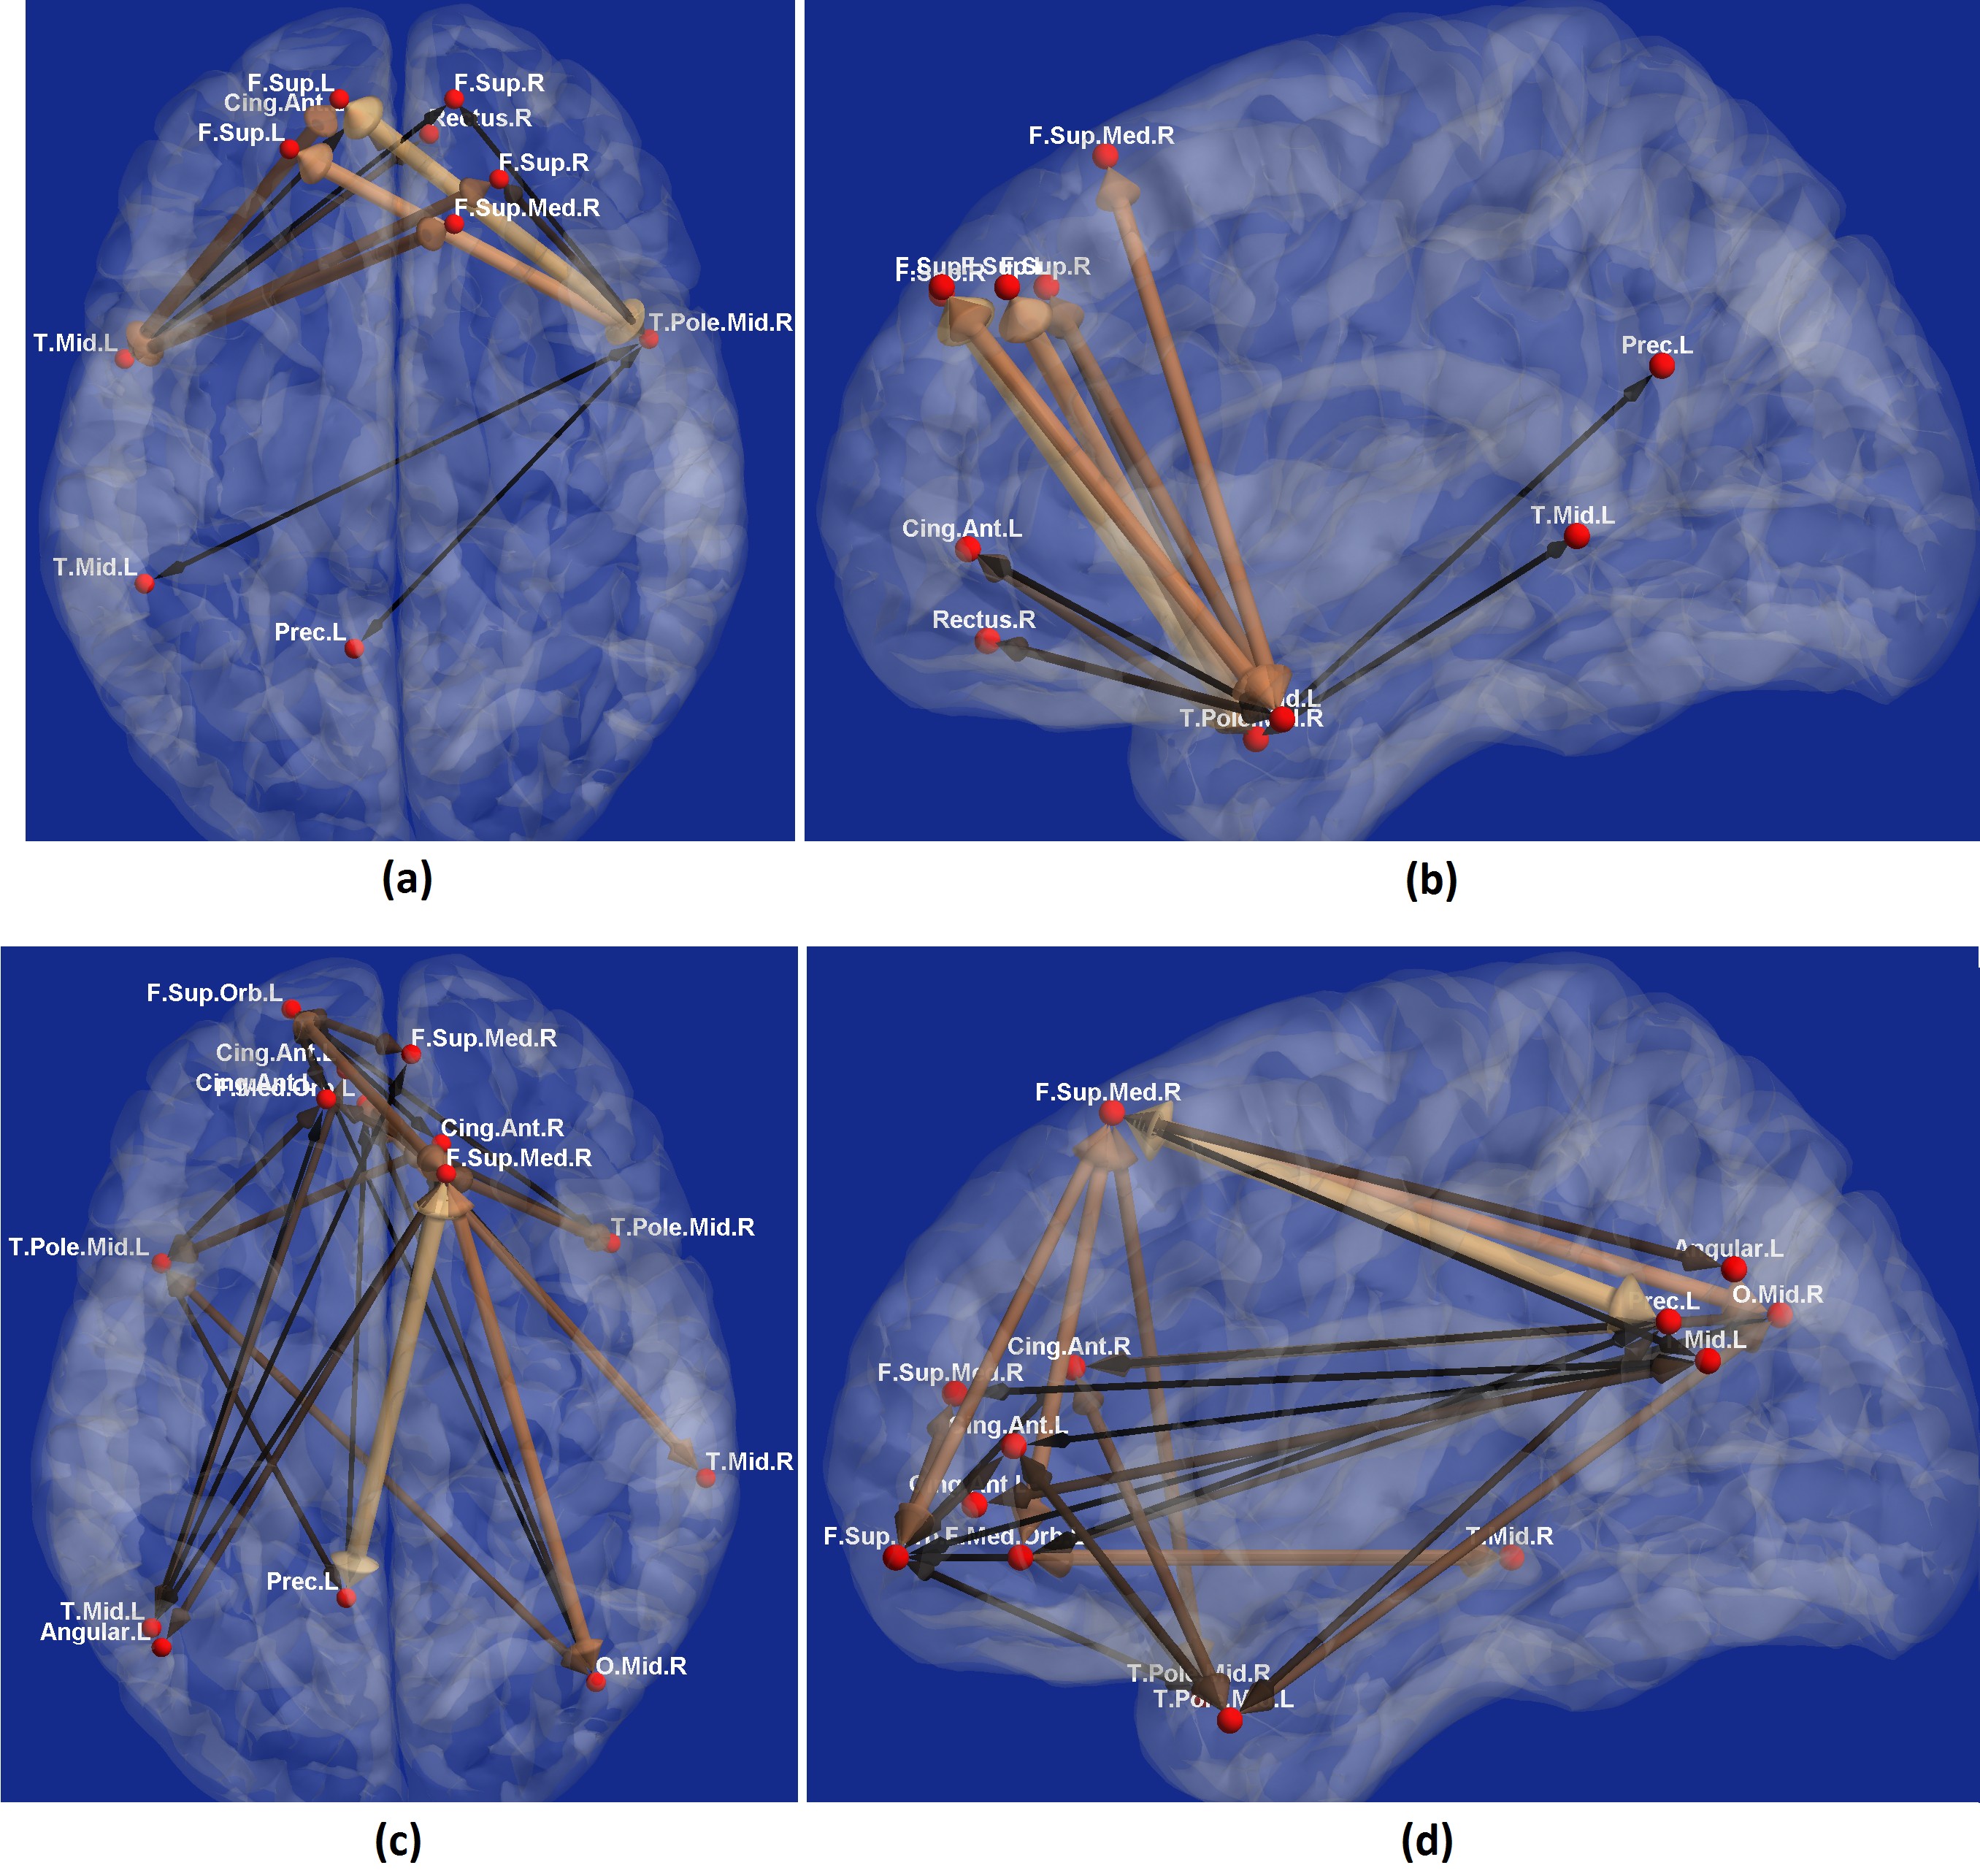
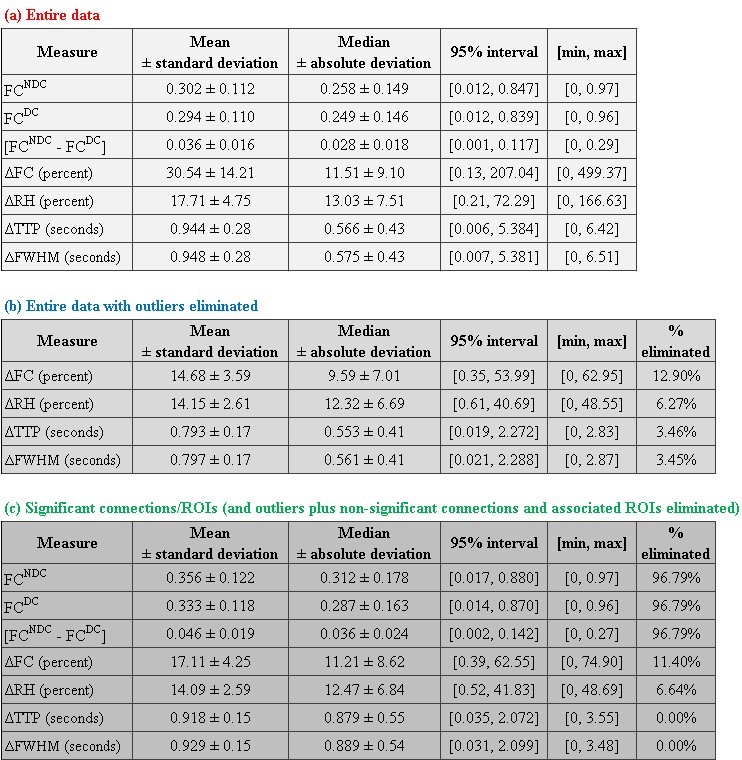
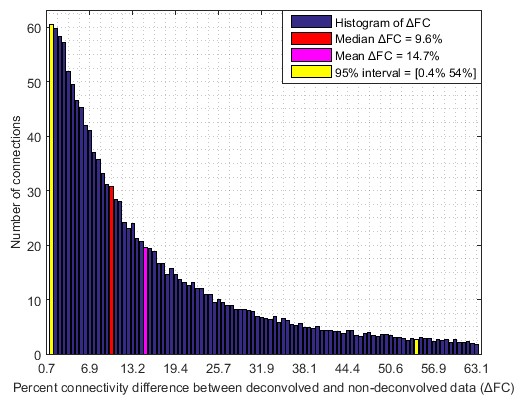
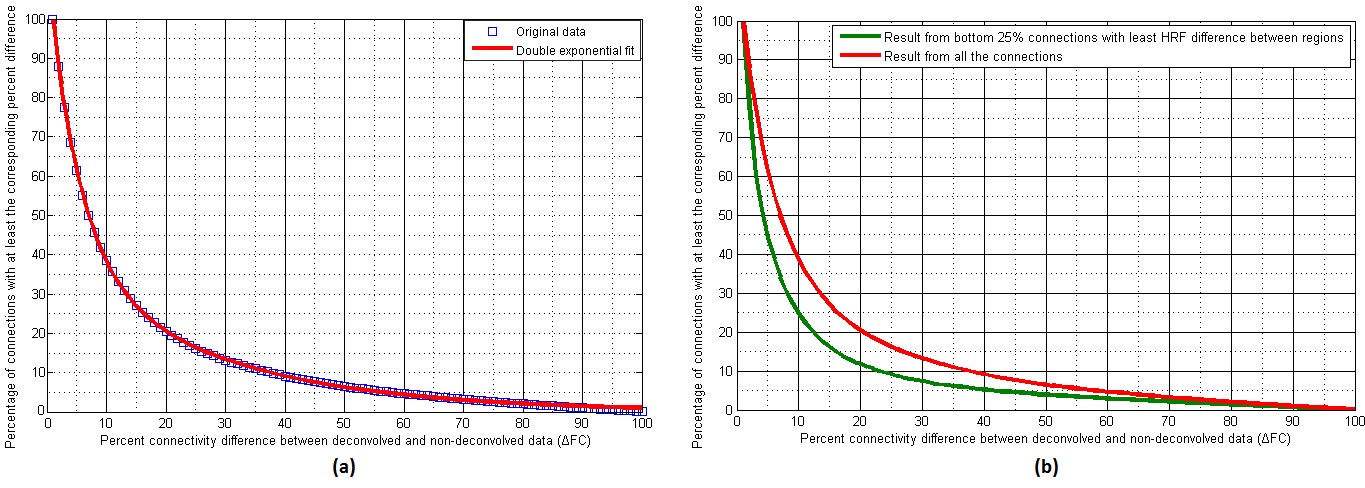
With experimental fMRI data, we identified several potential false connectivities attributable to HRFv, with majority connections being between different lobes (Fig.2), corroborating larger variability in vasculature etc. between lobes, which affect the HRF [1]. Probing deeper into the landscape of percentage connectivity error (ΔFC) caused by HRFv (Fig.3), we found that HRFv caused a mean/median ΔFC of 30.5/11.5%. The histogram of ΔFC (Fig.4) shows that the mean ΔFC (14.7%), obtained after removing outliers, is a reasonable estimate of the average impact of HRFv on FC. Finally, we found a double exponential relationship between the magnitude of HRFv and its impact on FC (Fig.5a), which suggested that, for example, one-thirds of the connections had at least 10% change in connectivity, and 10% of connections had at least one-third change in FC due to HRFv. Even if one were to contend that the ground-truth HRFs were less variable or that our deconvolution estimates were considerably noisy, one would still observe nearly prominent effect of HRFv on FC (Fig.5b).
Discussion
Our findings imply that HRF variability, on average, causes about 14.7% error in FC in healthy adults for the scan parameters we have used in a 7T scanner. Results could be worse at 3T [7]. An error of the order of 15% in connectivity estimates is sufficient to cause a large impact on statistical inferences, network structure, graph analysis, machine learning models and any other derived measure such as behavioral associations. Even in psychiatric and neurologic disorders, aberrant changes in connectivity values are often of this order or smaller [8]. These findings have considerable implications for the interpretability and reliability of FC findings in fMRI studies. Results imply that HRFv could lead to the identification of false positive and false negative connections, and that FC findings from HRFv-ignored data should be interpreted cautiously. We hope that our study encourages researchers to overcome this perplexing lack of attention to HRF variability while studying fMRI FC.Acknowledgements
No acknowledgement found.References
[1] G. K. Aguirre, E. Zarahn and M. D'esposito, "The variability of human, BOLD hemodynamic responses," Neuroimage, vol. 8, no. 4, pp. 360-9, 1998.
[2] D. A. Handwerker, J. M. Ollinger and M. D'Esposito, "Variation of BOLD hemodynamic responses across subjects and brain regions and their effects on statistical analyses," Neuroimage, vol. 21, no. 4, pp. 1639-51, 2004.
[3] D. Rangaprakash, M. N. Dretsch, W. Yan, J. S. Katz, T. S. Denney and G. Deshpande, "Hemodynamic variability in soldiers with trauma: Implications for functional MRI connectivity studies," NeuroImage: Clinical, vol. 16, pp. 409-417, 2017.
[4] G. Deshpande, K. Sathian and X. Hu, "Assessing and compensating for zero-lag correlation effects in time-lagged Granger causality analysis of FMRI," IEEE Transactions on Biomedical Engineering, vol. 57, no. 6, pp. 1446-56, 2010.
[5] J. D. Power, A. L. Cohen, S. M. Nelson, G. S. Wig and K. A. Barnes, "Functional network organization of the human brain," Neuron, vol. 72, no. 4, pp. 665-78, 2011.
[6] G. Wu, W. Liao, S. Stramaglia, J. Ding, H. Chen and D. Marinazzo, "A blind deconvolution approach to recover effective connectivity brain networks from resting state fMRI data," Medical Image Analysis, vol. 17, no. 3, pp. 365-374, 2013.
[7] E. Yacoub, A. Shmuel, J. Pfeuffer, P. F. Van De Moortele, G. Adriany, P. Andersen, J. T. Vaughan, H. Merkle, K. Ugurbil and X. Hi, "Imaging brain function in humans at 7 Tesla," Magnetic Resonance in Medicine, vol. 45, no. 4, pp. 588-94, 2001.
[8] J. Gross, Handbook of Emotion Regulation, New York: The Guilford Press, 2014.
Figures