2414
A new analysis of resting state connectivity and graph theory reveals distinctive short-term modulations due to whisker stimulations in rats.1Institute for Pharmacology and Toxicology, Friedrich-Alexander-University Erlangen-Nuremberg, Erlangen, Germany, 2Department of Radiology, University Hospital of the Friedrich-Alexander University Erlangen-Nuremberg, Erlangen, Germany, 3Faculty of Mathematical & Physical Sciences, Benemerita Universidad Autonoma de Puebla, Puebla, Mexico
Synopsis
In this study we introduced a powerful new method to analyze resting state functional connectivity. The MSRA approach integrates classical seed based correlation and modern graph-theory. In comparison to two undirected graph-theoretical approaches, it resembles ICA components best and is characterized by its high specificity and reproducibility. In combination with an adaptation of the network based statistics to paired samples, it promises to be a powerful tool to investigate short term modulations of sensory stimuli related resting state connectivity and ultimately impact our understanding of basic brain functions like fear to higher functions such as plasticity, learning and memory.
Introduction
Resting state (RS) connectivity has been increasingly studied in healthy and diseased brains in humans and animals. However, its biological relevance is still not fully understood. It has been widely accepted that resting state networks are dynamic in nature1. Hypothetically, this dynamic may contribute to neural plasticity, other learning processes, and memory consolidation2,3. When compared to the more natural stimulation of all whiskers, trimming and stimulation of the remaining whiskers induces altered functional activation patterns that are shown to be related to plasticity and learning processes4-6. Therefore, our goal is to develop a method that can reveal subtle changes in RS connectivity induced by plasticity in the barrel field of the rat. For that purpose we evaluated three graph-theoretical RS analysis methods in comparison to ICA.Methods
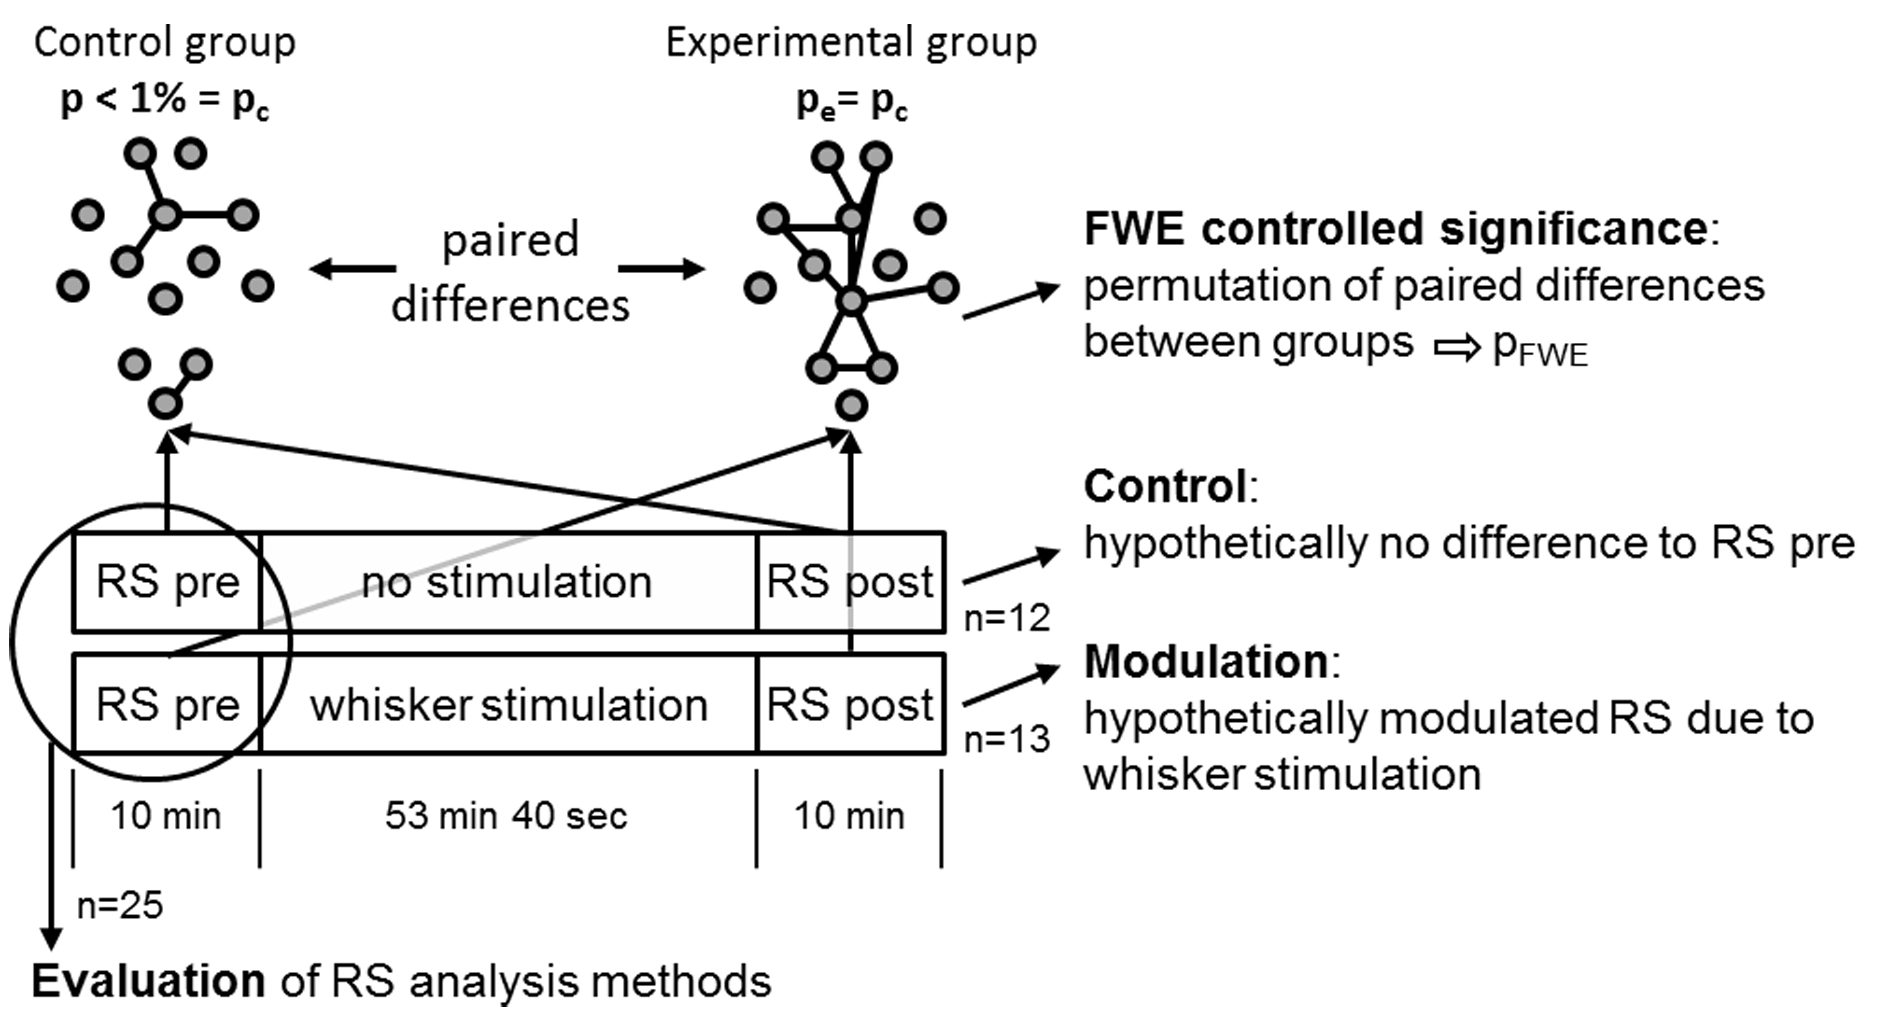
Experimental design: 25 male Sprague Dawley rats were separated into two groups: (1) experimental group (n=13) with stimulation of the remaining whiskers in the left C row after trimming of all other whiskers; (2) control group (n=12) prepared and mounted in the same way as the experimental group but without whisker trimming or stimulation (Fig. 1). Each animal (anesthetized with 1.2% isoflurane, body temperature 37°C) underwent one fMRI-session starting with a resting state (RS) measurement followed by a sequence either with or without unilateral whisker stimulation and subsequently a second RS measurement.
Image acquisition: MRI experiments were carried out using with a 4.7 T/40 cm horizontal bore actively shielded magnet BioSpec (BRUKER, Germany). Gradient system (200 mT/m) and whole-body birdcage resonator enabled homogenous excitation. An actively RF-decoupled 2x2 rat phased array head coil was used to acquire brain images. Both resting state scans consisted of 300 brain volumes acquired with a T2*-weighted GE-EPI sequence covering 22 axial slices of the brain in 2 seconds (total time 10 minutes, TE=25.03 ms, TR= 2000 ms, in-plane resolution 391×391 μm, slice thickness 1 mm, matrix 64 ×64, FOV 25x25 mm). 1602 volumes (total time 53 min) of stimulation driven fMRI data between the two RS measurements were acquired using the same imaging sequence either with 100 unilateral whisker stimulations (6 Hz, 10 mm amplitude, 8 s duration with 24 s intermediate rest) or without. Finally anatomical T2 reference images (RARE, slice thickness 1 mm, field of view 25×25 mm, matrix 256×256, TR = 3000 ms, TEef =11.7 ms, NEX=5) were acquired.
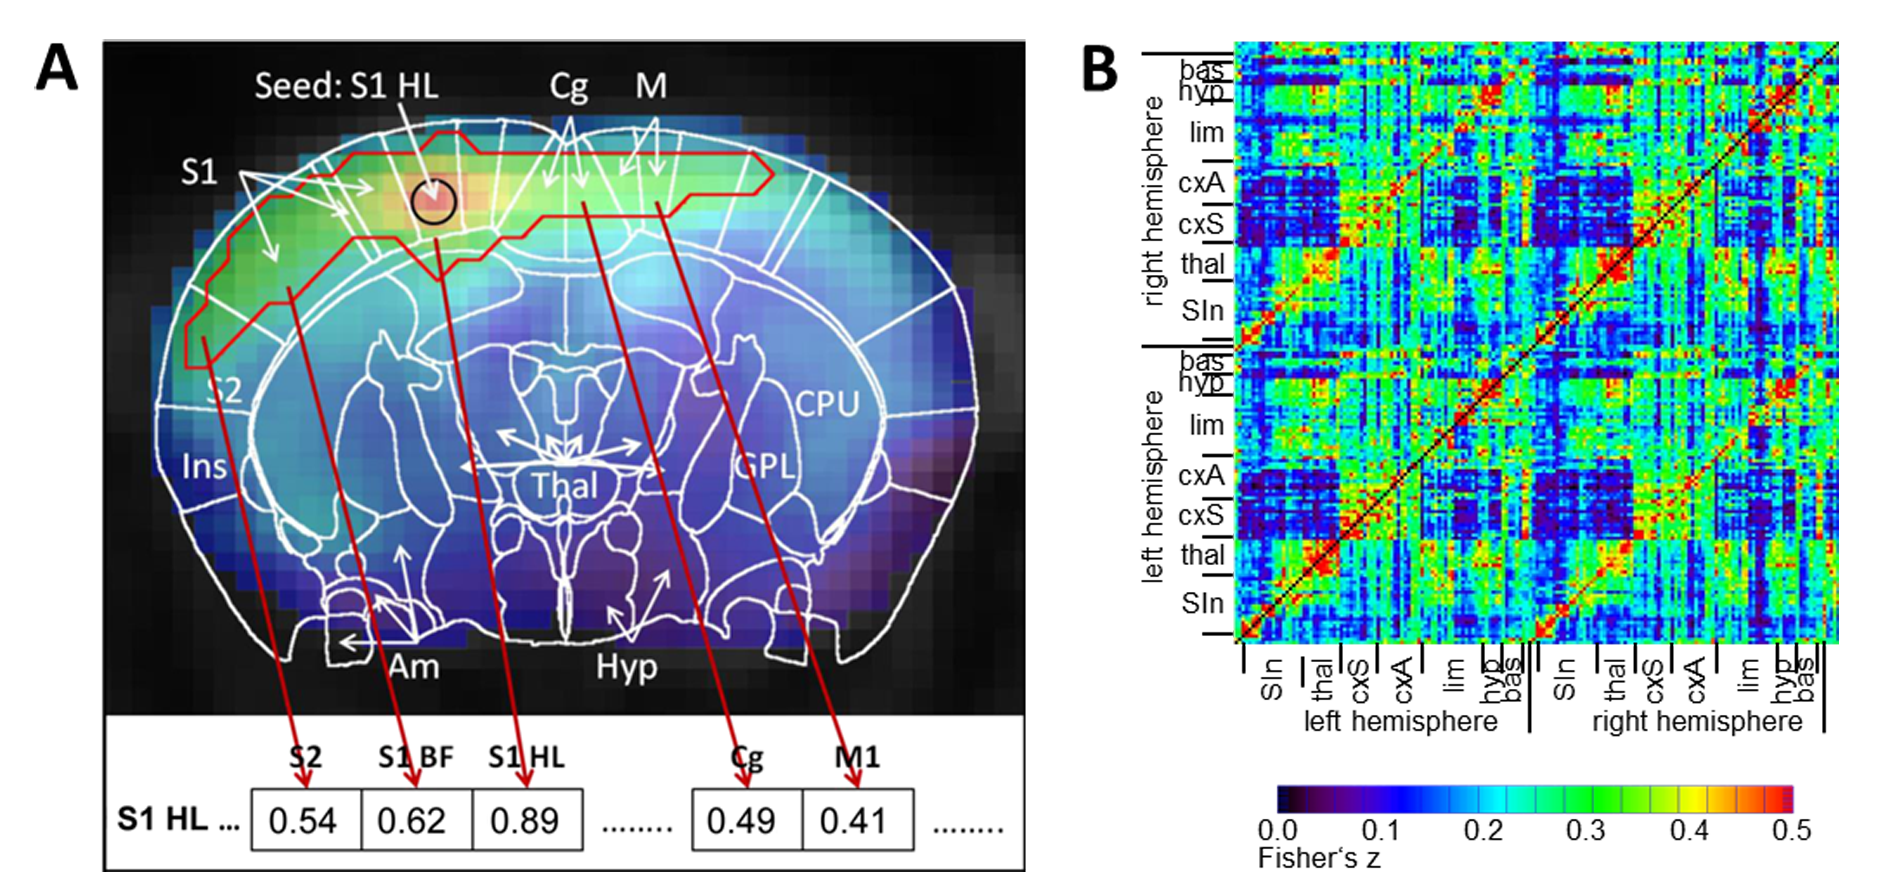
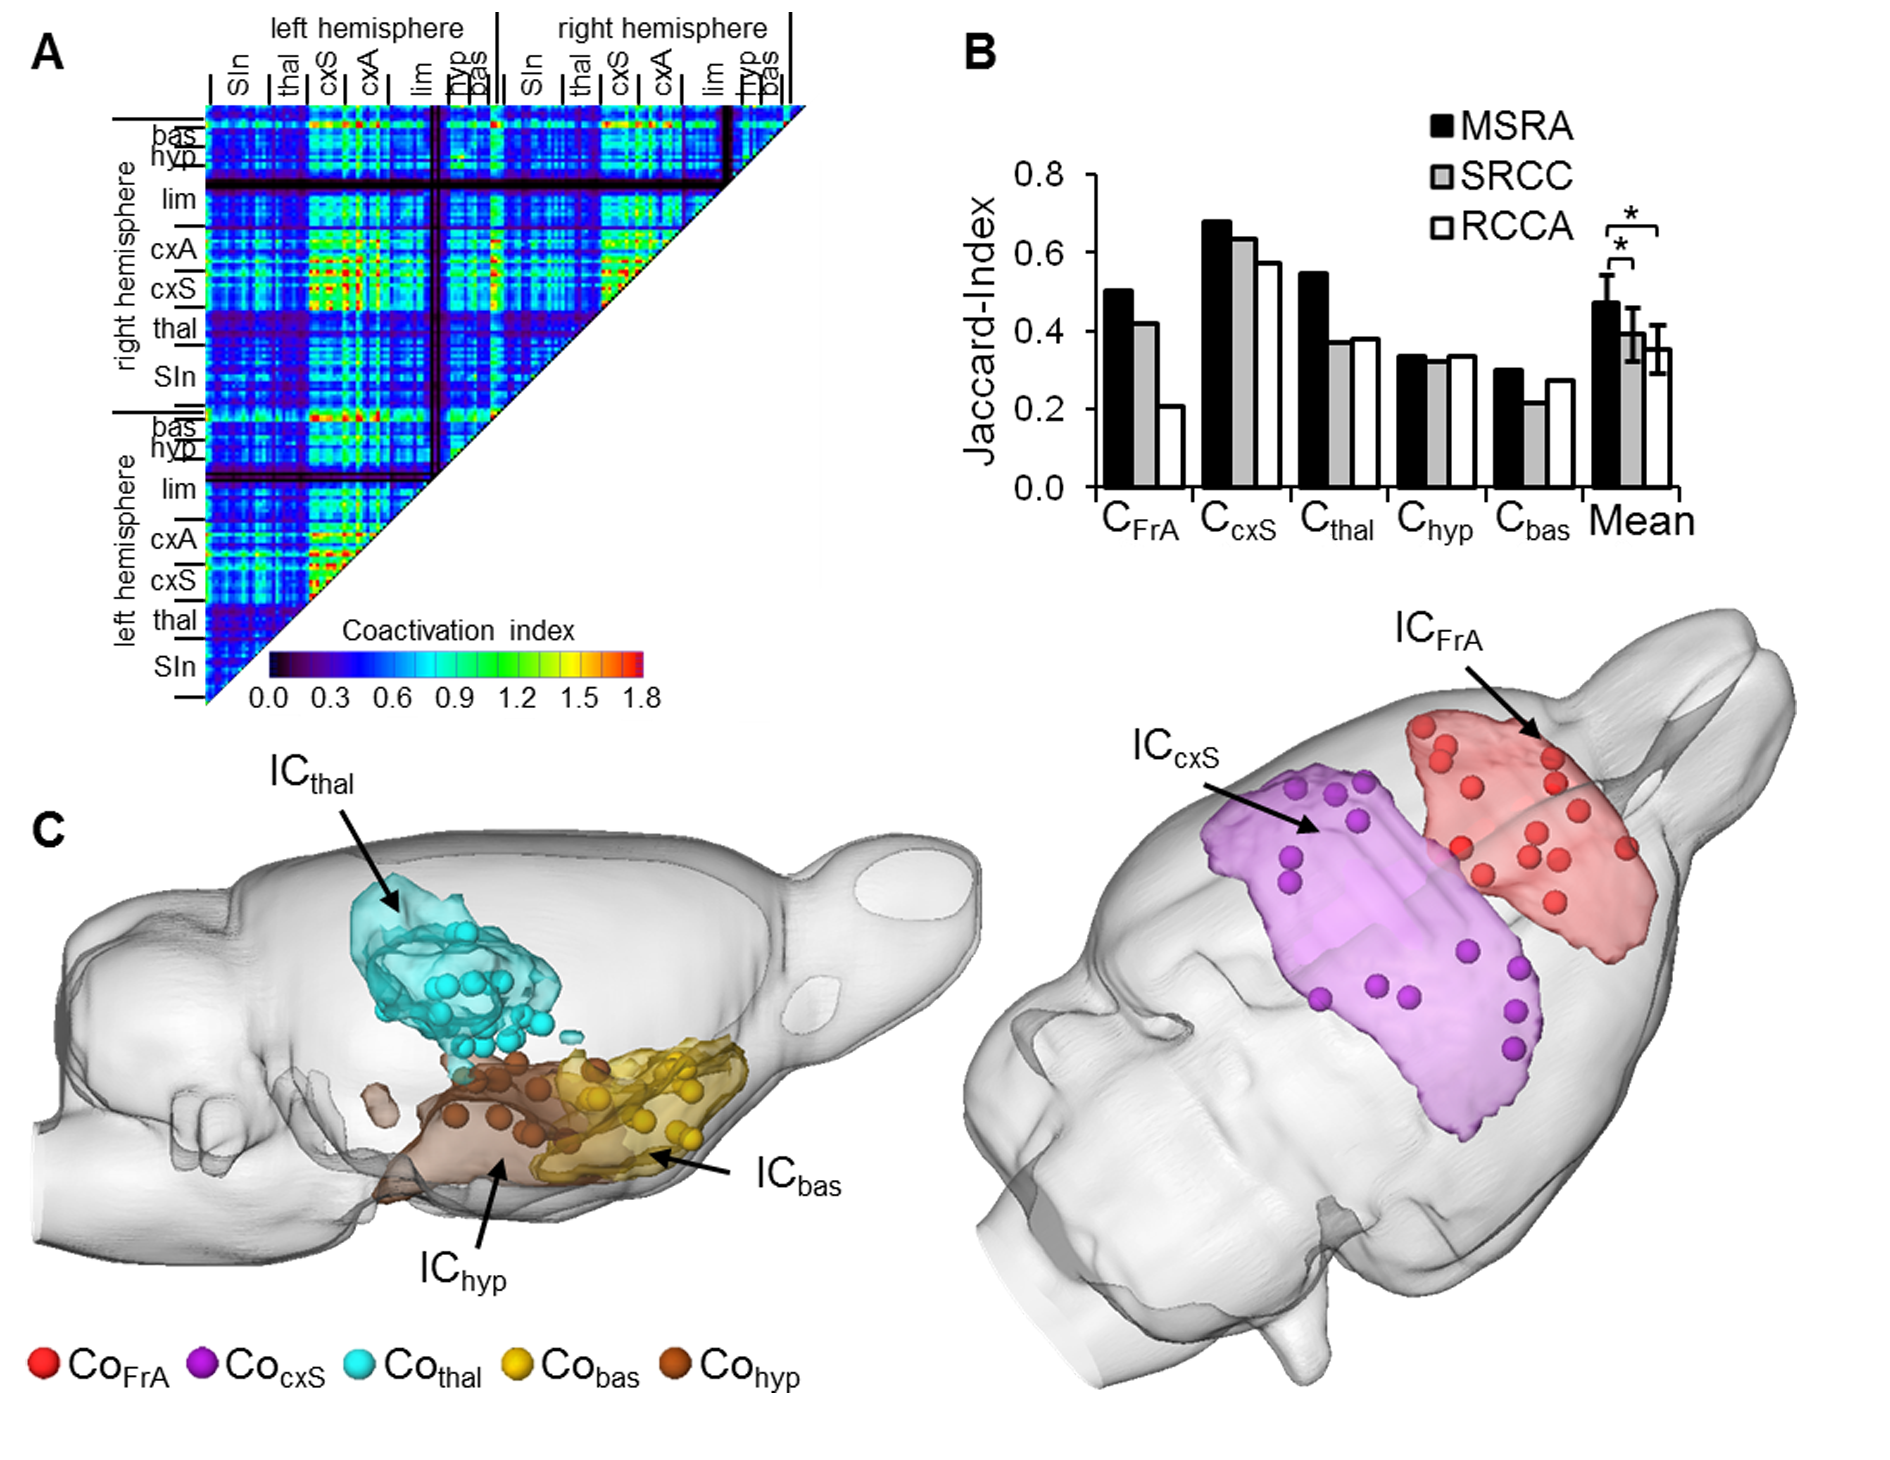
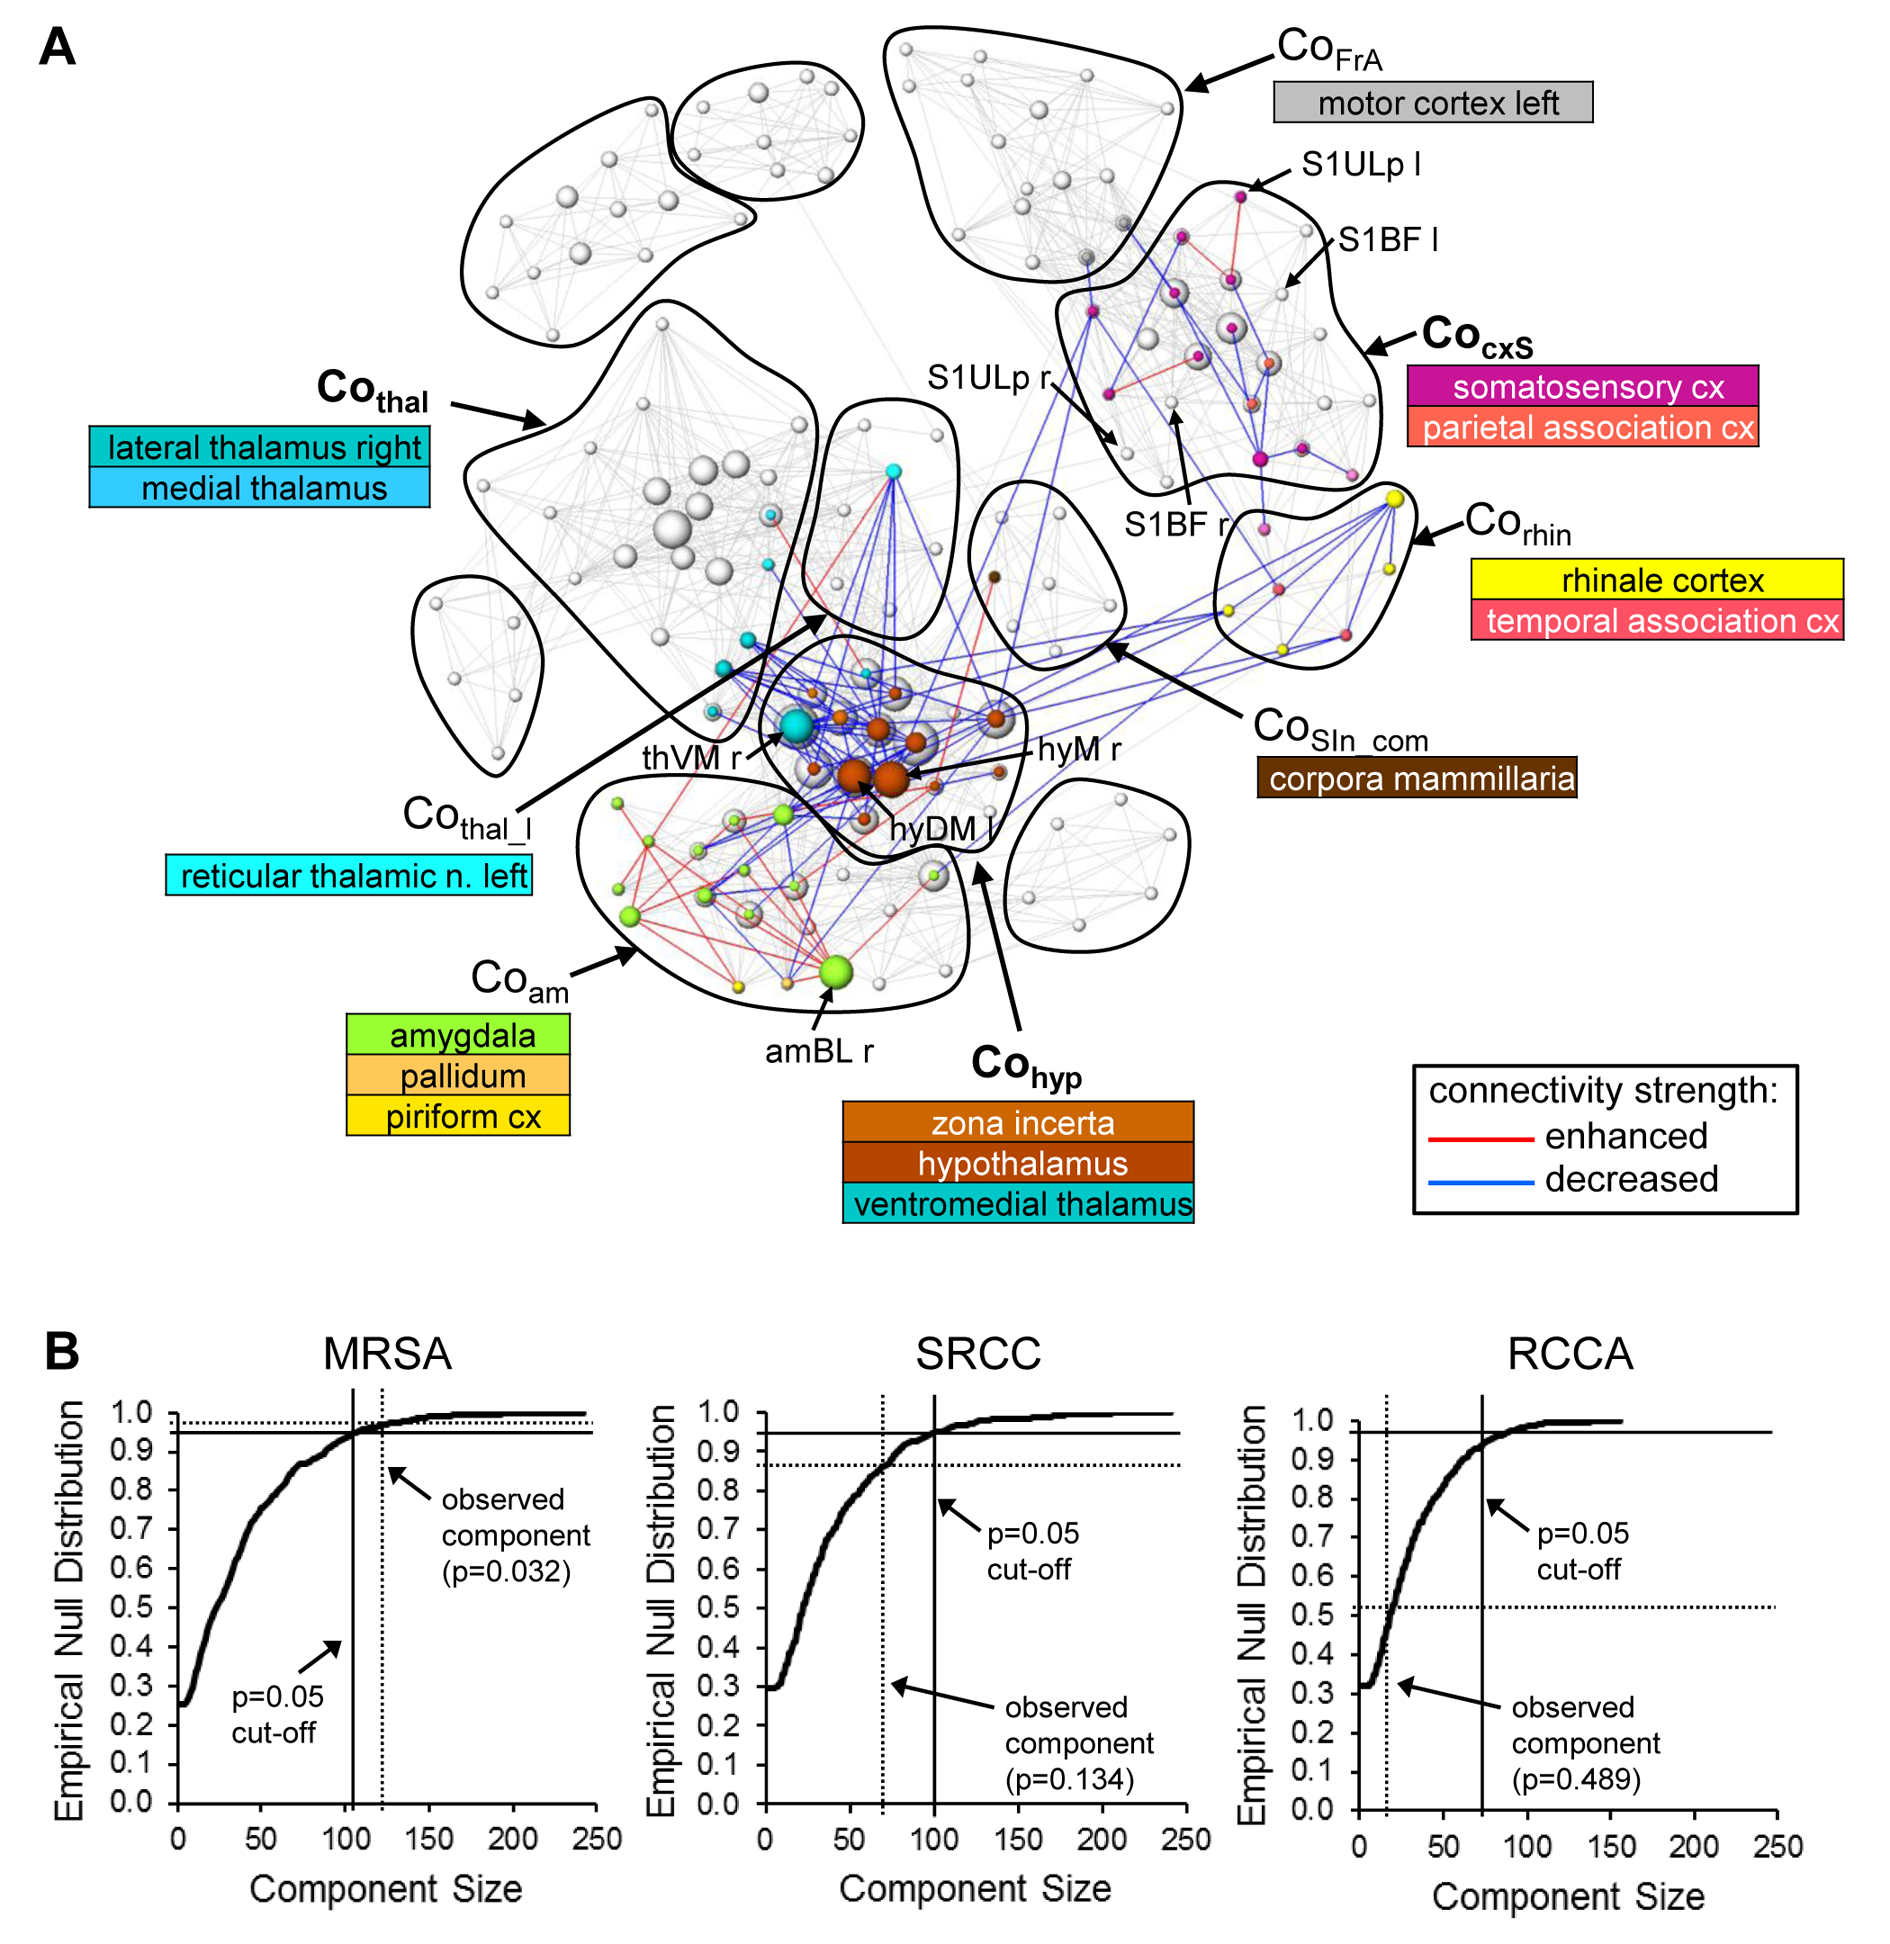
Data processing: Standard preprocessing was performed including interslice time and motion correction, spatial gaussian smoothing (FWHM 0.58 mm), low pass filtering at 0.1 Hz and regression of the global mean. Brain voxels were labeled individually for each animal as belonging to 179 pain related brain structures based on the rat atlas from Paxinos7. For method evaluation the first RS measurement of all animals was analyzed in 4 different ways: (1) ICA8 (GIFT, 20 independent components) and ICA co-activation index9, which is a product matrix of the average ICA z-scores per brain region. (2) The average time courses of all voxels per brain region were cross-correlated (RCCA). (3) A seed region (6 voxels) was placed automatically in the center of mass of each brain structure and the average time courses of the seed regions were cross-correlated (SRCC). (4) the average time course of each seed region was correlated with every voxel of the brain. After defining the FDR corrected significant correlation voxels an asymmetric correlation matrix was created with the mean significant correlation value per brain structure for each seed region (MSRA, Fig. 2). Significant short-term RS modulation were determined using an adapted network based statistics (NBS)10 version to cope with pairwise comparison of the two RS measurements (Fig. 1).
Results and Discussion
Graph-theoretical networks found with the MSRA approach were highly reproducible, and their communities showed largest overlaps with ICA components (Fig. 3). Additionally, MSRA was the only one of all tested methods that had the power to detect significant RS modulations induced by whisker stimulation that are controlled by family-wise error rate (FWE) (Fig. 4). Compared to the reduced RS network connectivity during task performance, these modulations implied decreased connectivity strength in the bilateral sensorimotor and entorhinal cortex. Additionally, the contralateral ventromedial thalamus (part of the barrel field related lemniscal pathway) and the hypothalamus showed reduced connectivity. Enhanced connectivity was observed in the amygdala, especially the contralateral basolateral amygdala (involved in emotional learning processes). In conclusion, MSRA is a powerful analytical approach that can reliably detect tiny modulations of RS connectivity. It shows a great promise as a method for studying RS dynamics in healthy and pathological conditions.Acknowledgements
This work was supported by the BMBF (grant numbers NeuroImpa 01EC1403C, NeuroRad 02NUK034D).References
1. Deco G, Corbetta M. The dynamical balance of the brain at rest. The Neuroscientist : a review journal bringing neurobiology, neurology and psychiatry. 2011;17(1):107-23.
2. Albert NB, Robertson EM, Miall RC. The resting human brain and motor learning. Current biology : CB. 2009;19(12):1023-7.
3. Tambini A, Ketz N, Davachi L. Enhanced brain correlations during rest are related to memory for recent experiences. Neuron. 2010;65(2):280-90.
4. Albieri G, Barnes SJ, de Celis Alonso B, Cheetham CE, Edwards CE, Lowe AS, et al. Rapid Bidirectional Reorganization of Cortical Microcircuits. Cereb Cortex. 2015;25(9):3025-35.
5. Alonso Bde C, Lowe AS, Dear JP, Lee KC, Williams SC, Finnerty GT. Sensory inputs from whisking movements modify cortical whisker maps visualized with functional magnetic resonance imaging. Cereb Cortex. 2008;18(6):1314-25.
6. de Celis Alonso B, Sergeyeva M, Brune K, Hess A. Lateralization of responses to vibrissal stimulation: connectivity and information integration in the rat sensory-motor cortex assessed with fMRI. Neuroimage. 2012;62(3):2101-9.
7. Franklin KBJ, Paxinos G. The Mouse Brain in stereotaxic coordinates. Academic Press, New York, 3 Ed. 2008
8. Calhoun VD, Adali T, Pearlson GD, Pekar JJ. A method for making group inferences from functional MRI data using independent component analysis. Human brain mapping. 2001;14(3):140-51.
9. Rosazza C, Minati L, Ghielmetti F, Mandelli ML, Bruzzone MG. Functional connectivity during resting-state functional MR imaging: study of the correspondence between independent component analysis and region-of-interest-based methods. AJNR American journal of neuroradiology. 2012;33(1):180-7.
10. Zalesky A, Fornito A, Bullmore ET. Network-based statistic: identifying differences in brain networks. NeuroImage 2010;53(4):1197-1207.
Figures