2412
Using graph theory measurements acquired from resting state fMRI data combine with machine learning methods to investigate abnormalities in temporal lobe epilepsy and classification.1Electrical and engineering, University of Wisconsin Madison, Madison, WI, United States, 2Radiology, University of Wisconsin Madison, Madison, WI, United States, 3Neurology, University of Wisconsin Madison, Madison, WI, United States, 4Medical Physics, University of Wisconsin Madison, Madison, WI, United States
Synopsis
Many studies has shown structural damage in TLE caused by seizure propagation. We use graph theoretical approach to look at network differences in TLE's brain in order to find abnormalities that may cause seizure. We find out that subcortical regions such as thalamus and hippocampus are abnormally more connected together and with cerebellar regions and these regions are generally less involved in transferring information to other part of the brain from graph theoretical respect of view. In other word, any information pulse that generated in these regions, will circulate faster within these regions which might be the reason for seizure.
Introduction
Graph analysis has been shown to be an effective tool to investigate brain functional abnormalities. Here, graph measurements are used to look at group differences between patients and healthy control, and beyond that to investigate effectiveness of these measurements for patient’s classification.Methods:
Thirty-two TLE subjects (age 40.09±12.4 years, 20 female,21 left TLE) and eighty-five age, gender and handedness matched healthy control (HC) (age 39.7±16.9 years, 48 female) participated in the study. Eyes-closed resting-state fMRI scans were collected along with high resolution T1 weighted anatomical scans on 3T GE MRI scanners.
Preprocessing of images was done using AFNI software. The first three volumes from the acquisition were removed. All images were then corrected for slice timing differences and realigned for head motion correction between volumes. Images were next spatially normalized to Talairach coordinates and smoothed to 4 mm full-width half maximum (FWHM) Gaussian Kernel. CSF and white matter (WM) signal were regressed out along with six motion parameters and a temporal band-pass filter (0.01 Hz ˂ f ˂ 0.1 Hz) applied.
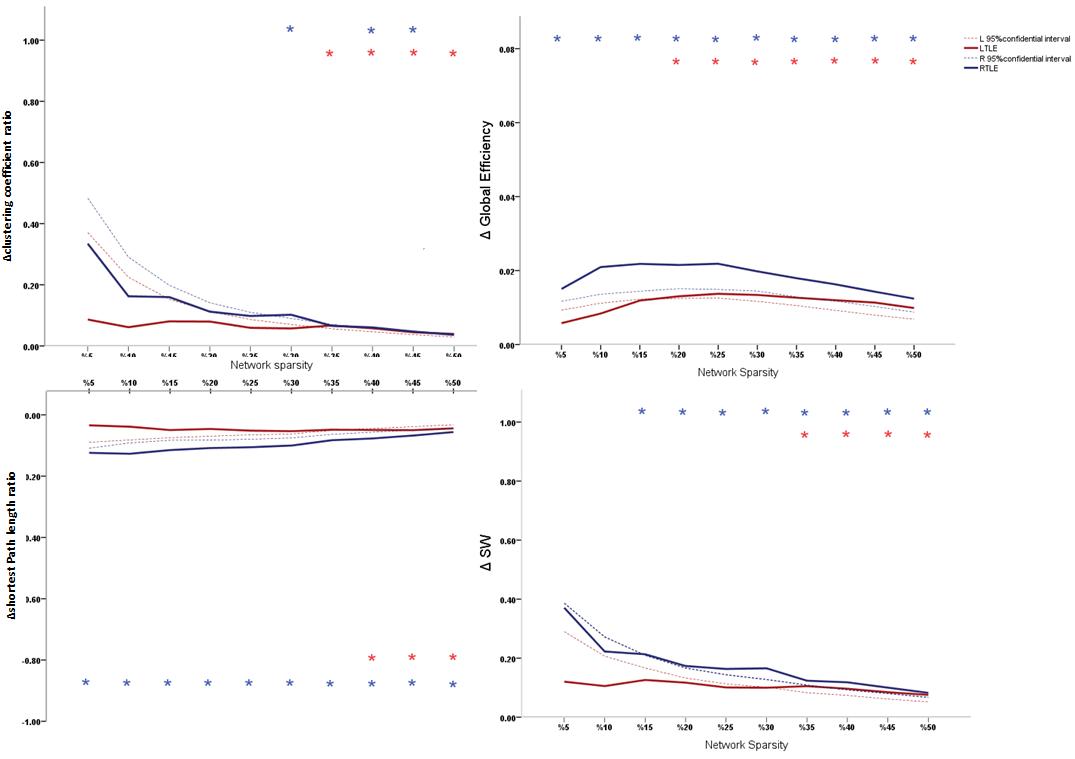
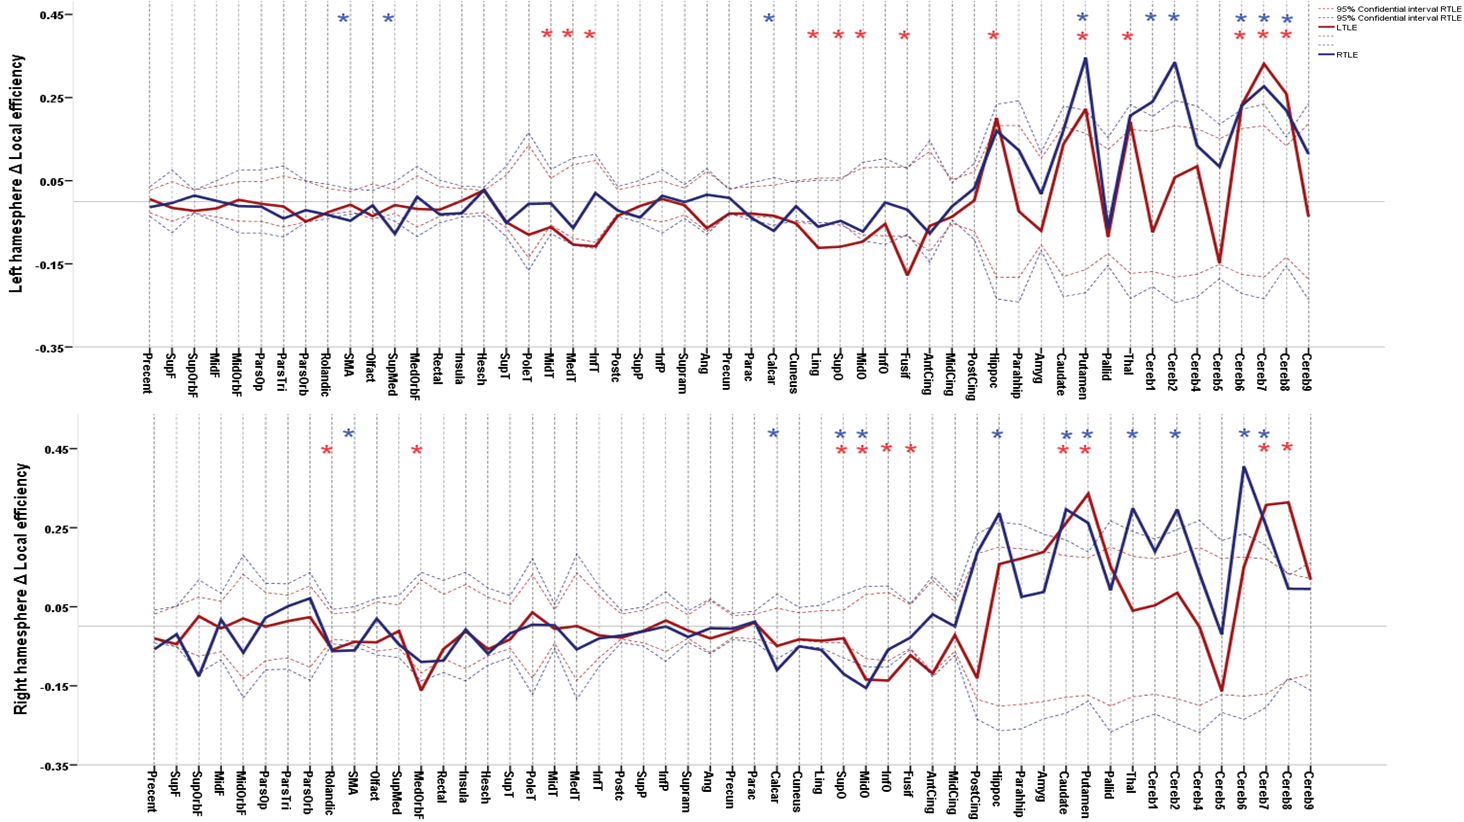
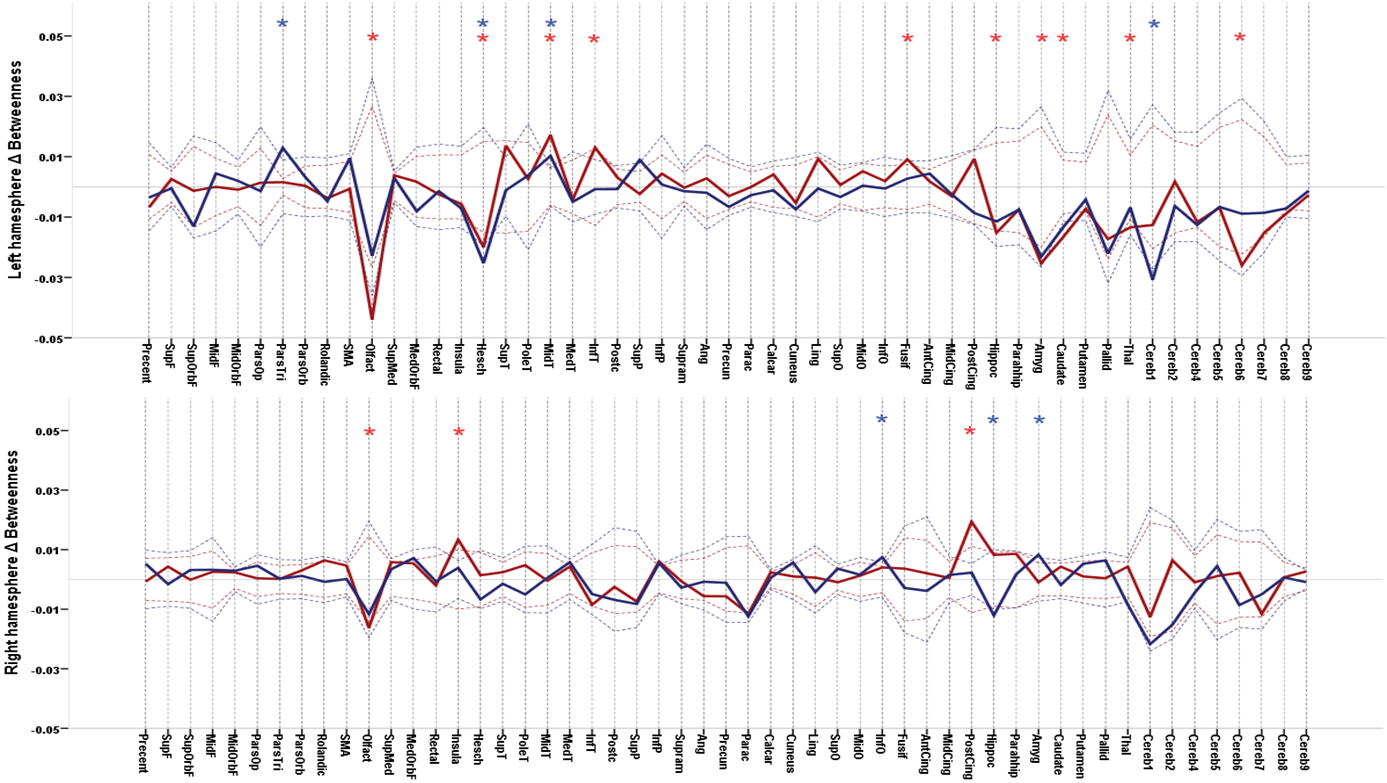
106 anatomically defined ROI were used from TT Daemon template as nodes of the subjects’ brain network.These ROIs were used to drive Pearson correlation coefficient matrices from each subject’s r-s fMRI resulting in 106 ×106 adjacency matrices. By using minimum spanning tree (to guarantee connectedness) combined with proportional thresholding on these matrices, binary undirected connection matrices for each subject were obtained in different network sparsity. These matrices were then used to study networks’ measurements. Local efficiency and Betweenness centrality were used to investigate network integration and hubs respectively at the individual regions level. Clustering coefficient C and average shortest path length L were calculated and compared with a random network with the same number of nodes and degree with 1000 re-wiring for each subject, resulting in a clustering ratio C/Cr and shortest path length ratio L/Lr[1]. Small worldness (SW) was then calculated via dividing C/Cr by L/Lr [2] and these measures as well as global efficiency is used to investigate network topology globally. Global measures were calculated in a range of 5% to 50% and local measures were calculated in 16% of graph density [3]. Statistical analysis were assessed using nonparametric permutation test with 1000 repetitions in order to investigate significant differences of each TLE’s group mean with control’s mean as well as together . Significant differences were defined as P < 0.05 corrected for multiple comparisons using False Discovery Rate (FDR).
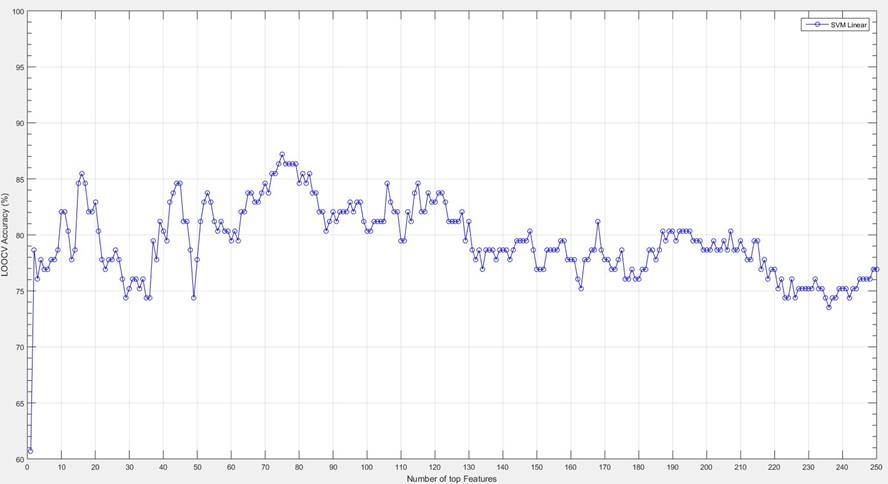
Support vector machine (SVM) with linear kernel were trained to separate between TLE and HC based on these graph measurements. Leave-one-out-cross-validation (LOOCV) is used for estimating the model performance [4].
Results
Between LTLE and RTLE, we didn’t find any significant differences. Both groups show significantly higher global efficiency and Clustering coefficient ratio and lower shortest path lengths ratio compared witth HC in various network sparsities. SW was higher in TLEs compared to HC in almost all densities. These indicate that brain network of TLEs are closer to random network and is less segregated. In individual regions, Both LTLE and RTLE show significantly higher from HC in subcortical and cerebellar regions. In addition LTLE (group with higher number of subjects) shows significantly lower local efficiency compared to HC in temporal lobe and occipital regions while local efficiency of RTLE was lower in these regions but it wasn’t significant. Centralities of most subcortical and cerebellar regions were lower in both TLEs compared to HC which is an indication of decrease in importance of these regions in information transferring through the network. Finally, we were able to separate TLE from HC with 87.17 % accuracy using 75 top features of graph measurements and 85.16% by using just 16 top features using SVM classifier.Discussion
TLEs’ brain network was significantly less segregated than controls, as an indication of less robust network. Higher SW shows that information circulates faster in the network, causes it to be less specialized for functional processes. Higher local efficiency and at the same time lower centrality in cerebellum and subcortical regions in EPIs indicate higher interaction between these regions together and lower interaction with other parts of the network parts of the brain in EPI compare to HC. High accuracy of classifier shows that graph theory is a promising way to differentiate TLEs’ brain network.Conclusion
This study shows that in TLEs, subcortical and cerebellar regions are less synchronized to other part of the brain and has more connection together. Effect of thalamus removal in decreasing this abnormally tense communications and correlation of that with seizure outcomes is needed to study.Acknowledgements
The American Society of Functional Neuroradiology (ASFNR).
NIH/NIGMS* and the Foundation of ASNR.
University of Wisconsin-Madison, Madison, WI, USA.
References
1. Maslov S, Sneppen K. Specificity and stability in topology of protein networks. Science. 2002;296:910–913.
2. Humphries MD, Gurney K. Network ‘small-world-ness’: a quantitative method for determining canonical network equivalence. PLoS ONE. 2008;3:e0002051.
3. Bullmore E, Sporns O (2012) The economy of brain network organization. Nature Reviews Neuroscience 13: 336–349.
4. Elisseeff A, & Pontil M. (2003) Leave-one-out error and stability of learning algorithms with applications. NATO Science Series, III: Computer and Systems Sciences,190:111-30.
Figures