2411
Investigation of Physiological Variability Effects on fMRI Dynamic Functional Connectivity using Independent Component Analysis1Electrical and Computer Engineering, University of Cyprus, Nicosia, Cyprus, 2KIOS Research and Innovation Center of Excellence, Nicosia, Cyprus, 3Cardiff University Brain Research Imaging Center (CUBRIC), School of Psychology, Cardiff University, Cardiff, United Kingdom, 4Department of Bioengineering, McGill University, Montreal, QC, Canada
Synopsis
The BOLD fMRI signal is influenced not only by neuronal activity but also by fluctuations in physiological signals. It has been shown that estimates of resting dynamic functional connectivity (DFC) may be confounded by the effects of physiological signal fluctuations. Here we examine the relation between DFC patterns for the DMN, visual and somatosensory networks and the time-varying properties of simultaneously recorded end-tidal CO2 and HR signals by using resting-state fMRI data and several variants of ICA. A modulatory effect, which was more pronounced in specific frequency bands, of the physiological signals on the resting DFC patterns is revealed.
Introduction
Τhe BOLD fMRI signal is influenced by fluctuations in physiological signals, including arterial CO2 and heart rate. Even spontaneous physiological signal fluctuations have been shown to influence the BOLD fMRI signal in a regionally specific manner [1,2]. Consequently, estimates of functional connectivity between different brain regions, performed when the subject is at rest, may be confounded by the effects of physiological signal fluctuations. Moreover, resting functional connectivity has been shown to vary with respect to time (DFC), with the sources of this variation not fully elucidated. The effect of physiological factors on dynamic (time-varying) resting-state functional connectivity has not been studied extensively, to our knowledge. In our previous study [3], we investigated the effect of heart rate (HR) and end-tidal CO2 (PETCO2) on the time-varying network degree of three well-described RSNs and identified brain-heart interactions which were more pronounced in specific frequency bands. Here, we extend this work, by estimating DFC and its corresponding network degree for the DMN, visual and somatosensory RSNs, employing a data-driven approach to extract the RSNs (low- and high-dimensional and spatial sliding window Independent Component Analysis (ICA)), which we subsequently correlate with the characteristics of simultaneously collected physiological signals.Materials and Methods
Eyes-closed resting-state fMRI data were acquired from 12 healthy volunteers at 3T (TR=3sec, 7 males, aged 29.2 ± 4.6 years) with PETCO2 and cardiac monitoring. After rigid body motion correction using and skull removal for functional images using the BET function from FSL [4], ICA analysis was carried out, using FSL 5.0.9 (MELODIC). Single-subject ICA was performed using: 1) the entire time series consisting of all 210 brain volumes imaged and 2) spatial sliding window ICA (Spatial-Sliding-ICA) [5].
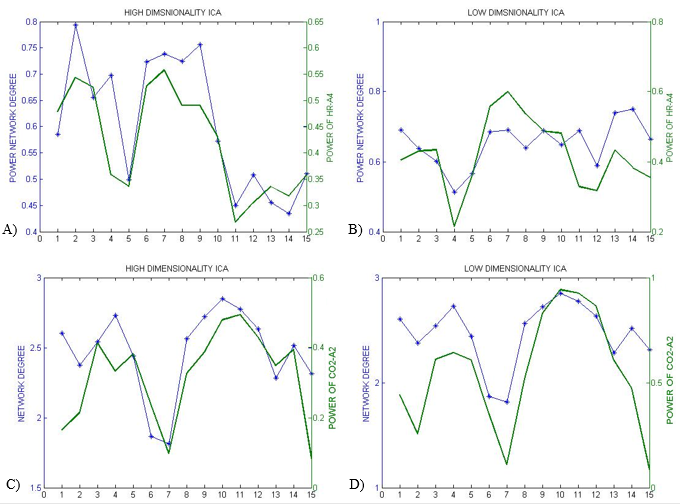
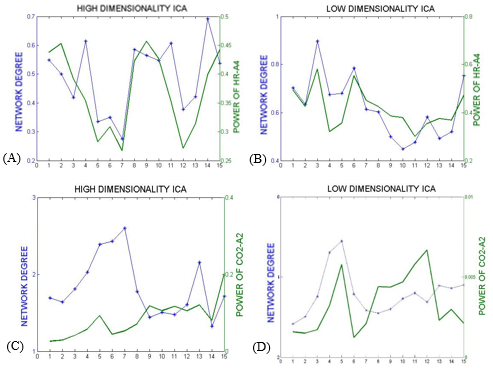
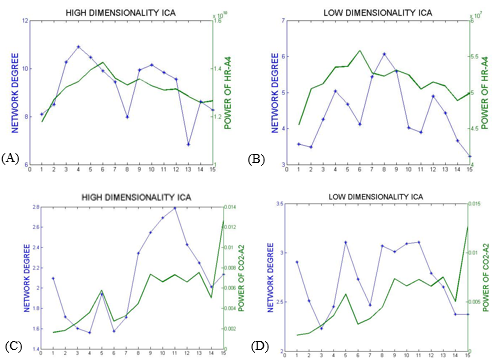
In the first approach, the ICs that most resembled the DMN, visual and somatosensory networks were extracted (selection from 25 ICs for low-dim and 70 ICs for high-dim). The overall time-varying connectivity of each network was quantified by computing the graded network degree of the corresponding ICs in sliding windows of 150 seconds (50-time lags), overlapped by 30 seconds (10-time lags). Specifically, the graded degree is defined as:$$k_i^w=\sum_j^NW_{ij}$$ where N is the number of brain regions in the network and $$$W_{ij}$$$ is the absolute average correlation value (within ±5lags) between the network nodes i and j. The Welch-based PSD [6] of the PETCO2 and HR signals was also calculated within the same sliding windows in a range of 0±5-time lags.
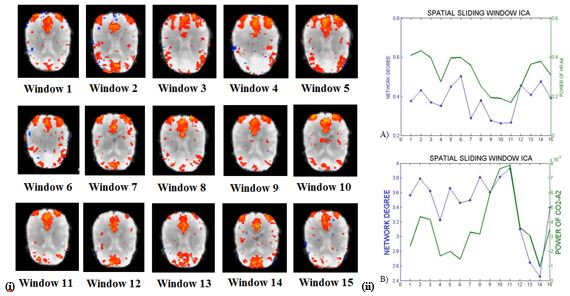
Then, Spatial-Sliding-ICA was performed by cropping the original 210 brain volume-imaged dataset into spatial windows of 50 volumes and sliding these by 10 volumes at a time, yielding 15 volume-windows. Low-dimensionality ICA was then applied to each window to select the ICs that most resembled the DMN and correlate their corresponding network degree with the power of the simultaneously-recorded physiological signals. The spatial stability of the DMN was analyzed by measuring the spatial correlation of the detected DMN Spatial-Sliding-ICA sources using FSL (fslcc) by comparing a commonly used DMN template for every individual.
Lastly, 5-level wavelet decomposition was applied to the PETCO2 (sampled at 1/3Hz) and HR (sampled at 4Hz) signals, and correlations with the corresponding time-varying RSN degree were calculated within all the resulting frequency sub-bands. Additionally, the modulating effect of the time-varying physiological signals power on the time-varying RSN degree was quantified by calculating the Spearman rank correlation coefficient.
Results
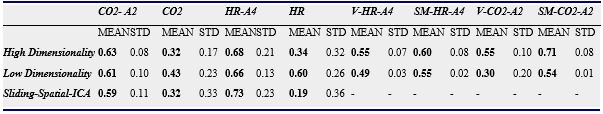
The Spearman rank correlation coefficients between time-varying DMN, visual and somatosensory degree and band-limited PETCO2/HR power are given in Table 1 for all subjects (mean ± standard deviation). These suggest the presence of temporal correlations between network degree and the PETCO2/HR power. The high dimensionality ICA yielded a higher number of components corresponding to each RSN for calculating the network degree compared to low dimensionality ICA. The “Sliding-Spatial-ICA” approach was used only for the DMN and yielded either similar or higher results compared to the other methods.
Discussion
The results reveal a clear effect of time-varying signal power for both HR and PETCO2 on the time-varying network degree for the DMN, visual and somatosensory networks, revealing brain-heart interactions in the context of fMRI-based RSN connectivity studies (Fig. 1-4, Table 1). This effect was found to be more pronounced for the fluctuations in the physiological spectral content in specific frequency sub-bands (time-varying band-limited power), as revealed by wavelet analysis.Conclusion
The dynamic relation between functional connectivity and physiological signals in the resting state using ICA was investigated for three well-described RSNs. The results reveal a modulatory effect (which is more pronounced in specific frequency bands) of the physiological signals on the dynamic resting functional connectivity patterns for these RSNs.Acknowledgements
No acknowledgement found.References
[1] Wise RG, Ide K, Poulin MJ, Tracey I. 2004 Resting fluctuations in arterial carbon dioxide induce significant low frequency variations in BOLD signal. Neuroimage 21, 1652–1664. (doi:10.1016/j.neuroimage.2003.11.025)
[2] Napadow V, Dhond R, Conti G, Makris N, Brown EN, Barbieri R. 2008 Brain correlates of autonomic modulation: combining heart rate variability with fMRI. Neuroimage 42, 169–177. (doi:10.1016/j.neuroimage.2008.04.238)
[3] Nikolaou F, Orphanidou C, Papakyriakou P, Murphy K, Wise RG, Mitsis GD, “Spontaneous physiological variability modulates dynamic functional connectivity in resting-state functional magnetic resonance imaging”. Phil. Trans. R. Soc. A 374: 20150183, 2016.
[4] S. M. Smith, M. Jenkinson, M. W. Woolrich, C. F. Beckmann, T. E. Behrens, H. Johansen-Berg, P. R. Bannister, M. De Luca, I. Drobnjak, D. E. Flitney, R. K. Niazy, J. Saunders, J. Vickers, Y. Zhang, N. De Stefano, J. M. Brady, and P. M. Matthews, “Advances in functional and structural MR image analysis and implementation as FSL.,” Neuroimage, vol. 23 Suppl 1, pp. S208–19, 2004.
[5] A. V Oppenheim and R. W. Schafer, Discrete-Time Signal Processing, 3rd editio. Prentice-Hall Signal Processing Series, 2009. [6] O. Dipasquale, L. Griffanti, M. Clerici, R Nemni1, G. Baselli and F. Baglio, “High-dimensional ICA analysis detects within-network functional connectivity damage of default-mode and sensory-motor networks in Alzheimer’s disease,” Human Neuroscience, doi: 10.3389/fnhum.2015.00043.
Figures