2408
Probing functional connectivity and network modelling from perfusion neuroimaging with Arterial Spin Labeling1Department of Computer Science, University of Verona, Verona, Italy, 2Department of Neuroradiology, University Hospital Verona, Verona, Italy, 3King's College London, London, United Kingdom, 4Institute of Nuclear Medicine, University College London, London, United Kingdom
Synopsis
Nowadays, the assessment of brain functional connectivity (FC) patterns, ranging from resting-state networks to network modelling, can rely on Arterial Spin Labeling (ASL) MRI as an alternative to the gold-standard sequence represented by the blood-oxygenation-level-dependent contrast. We evaluated FC mapping from different perspectives (experimental protocols, populations and analysis methods), trying to overcome some of the present challenges related to the ASL applicability in this framework. The results demonstrate how FC patterns and changes can be reliably detected using ASL, with the added value of allowing the simultaneous quantification of brain perfusion, a direct marker of neuronal activity.
Introduction
The study of functional connectivity (FC) from neuroimaging data has become an increasingly active field of research, providing novel insights into normal functions and disruptions in pathologies. Functional magnetic resonance imaging (fMRI) based on the blood-oxygen-level-dependent (BOLD) contrast is currently widely used for FC characterisation. Nevertheless, this approach has several shortcomings as BOLD is not neuronally specific, not quantitative and often contaminated by draining veins. Arterial Spin Labeling (ASL) represents a viable alternative serving as a more physiological marker for FC analyses. ASL-based FC is an innovative approach, but its effective feasibility for connectivity mapping is still largely unexplored1,2,3. The purpose of this work is to review our experience in the performance of ASL-based FC analyses and to illustrate how some of the present challenges related to the ASL applicability in this framework can be coped.Methods
Among all the methods developed for investigating FC, the most common ones are: i) correlation-based methods, used to characterise the extent to which brain signals from different regions of interest (ROIs) are related; ii) data-driven methods, as Independent Component Analysis (ICA), employed to identify networks at rest (RSN) that share similar patterns4. In addition, network modelling based on graph-theory enables the study of FC by extracting significant aspects of network organization5. While these approaches have proved to give reliable results with BOLD, we analysed these complementary aspects with ASL to assess whether:
1) ASL can identify the common RSNs generally reported with BOLD-fMRI, in both healthy and diseased states (ICA-based analyses);
2) ASL can characterise the functional relationships between distinct regions and discriminate between experimental conditions (ROI-to-ROI correlation analyses);
3) ASL can disentangle the physiological link between FC, as summarised by local graph-based descriptors as node centrality, and cerebral blood flow (CBF), a direct marker of neuronal activity.
To investigate these features, we employed two different datasets: 1) pulsed ASL resting-state data on 10 controls (HCrest) and 10 patients with drug-resistant right temporal epilepsy (PTrest); 2) pseudo-continuous ASL data on 13 controls who underwent both resting-state (REST) and a task-based block paradigm alternating between three conditions (baseline, hand movement [MOT] and motor imagery [IMA]). Considering the inherently low temporal resolution of ASL, we analysed the whole ASL time-course rather than performing Control/Label subtractions, as already proposed for task-based GLM analyses6, and applied appropriate preprocessing and denoising steps, depending on the experimental dataset (e.g., nuisance regression+bandpass/ICA-based filtering).
Results
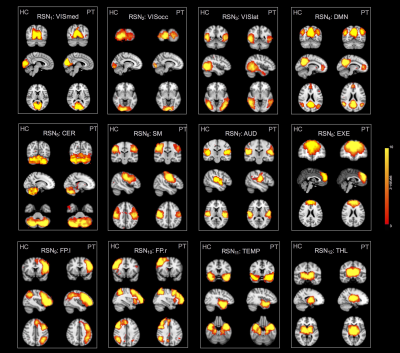
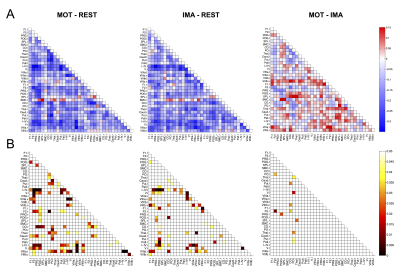
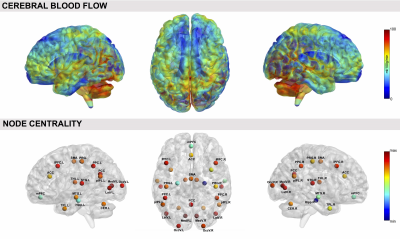
Regarding RSNs, we firstly found that ASL was able to identify the main network (DMN) along with all the others generally detected with BOLD but never previously reported from ASL, in both resting-state datasets (Figure1). When we compared HCrest vs PTrest, group differences were identified in the structure of some networks (significant FC decreases in patients within DMN and Cerebellum (CER), while the opposite pattern was found in few cases, as the Visual and Temporal RSNs). In terms of FC matrices, ASL datasets at rest highlighted strong pairwise correlations, especially between areas belonging to the same network. ASL was able to identify dysfunctional links between HCrest and PTrest, showing hypoconnectivity between areas within the DMN or between the right-left Temporal Lobe. For dataset2, few connections revealed statistical changes between rest and tasks, in particular decreased correlations were detected as significant in MOT/IMA vs REST, for example between cortical-subcortical regions or right-left CER (Figure2), as we preliminary described in1. CBF maps and node centrality values estimated at group level from HCrest data are reported in Figure3. When group CBF and centrality values were compared for the same set of nodes (30 and 139 for dataset1 and 2, respectively), a positive linear trend was found in both resting-state datasets (dataset1:R=0.417, p=0.02; dataset2:R=0.502, p<0.001).Discussion
In this work, we demonstrated how ASL can be employed to assess multiple aspects of brain functioning, both in physiological or pathological states. First of all, ASL is able to identify the common RSNs traditionally reported in literature4 and detect within-network FC changes related to epileptic activity. FC matrices highlighted high positive correlations between different areas, possibly related to the fact ASL signals depend only on CBF changes, and were able to discriminate between different conditions/states. Finally, a positive connectivity-flow relationship was found in controls, independently from the ASL sequence employed, in line with previous studies demonstrating a close link between connectivity hub and energy consumption7.Conclusions
All these complementary aspects allow to further prove the ASL potentialities for quantitatively mapping brain activity under different conditions. Despite its technical challenges, ASL has a high translational value and can be effective in enhancing the current understanding of vascular-connectivity dynamics.Acknowledgements
No acknowledgement found.References
1. Storti SF, Boscolo Galazzo I, Pizzini FB et al. Dual-echo ASL based assessment of motor networks: a feasibility study. J Neural Eng. 2017 Sep 8. doi: 10.1088/1741-2552/aa8b27
2. Liang X, Zou Q, He Y et al. Coupling of functional connectivity and regional cerebral blood flow reveals a physiological basis for network hubs of the human brain Proc. Natl Acad. Sci. USA 2013;110:1929–34
3. Jann K, Gee DG, Kilroy E, et al. Functional connectivity in BOLD and CBF data: similarity and reliability of resting brain networks. Neuroimage 2015; 106:111-22
4. Smith SM, Fox PT, Miller KL, et al. Correspondence of the brain's functional architecture during activation and rest. Proc Natl Acad Sci U S A. 2009; 106:13040-5
5. Bullmore E and Sporns O. Complex brain networks: graph theoretical analysis of structural and functional systems Nat. Rev. Neurosci. 2009; 10: 186–98
6. Mumford JA, Hernandez-Garcia L, Lee G R et al. Estimation efficiency and statistical power in arterial spin labeling fMRI Neuroimage 2006; 33:103–14
7. Tomasi D, Wang GJ, Volkow ND. Energetic cost of brain functional connectivity. Proc Natl Acad Sci USA 2013; 110:13642–13647
Figures


