2407
Adaptive global signal regression for resting-state functional connectivity MRI1Biomedical Engineering Graduate Program, University of Calgary, Calgary, AB, Canada, 2Department of Radiology, Hotchkiss Brain Institute, University of Calgary, Calgary, AB, Canada
Synopsis
One of the primary steps in exploring resting-state functional connectivity MRI is to identify and remove the global signal (GS). Plenty of methods have been proposed for this. However, the majority of them are based on an averaging approach known to produce spurious connectivity values. In this work, we used a nonlinear adaptive method to construct voxel-specific GS. The method is tested for task-positive, task-negative and reference ROIs by computing the Pearson correlation coefficient. Our results show a high level of precision for the proposed approach, while the conventional method could not provide an accurate brain functional mapping.
Introduction
Resting-state functional connectivity MRI (fcMRI) is a highly popular method for mapping functional brain networks. However, a significant problem with the fcMRI analysis is the presence of a common global systemic noise, or global signal (GS), in all voxels, which affects the estimation of the functional networks.1 Previous studies have shown that the common preprocessing step of removing the GS via a general linear model creates spurious fcMRI results.2-4 GS is generally defined as the mean time course across the whole brain.5 However, correlation maps extracted by the aforementioned method are known to present artefactual values.2-4 Here, we defined an adaptive global signal regression (aGSR), that is voxel-specific, by performing a spatio-temporal decomposition of the fMRI time series. The Spatial and Temporal Intrinsic Mode Functions (SIMF and TIMF respectively) are acquired by applying FATEMD6 and ICEEMDAN7 methods, which are based on Empirical Mode Decomposition (EMD)8, an adaptive data-driven method widely used to analyze nonlinear and nonstationary phenomena.
Given the high value obtained for large-scale measures such as transitivity, in the low spatial maps (SIMF3, 4, and 5), our results suggest that these maps can be considered as spatial global signal masks. Additionally, we compared the performance of our method with the conventional GSR (or static GSR, sGSR) method, and to the results when the GS was not removed. While the correlation pattern identified by the other methods suffer from a low level of precision, our method demonstrated a high level of accuracy due to its data-driven adaptive nature.
Method
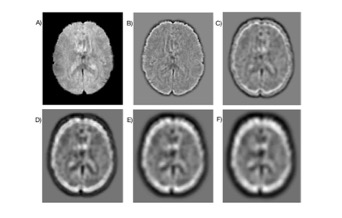
fMRI dataset for 8 subjects from HCP9 were used to apply FATEMD to decompose the resting-state fMRI data into three-dimensional SIMFs. Figure 1, shows the decomposition result of a sample fMRI.
Then, ICEEMDAN method was applied to decompose each SIMF into its corresponding TIMFs. TIMFs and SIMFs are examined to explore the spectral information of fMRI signals. Functional connectivity matrices are constructed by computing correlation coefficients between all possible pairs of SIMFs and TIMFs for all brain regions comprised in the AAL 116 atlas.10 Thus, instead of the classical functional connectivity matrix, the decomposition presented here produces 5*3 = 15 connectivity matrices, 5 spatial domains and 3 temporal domain including slow 1,2 and 3 for TIMF 1, slow 4 as TIMF 2, and slow 5 and 6 as TIMF 3, encompassing the rich spatiotemporal dynamics of brain activity. Transitivity is used as a measure of segregation, since it quantifies the presence of clusters within the brain network. Finally, the efficacy of our proposed approach is examined by computing the connectivity map between the time course in PCC (posterior Cingulate Cortex) region as a seed region and some of the task-positive network (TPN) and task-negative network (TNN) ROIs.11
Results
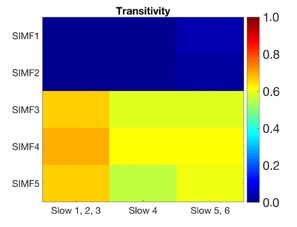
Transitivity results for each SIMF and TIMF are computed and shown in figure 2. The high level of transitivity in the low frequencies of spatial domains, SIMF 3,4 and 5, indicate that active shared connections exist between all the nodes in the brain, suggesting the existence of GS in the low-frequency spatial domain. However, in the first and second spatial domain, there are not plenty of active connections among all the nodes which decline the level of the transitivity significantly. Furthermore, the magnitude of the transitivity does not significantly depend on the TIMF, i.e., the different temporal domain extracted by the frequency of oscillation does not contribute any extra information about the GS.
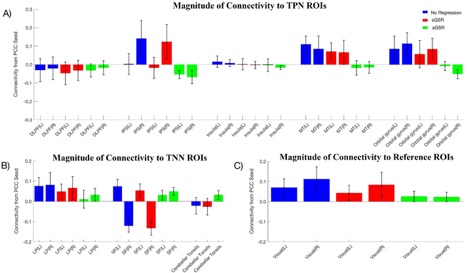
We used the summation of SIMF1 and SIMF2 to compute the functional connectivity between PCC and TPN, TNN, and visual cortex. The correlation between the PPC and TPN, TNN, and visual cortex regions were computed by using the Pearson correlation coefficient, P<0.05 and FDR<0.01. Figure 3, shows that, while the non-GSR and sGSR are unable to identify the accurate results for TPN, TNN and the reference ROIs (visual regions), the aGSR approach obtained a correct functional connectivity.
Discussion
Previous methods for computing GS were based on the averaging approach for the entire brain without considering the possibility of spatial heterogeneities in the GS.1,2 In this work, aGSR is used to explore the fcMRI in the resting state. As it is an adaptive method, we have a unique local signal for each voxel which augments the precision of the fcMRI results.Conclusion
The proposed method is able to correctly identify fcMRI, leading to better understanding of how information flows in the brain.Acknowledgements
No acknowledgement found.References
1. S. B. Erdogan, Y. Tong, L. M. Hocke, K. P. Lindsey, B. deB Frederick, Correcting for blood arrival time in global mean regression enhances functional connectivity analysis of resting state fMRI-BOLD signal, Front. Hum. Neurosci., 10, 2016, 311.
2. Saad, Z.S., Gotts, S.J., Murphy, K., Chen, G., Jo, H.J., Martin, A., Cox, R.W., Trouble at rest: how correlation patterns and group differences become distorted after global signal regression. Brain Connect., 2 (1), 2012, 25–32.
3. Murphy, K., Birn, R.M., Handwerker, D.A., Jones, T.B., Bandettini, P.A., The impact of global signal regression on resting state correlations: are anti-correlated networks introduced? NeuroImage. 44 (3), 2009, 893–905.
4. Murphy, K., Fox, M.D., November 2017. Towards a consensus regarding global signal regression for resting state functional connectivity MRI. NeuroImage (in Press), DOI: 10.1016/j.neuroimage, 2016, 11.052. 5. Liu, T.T., Nalci, A., Falahpour, M., The global signalin fMRI: Nuisance or information? Neuroimage, 150, 2017, 213-229.
6. Riffi, J., Mahraz, A. M., Abbad, A., Tairi, H., 3D extension of the fast and adaptive bidimensional empirical mode decomposition. Multidim Syst Signal Process, 2014, 1–12.
7. Colominas, M. A., Schlotthauer, G., Torres, M. E., Improved complete ensemble EMD: A suitable tool for biomedical signal processing, Biomed. Signal Process. Control, 14, 2014, 19–29.
8. Huang, N. E., Shen, Z., Long, S. R., Wu, ML., Shih H. H., et al., The Empirical mode decomposition and Hilbert spectrum for nonlinear and nonstationary time series analysis. Proc. R. Soc. London Ser.,A 454,1998, 903–95.
9. Moeller, S., Yacoub, E., Olman, C. A., Auerbach, E., Strupp, J., , et al., Multiband multislice GE-EPI at 7 tesla, with 16-fold acceleration using partial parallel imaging with application to high spatial and temporal whole-brain fMRI. Magn Reson Med., 63(5), 2010,1144-1153.
10. Tzourio-Mazoyer, N., Landeau, N., Papathanassiou, B., Crivello, D., Etard F., et al., Automated anatomical labeling of activations in SPM using a macroscopic anatomical parcellation of the MNI MRI single-subject brain. NeuroImage, 15, 2002, 273–289.
11. Fox, M. D., Snyder, A. Z., Vincent, J. L., Corbetta, M., Van Essen, D. C., Raichle, M. E., The human brain is intrinsically organized into dynamic, anticorrelated functional networks. Proc. Natl. Acad. Sci.U.S.A. 102, 2005, 9673–9678.
Figures