2406
Alterations of Resting State fMRI Functional Connectivity in Hypercapnia1Master 's Program of Biomedical Informatics and Biomedical Engineering of Feng Chia University, Taichung City 407, Taiwan, 2Department of Automatic Control Engineering, Feng Chia University, Taichung City 407, Taiwan, 3Graduate Institute of Oncology, National Taiwan University, Taipei, Taiwan, 4Department of Electrical Engineering, National Taiwan University of Science and Technology, Taipei, Taiwan, 5Department of Radiology, China Medical University Hospital, Taichung City 407, Taiwan
Synopsis
The purpose of this study is to explore the alterations of brain functional connectivity among different hypercapnia using resting-state functional magnetic resonance imaging (rs-fMRI). 10 healthy males were enrolled in this study. A high-resolution T1WI image and BOLD-EPI were performed by a 3 Tesla MR scanner. The CO2 gas mixture (air, 3%, 5% and 7%) was given at the different hypercanpic for each experiment. Our results show that the brain functional connectivity in resting state is changed in hypercapnia. FC is gradual reduction as the increased CO2 fraction in the most primary functional networks, expect the executive control network.
Introduction
Resting-state functional MRI (rfMRI) studies that low-frequency fluctuations of spontaneous neuronal activity in the brain can be measured based on blood oxygenation level-dependent (BOLD) signal by gradient echo EPI. Among the papers of resting-state networks, the default-mode network (DMN) is highly reproducible [1]. Furthermore, more networks of interest were identified based on a correlational matching procedure with previously published, publically available, resting-state templates (Smith et al., 2009). However, BOLD signals could be altered solely by hypercapnia and it might cause misinterpretation of fMRI studies with concurrent hypercapnia [2]. Carbon dioxide (CO2) is a potent vasodilator that could increase the cerebral blood flow prominently [3]. Because BOLD signal coming from the cerebral blood flow change, the neuron-activity related BOLD signals will be interfered by the BOLD signals coming from the inhaled CO2 (hBOLD) [4]. We hypothesize that the influence in hypercapnia might be different for the connectivity of resting-state networks and hypercapnia grades. Therefore, in our study, we explored the change of functional connectivity of resting-state networks in different CO2 concentration.Materials and Methods
Experiment design: Ten healthy volunteers (males, mean age 23) given informed consent took MRI scans with inhalation of various CO2 concentrations. All images were performed by a 3 Tesla MR scanner (GE Signa HDx, GE Healthcare, Milwaukee,Wis). A high-resolution T1WI images for coregistration were scanned by a 3D IR SPGR (TR/TI/TE 7.84/450/2.98, FOV: 256 mm, 256x256, 1 mm thickness). BOLD signals were measured by the EPI scan, and total 34 slices (FOV: 192 mm, 64x64, 3 mm thickness) covering the whole brain were acquired. Each experiment consisted of 80 scans with a sampling time of 2.5 seconds. The first 5 dummy scans were discarded. The CO2 gas mixture (air, 3%, 5% and 7%) was given at the hypercanpic phase during 6 min for each experiment. BOLD-EPI scan was started after 3 min from gas delivery for steady-state hypercapnia. Data Analysis: Image data were preprocessed using FSL and SPM8 package. First, the GE-EPI images were slice-timing correction and realigned for motion correction. Then, signal fluctuations were removed by nuisance regression induced by head motion, respiration, cardiac pulsation, and scanner drift. Finally, fMRI was co-registered on FSL BBreg and normalized to the MNI space with the non-linear registration from FSL. The Functional Connectivity (FC) was calculated by a combined independent component analysis (ICA) and dual regression Procedure[5]. Excluding cerebellum network, nine of 10 explicit activation networks at rest state which were identified in previous study [6] were used as the primary functional networks in this study. For the group analysis, the voxel-by-voxel statistical significance of FC value was analyzed using the one-sample t test (p<0.0001). The activated voxels inside the nine primary functional networks were counted to calculate the activated volumes for different CO2 concentrations (air, 3%, 5% and 7%).Result
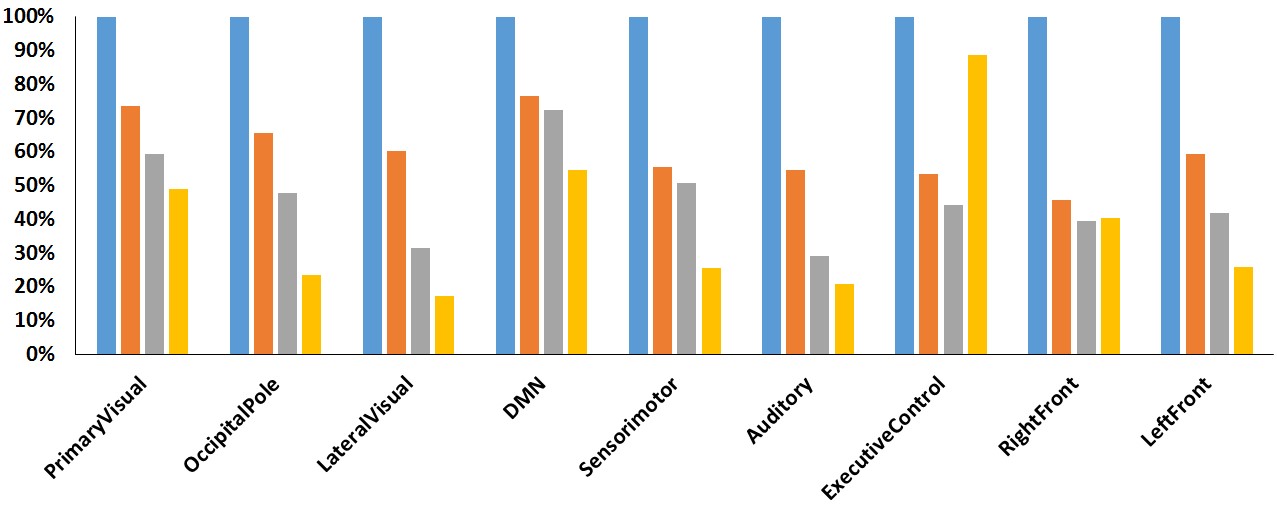
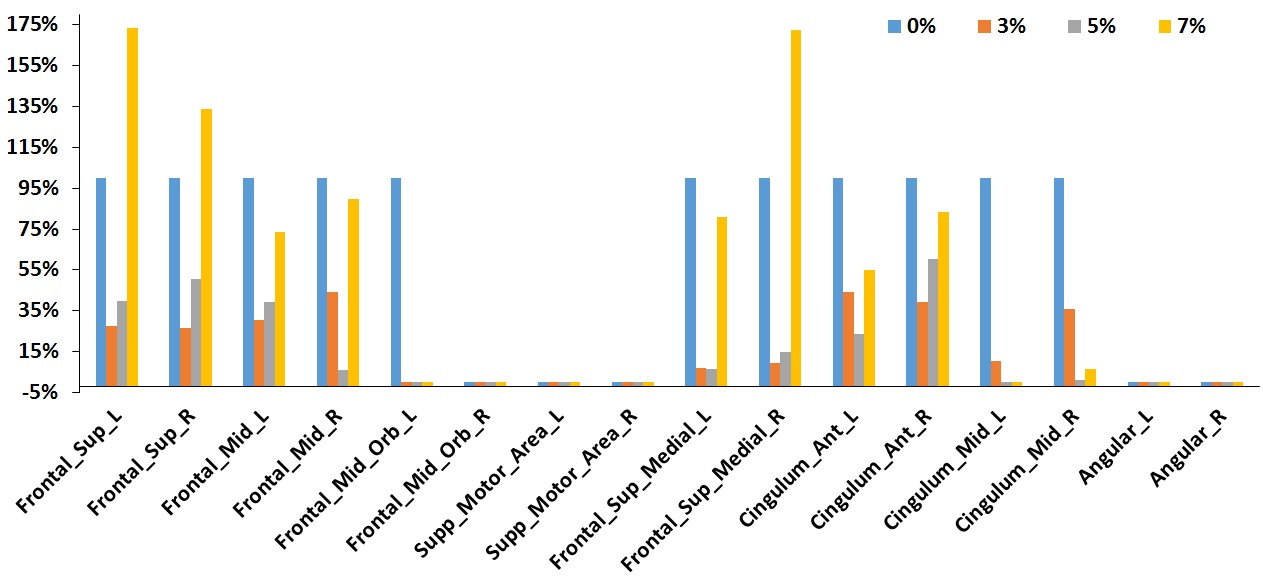
Figure 1 showed the connectivity maps obtained through group analysis for different CO2 concentrations, only default mode network and executive control network shown here. The activated voxels were defined by the T value over 3. The activated volumes ratios in different CO2 concentration were calculated using dividing by the activated volume in air experiment, and Figure 2 depicted the activated volumes ratios at nine primary functional networks. The activated volumes ratios were reduced along with raised CO2 fraction in the most functional networks, except the executive control network. Therefore, the active volumes ratios of different CO2 concentration in the detailed brain area of executive control network were evaluated and showed on Figure 3.Conclusion
Our results show that the brain functional connectivity in resting state is changed in hypercapnia. FC is slight change in 3% CO2 fractions and gradual reduction as the increased CO2 fraction in the most primary functional networks. However, in the executive control network, it was suddenly raised in 7% CO2 concentration with close performance in air condition. The executive control network is strongly to several cognition paradigms, as well as action–inhibition, emotion, and perception–somesthesis–pain [6]. The reasons might be related with that the subjects didn’t feel well in suffering from inhaling 7% CO2 concentration for 6 min duration. Our results show that the BOLD variations by hypercapnia are different with local brain area and hypercapnia grades.Acknowledgements
The study was supported partly from the Ministry of Science and Technology, R. O. C. under the Grant No. MOST 105-2221-E-035 -049 -MY2.References
1. Raichle, M. E., MacLeod, A. M., Snyder, A. Z., Powers, W. J., Gusnard, D. A., et al. (2001). A default mode of brain function. Proc. Natl. Acad. Sci. U.S.A., 98, 676–82.
2. Juan CJ (2006) , Investigating the Relation between steady-state hBOLD and fBOLD signals in fMRI studies, Proc. ISMRM 2006; 541.
3. Marshall RS (2003), Monitoring of cerebral vasodilatory capacity with transcranial Doppler carbon dioxide inhalation in patients with severe carotid artery disease. Stroke.34:945–9.
4. Liu YJ (2007), Are the local blood oxygen level-dependent (BOLD) signals caused by neural stimulation response dependent on global BOLD signals induced by hypercapnia in the functional MR imaging experiment? Experiments of long-duration hypercapnia and multilevel carbon dioxide concentration. AJNR Am J Neuroradiol. 28:1009–1014.
5. Zuo X.-N., Kelly C., Adelstein J. S., Klein D. F., Castellanos F. X., Milham M. P. (2010). Reliable intrinsic connectivity networks: test-retest evaluation using ICA and dual regression approach. Neuroimage 49, 2163–2177.
6. Smith, S. M., Fox, P. T., Miller, K. L., Glahn, D. C., Fox, P. M., Mackay, C. E.,et al. (2009). Correspondence of the brain’s functional architecture during activation and rest. Proc. Natl. Acad. Sci. U.S.A. 106, 13040–13045.
Figures
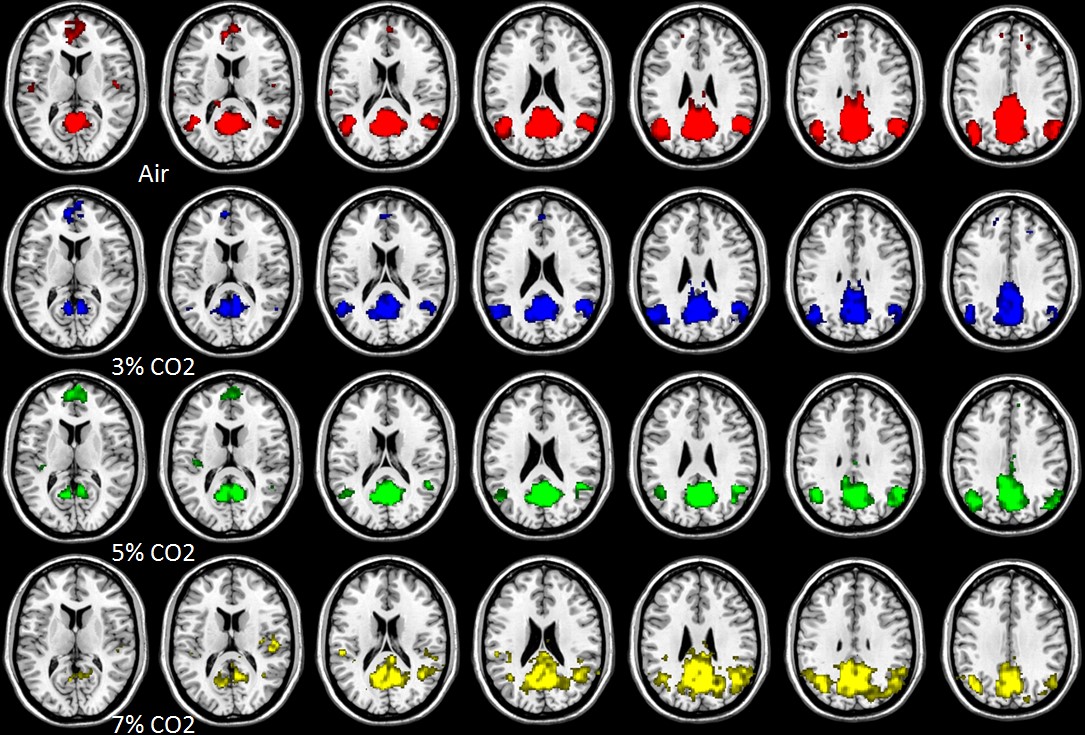
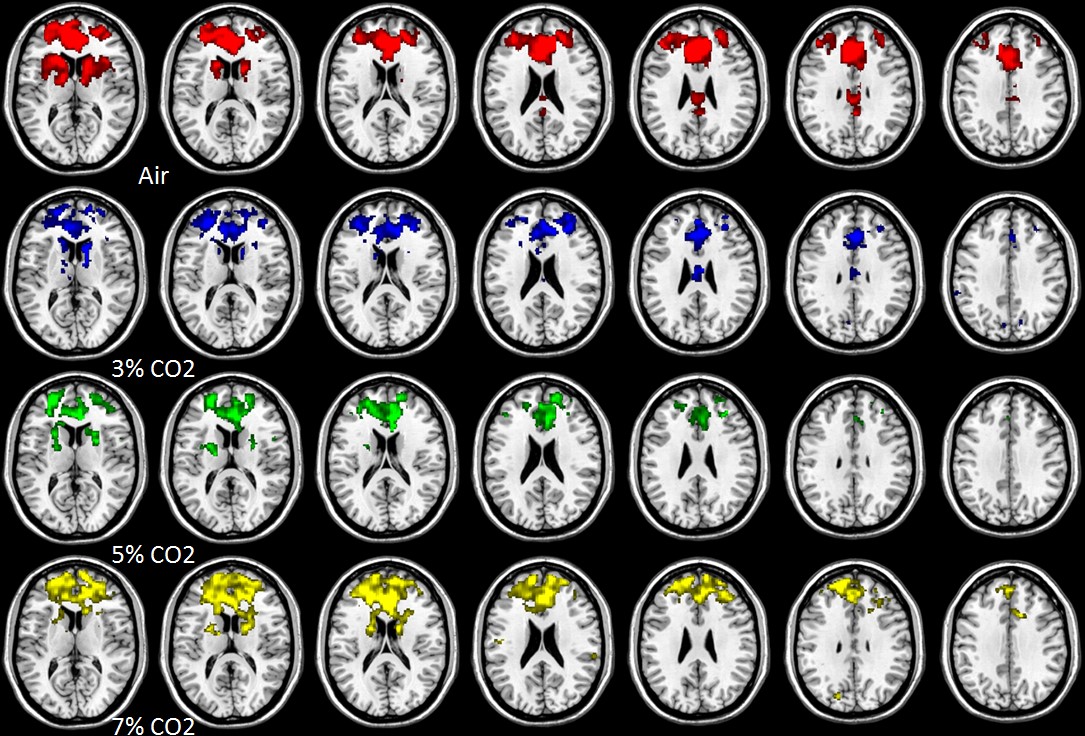
Figure 1(B)
Figure 1.The DMN (A) and the executive control network (B) connectivity maps obtained through group analysis. The results of the 4 rows are depicted using 4 colors. (The 1st , 2nd, 3rd and 4th rows are air, 3%, 5% and 7% CO2, respectively.)