2405
Functional Connectivity within the Cognitive Networks is associated with the Complexity of Network Node DynamicsKay Jann1 and Danny JJ Wang1
1USC Stevens Institute for Neuroimaging and Informatics, Keck School of Medicine at USC, University of Southern California, Los Angeles, CA, United States
Synopsis
While static and dynamic functional connectivity (sFC/ dynFC) provide estimates of the integrity and information transfer between brain network nodes, the signal dynamics at each node represents the local information processing. Here we assessed the relation between static FC, dynFC and complexity of signal fluctuations wishing nodes within four networks. We found that more complex and thus less predictable signal in networks allows for a more dynamic functional connectivity and hence a richer repertoire of different FC states.
Introduction
Recent research shows that there is considerable variability and reconfiguration of functional networks across both spatial and temporal scales, and there are dynamic changes of FC (dynFC) on the order of seconds to minutes. The dynamic changes of FC can be related to theories on neural complexity and brain’s information processing [1]. Recently, the use of Multi-Scale Entropy (MSE) to quantify the complexity or regularity of regional rs-fMRI signals has been explored. The presented study aimed to investigate the relation between local signal complexity (MSE) and the static (FC) and dynamic changes in functional connectivity (dynFC) within the resting state-networks of higher cognitive functions.Methods
We analyzed 40 subjects from the HCP database [2]. Data were acquired at 3T with TR/TE = 720/33ms, multiband-factor 8, FA = 52°, 2mm isotropic EPI readout. Datasets were preprocessed according to HCP minimal preprocessing pipeline. Networks and nodes were of four networks associated with higher cognitive functions were identified by means of group ICA: Default Mode Network (DMN), Left and Right Cognitive Control Networks (L/R-ECN) and Salience Network (SAL). Then first, we computed static FC between all nodes using conventional Pearson correlation. Second, using a sliding window approach (window-length 20TRs) the dynamic changes in interregional FC was computed. MSE was calculated using sample-entropy for 40 coarse-sampled temporal scales (pattern length m=2, matching threshold r=0.2) for each node as well as for dynFC [4]. This allowed comparing static FC, complexity of dynFC and signal complexity of the networks at different temporal frequencies. To test for potential relations between the local signal dynamics (MSE) and network coherence (FC and dynFC) we (i) correlated the overall network FC with overall network MSE across scales to identify a global association between network connectivity and network complexity; (ii) correlated the network MSE to complexity of network dynFC; (iii) correlated average static FC to the complexity of dynFCResults
On the network level which means the average across all nodes for FC and MSE, we found that the overall static FC of all networks is negatively associated with MSE at the original temporal frequency (scale 1, 1.4Hz), while positively related to MSE at mid frequencies (scales 4-18, 0.18-0.05Hz) (Figure1A). For, complexity of dynFC on the network level and averaged across MSE scales in dynFC we found the opposite relation with MSE, where at the original frequency (scale 1) the correlation was negative and positive at low frequencies (above scale 20) (Figure1B). A more detailed analysis of the relationship between network MSE and complexity of dynFC comparing the relationship in a scale-by-scale cross-correlation revealed positive dependencies of low frequency network MSE to mid frequency dynFC. Moreover, the association at high frequency network MSE was negative to low and high frequency dynFC (Figure1C). Most prominently can these relationships be seen in the combined analysis across all four networks, which indicates that these associations between FC and network MSE is a common feature within these networks. Finally, static FC and complexity of dynFC was negatively correlated (Figure1D), confirming the opposite associations observed between network MSE and static FC (Fig1A) or dynFC (Fig1B), respectively.Discussion
We found relations between network connectivity and signal complexity of network nodes of four networks. We observed that overall static FC of the network was generally positively related to overall network MSE while for dynamic FC we observed an inverse association. This finding suggests that if networks show high complexity and thus less predictable signals at their nodes they exhibit more dynamic network reconfigurations and thus the ability to explore different FC states [5]. Furthermore, the more dynamic the network connectivity, the less consistent the network structure and thus a reduced static FC will be observed. Moerover, Our findings of significant associations within higher frequencies (i.e. lower scales) are generally consistent with the theory that higher-frequency oscillations originate from local neuronal populations. Our study suggests that by taking into account nodal signal complexity one can gain further insight into the mechanisms and dynamic organization of brain networks. The analysis within the combined networks further suggest that these associations between staticFC, dynamicFC and network signal complexity is a generalizable mechanism of cortical network organization. Future work will investigate this relationship in whole brain networks as well as its alterations in pathological states.Acknowledgements
Data were provided by the Human Connectome Project, WU-Minn Consortium (Principal Investigators: David Van Essen and Kamil Ugurbil; 1U54MH091657) funded by the 16 NIH Institutes and Centers that support the NIH Blueprint for Neuroscience Research; and by the McDonnell Center for Systems Neuroscience at Washington University. The data release of 40 unrelated adult subjects was used in the present study.References
[1] McDonough IM & Nashiro K, Front Hum Neurosci. 2014; 8:409 [2] VanEssen DC et al. NeuroImage 2013; 80:62-79 [3] Calhoun et al (Gift Toolbox, http://mialab.mrn.org/software/gift/index.html) [4] Smith RX et al. Brain Imaging Behav. 2014; 8(2):284-91 [5] Yang, AC et al. Neurobiol Aging. 2013; 34(2):428-38.Figures
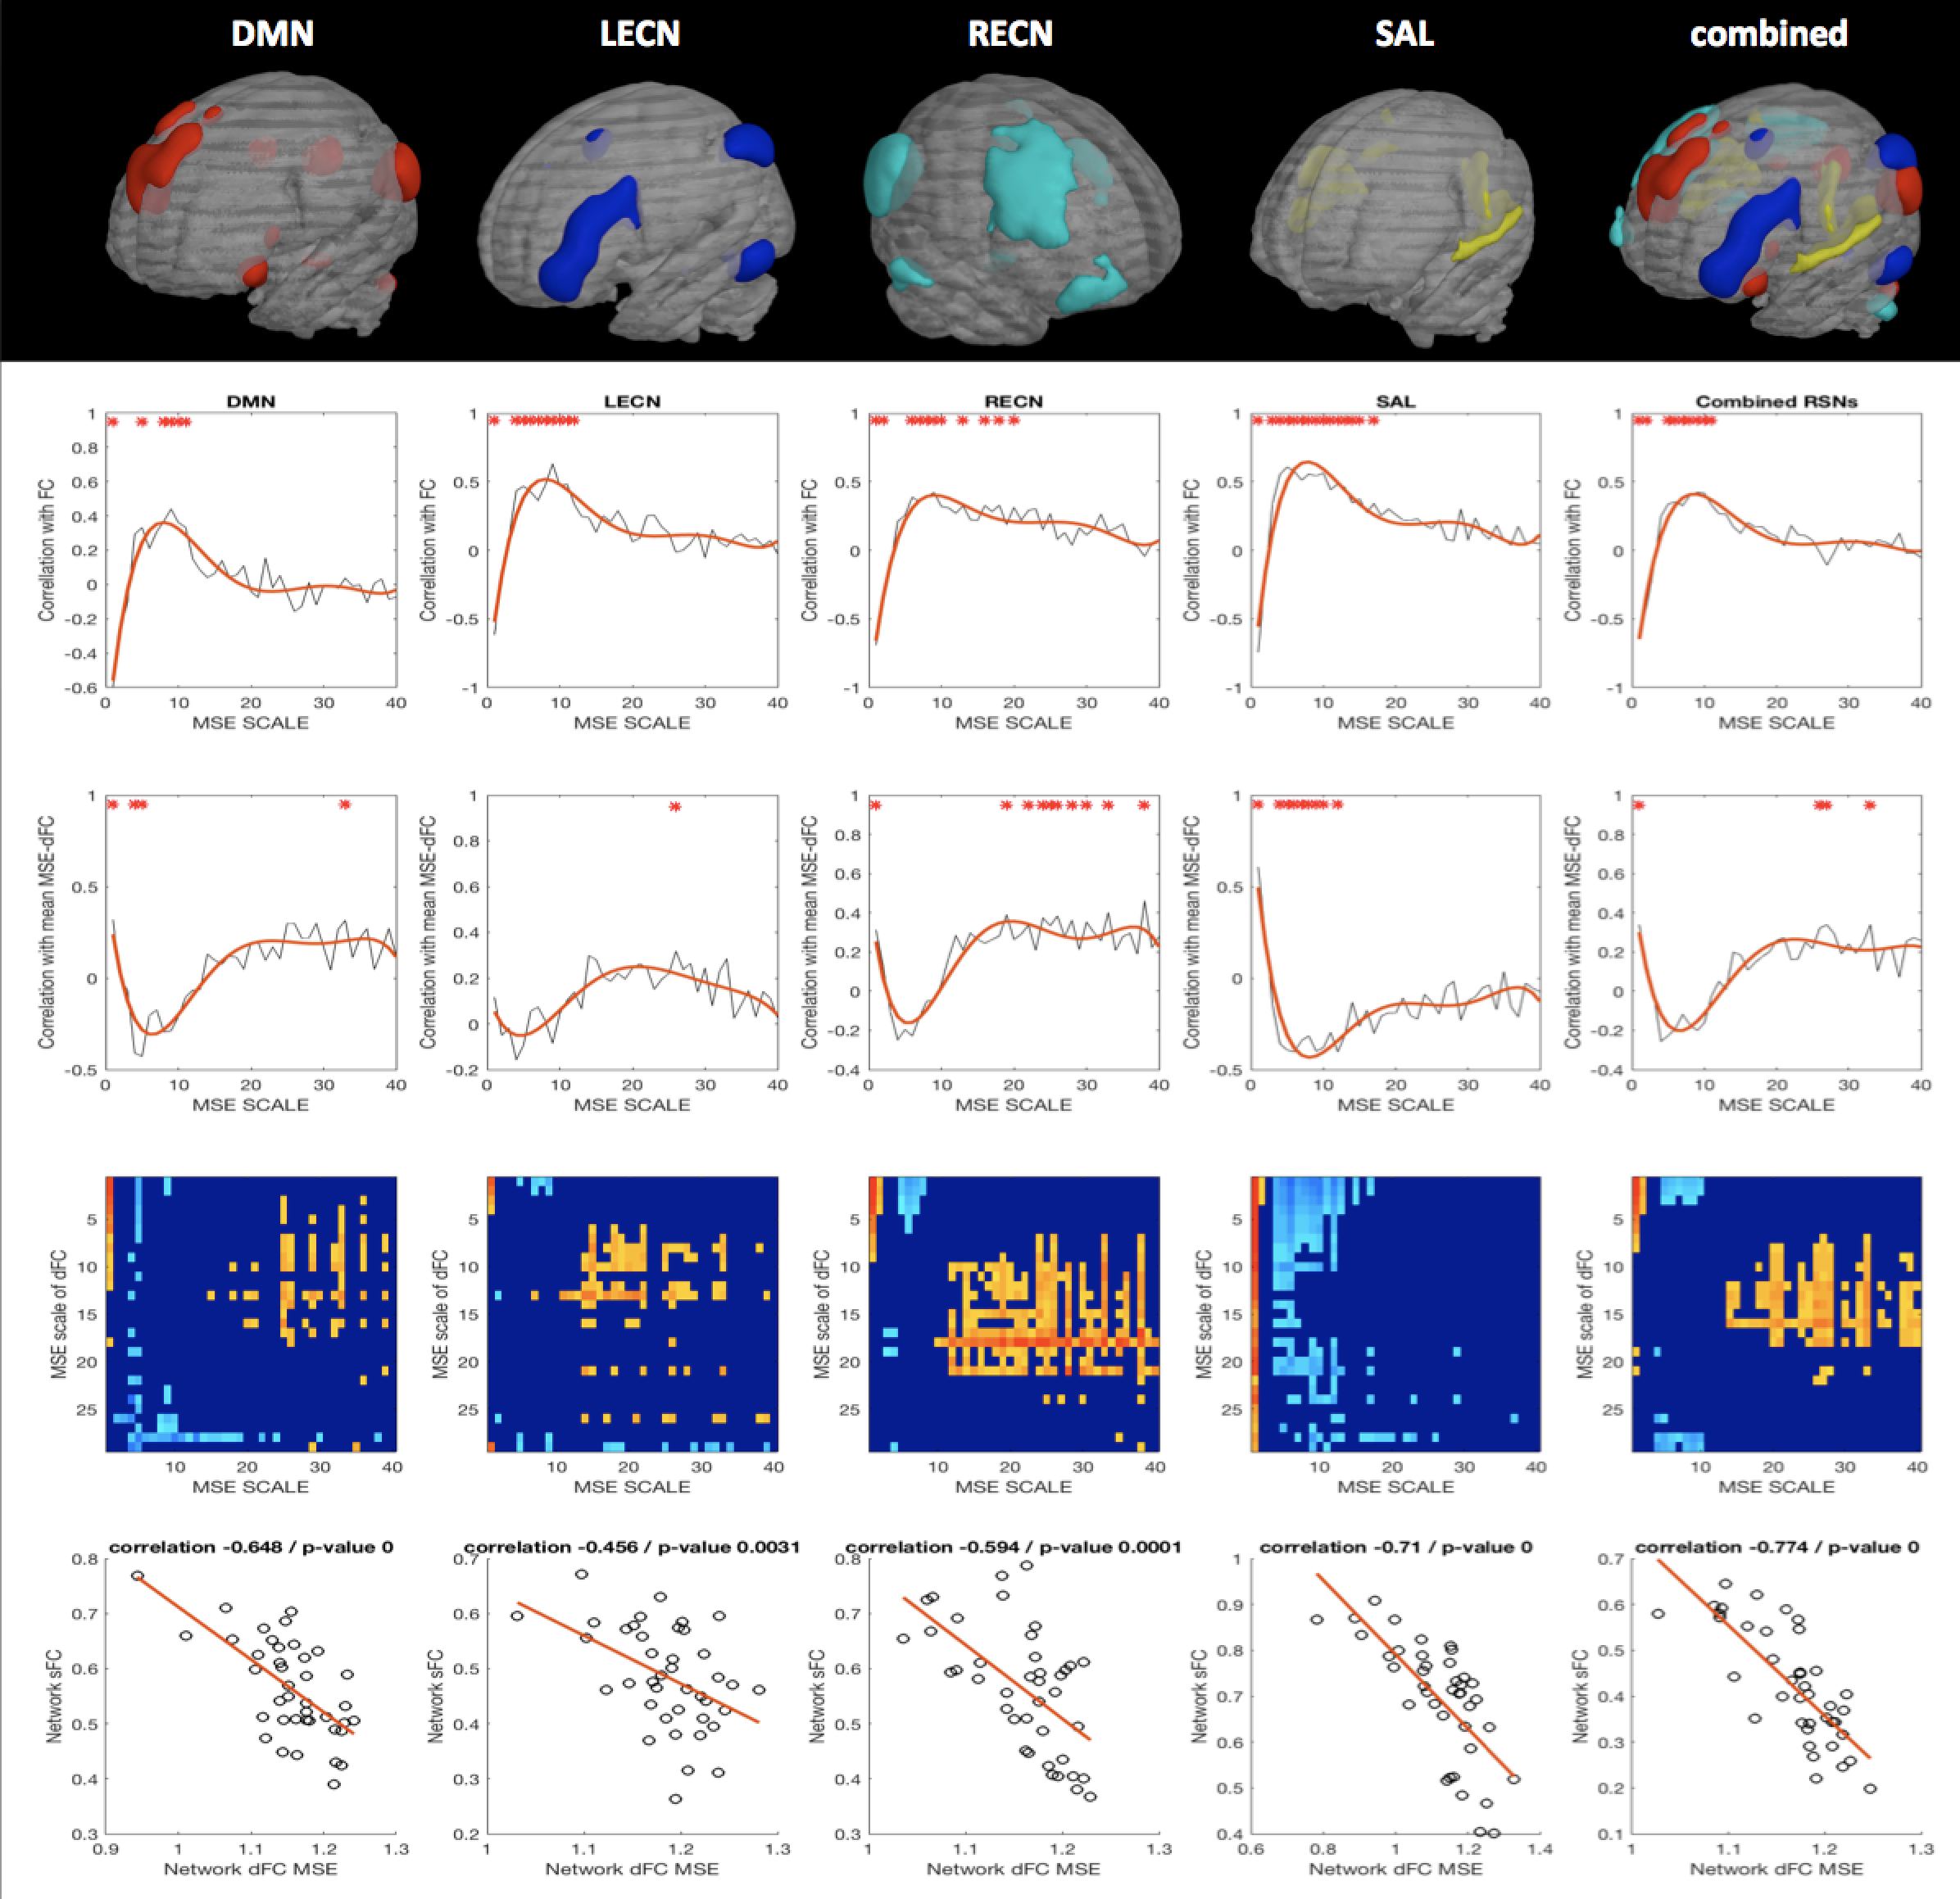
A) Correlation between average static FC of the networks with average MSE of all network nodes for all frequency scales (red asterisks indicate statistical significance at p<0.05). B) Same as in A but for correlations between network MSE and complexity of dynFC. C) Scale-by-Scale cross-correlation between network MSE and dynFC displaying pattern of negative correlations at low and high dynFC frequencies with high network MSE frequencies while relationship is positive at mid frequencies in both metrics. D) Correlation between static and dynamic FC revealing a consistent negative relationship suggesting that the more complex the network reconfigurations the less stable the network’s static FC.