2404
Correcting for erroneous assessment of resting-state functional connectivity caused by prolonged arterial arrival time: a study in Moyamoya patients1Radiology, University of Washington, Seattle, WA, United States, 2Radiology, Stanford University, Palo Alto, CA, United States
Synopsis
We studied the default mode network in a group of Moyamoya patients using ICA method and observed erroneous assessments of functional connectivity in regions with prolonged arterial arrival time. We showed that these arterial delays could lead to erroneous elimination of affected brain regions from a functional connectivity network. We proposed a method called “temporal realignment” to mitigate this problem.
Introduction
rs-fMRI has been increasingly used to explore the brain’s functional organization and to probe its alterations in neurological or psychiatric diseases1-3. Because functional connectivity networks are identified utilizing the temporal correlation between signal fluctuations of spatially remote areas of the brain, rs-fMRI analyses are inherently sensitive to delays in signal time-series that may exist in some neurological diseases. Moyamoya is an example of such diseases in which a chronic steno-occlusive vasculopathy causes considerably increased regional arterial transit delays. We previously demonstrated that not accounting for arterial transit delays might lead to erroneous identification of functional connectivity networks and proposed a method called multi-delay analysis to correct for these errors4. The multi-delay approach, however, can only be applied to seed-based analysis methods and is not applicable to other popular rs-fMRI analysis methods such as Independent component analysis (ICA)5. To remedy this problem, we propose a novel prep-processing approach called temporal realignment to correct the arterial transit delays before analyzing the data. This method can be applied to any fMRI analysis method. In this study we evaluated the proposed method using ICA technique.
Methods and Materials
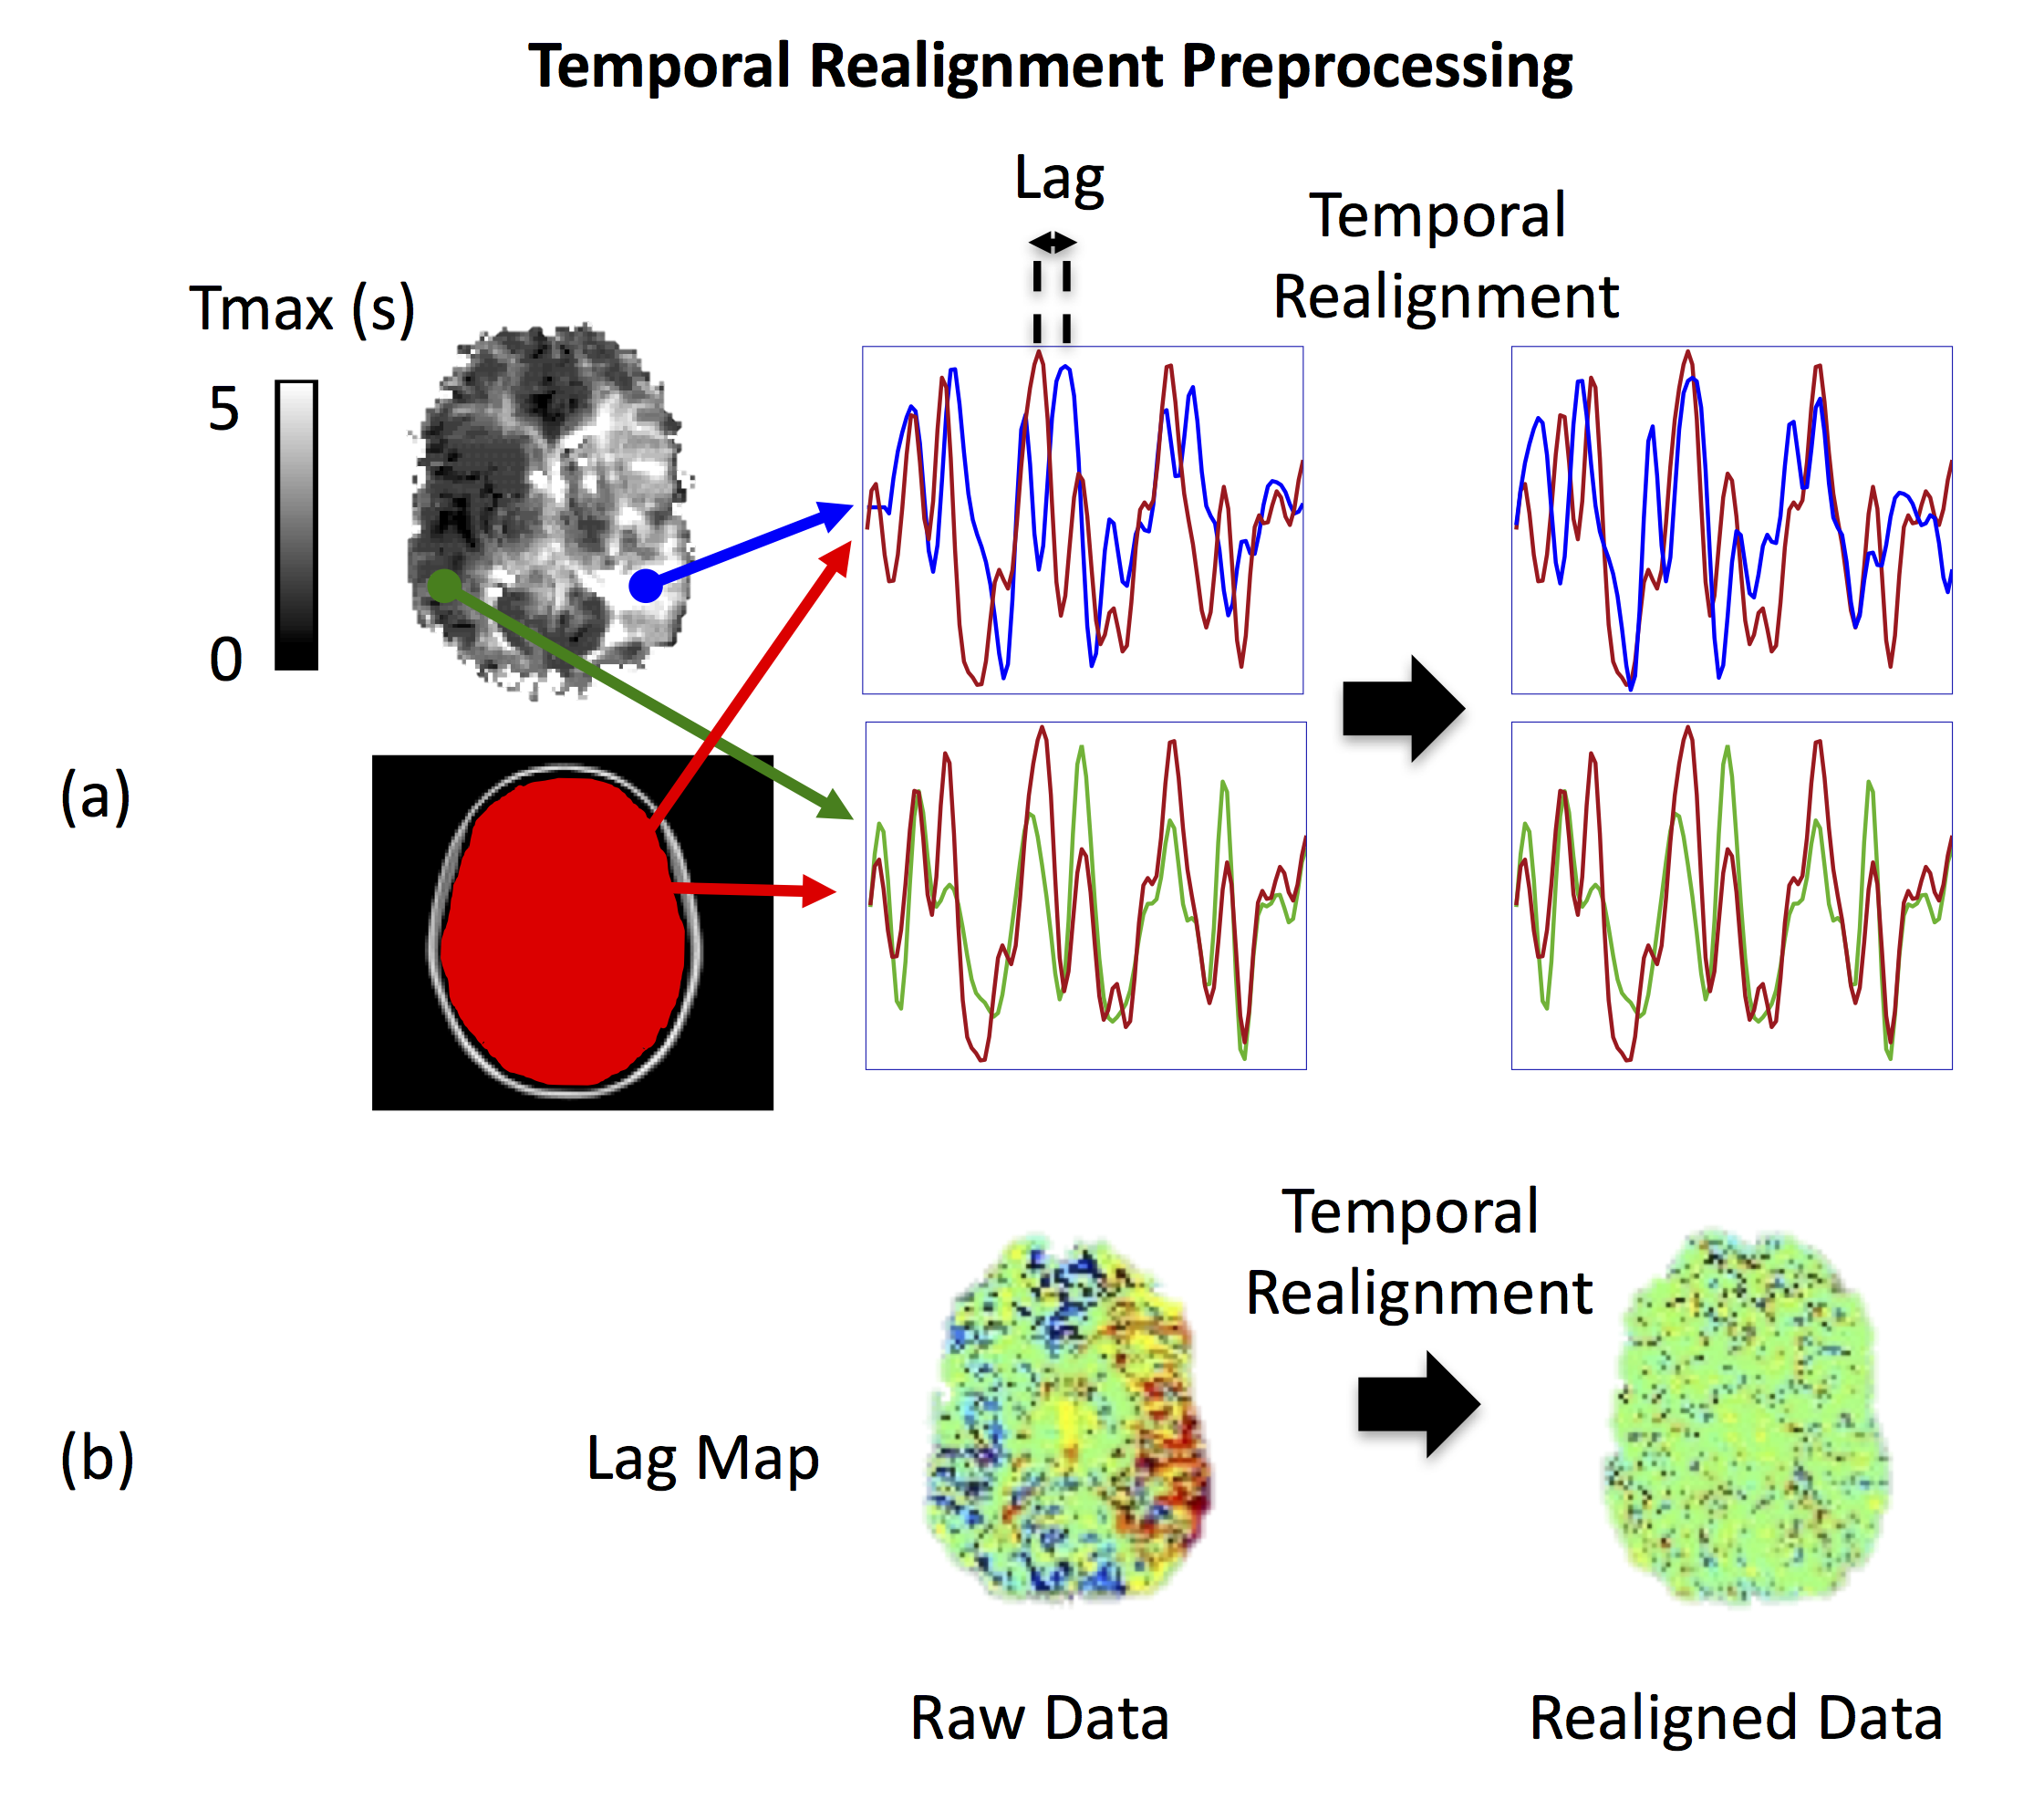
Nineteen Moyamoya patients (39±10 yrs; range 25-61 yrs; M/F 4/15) and ten healthy volunteers (30±6 yrs; range 24-45 yrs, M/F 6/4) were included in this study. Subjects were scanned at 3T (GE MR750). For all subjects, rs-fMRI data was collected using a 2D gradient echo EPI sequence (FOV=22 cm, matrix= 64×64, slice thickness=3.5 mm, number of slices=35, TR/TE=2s/30ms, scan duration = 6 min). We analyzed the data using ICA, with and without the proposed temporal realignment technique. For temporal realignment, we first create a delay map from the rs-fMRI data using a cross correlation analysis6, in which the lag between each voxel’s time-course and a reference time-series (mean global signal) is calculated (e.g. Figure 1.b). Then we shift the time-series of each voxel according to the corresponding lag, estimated in the previous step, to obtain a temporally realigned 4D rs-fMRI time-series (Figure 1). After the temporal realignment followed by standard preprocessing steps, the default mode network (DMN) was probed using ICA carried out by FSL’s MELODIC. For Moyamoya patients we also collected gadolinium-based DSC images and calculated Tmax maps using RAPID software7.Results
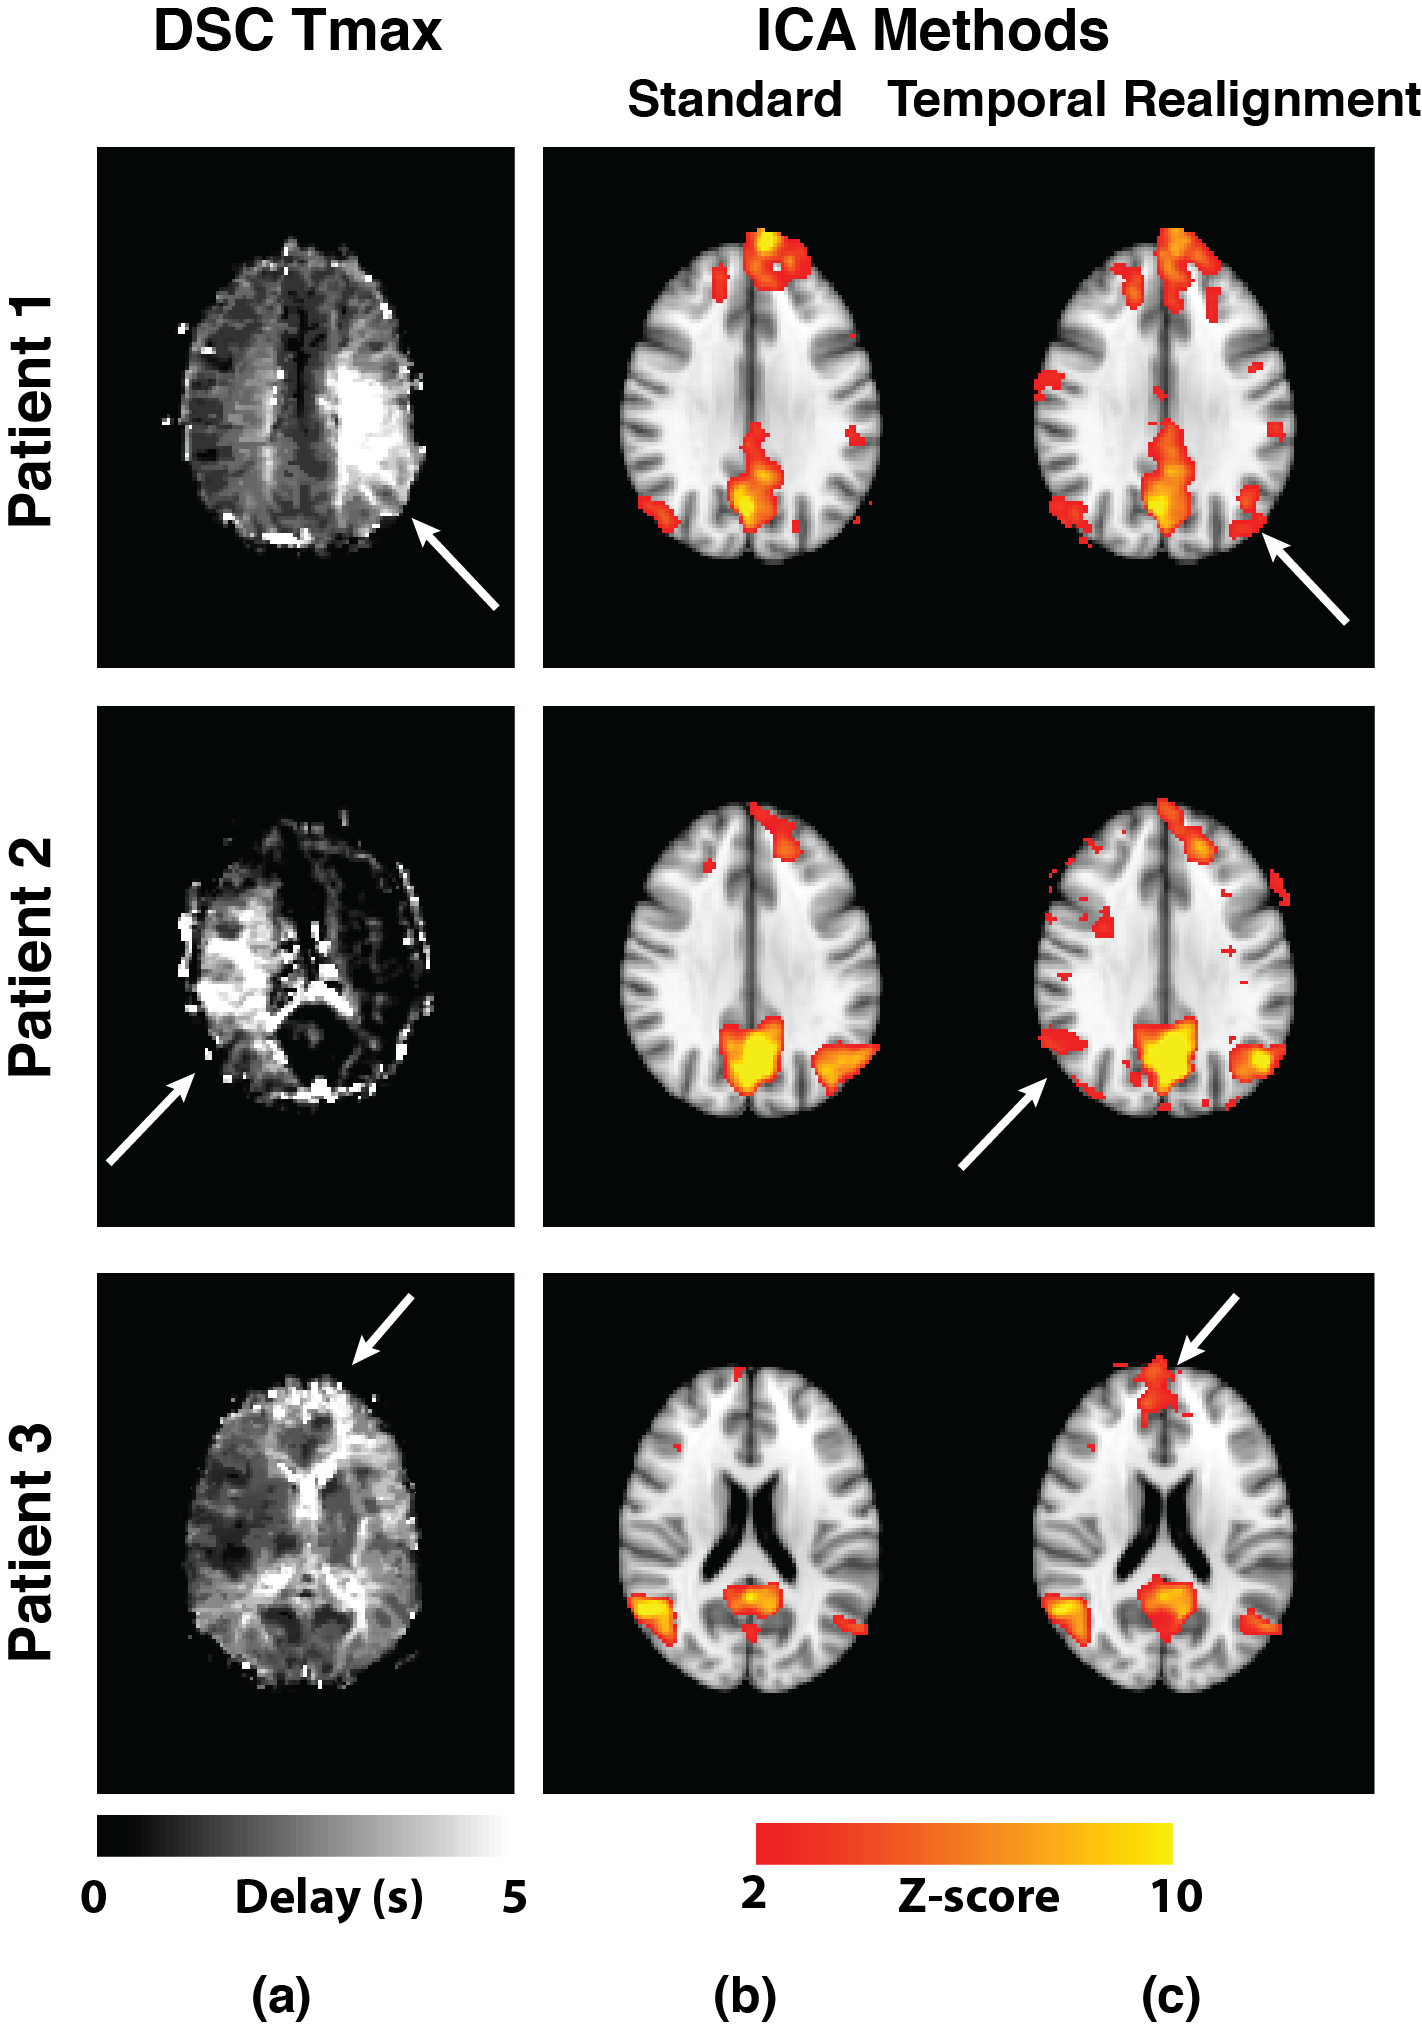
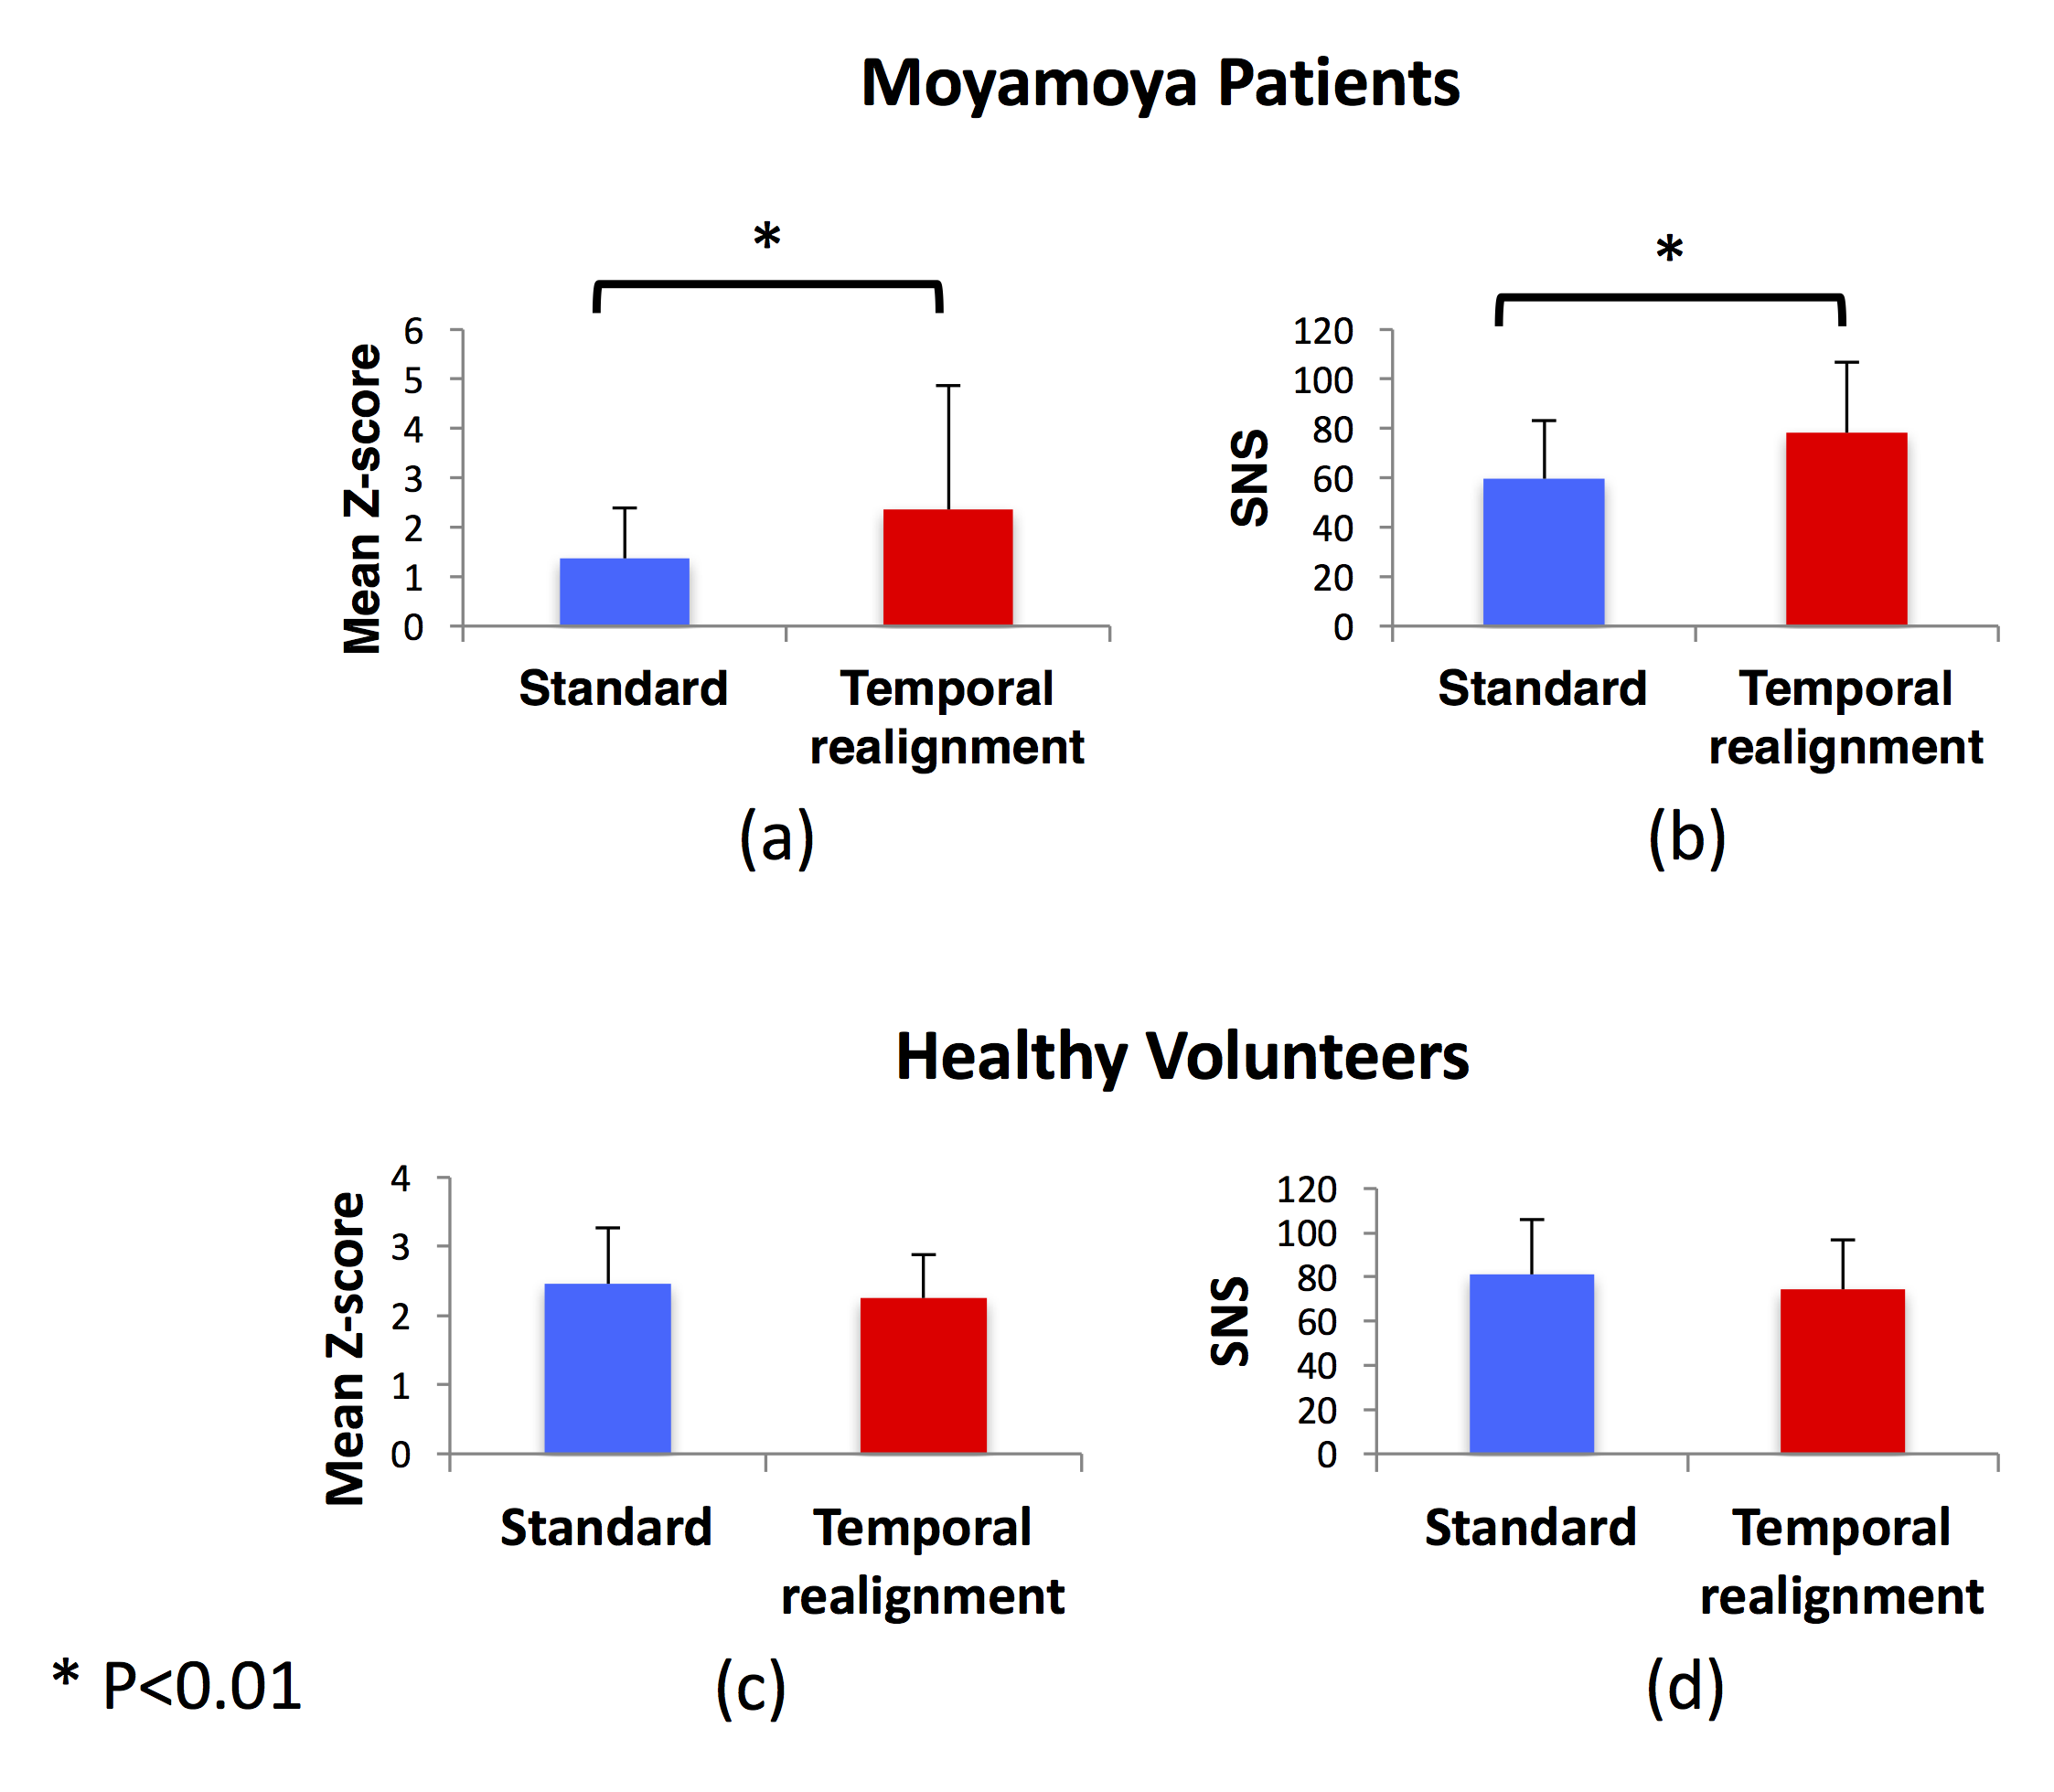
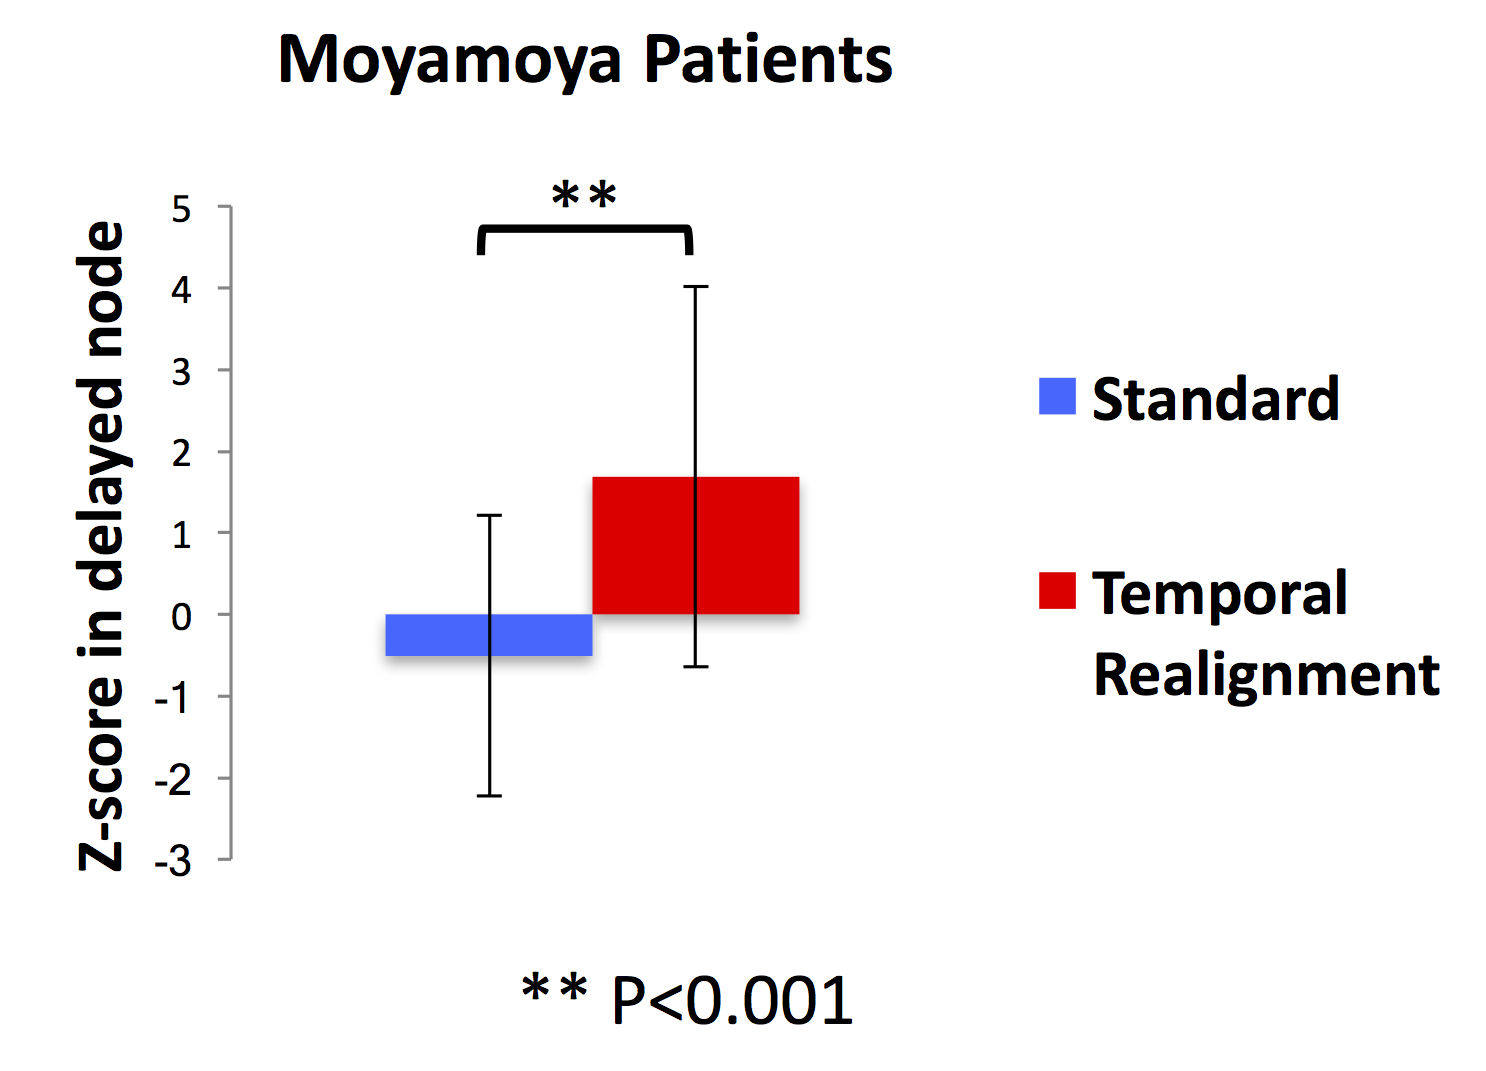
Resting-state connectivity analyses in 3 Moyamoya patients with increased arterial arrival delays are shown in Figure 2. In all of them, ICA did not detect the connectivity of one of the major DMN nodes. These “missing” nodes were recovered after temporal realignment. We compared the DMN connectivity maps obtained before and after temporal realignment using two metrics: 1) mean Z-score and 2) Signal-noise-separation (SNS)8 defined as the two-sample t-test comparing signal (voxels inside the DMN) and noise (voxels outside the DMN). We calculated these metrics within the whole DMN for Moyamoya (Figure 3.a,b) and healthy subjects (Figure 3.c,d). we observed a significant improvement in both the mean Z-score and SNS after temporal realignment. Whereas in healthy subjects the temporal realignment did not lead to a significant change in either Z-score or SNS. For Moyamoya patients we also calculated the mean Z-score only in the affected nodes (Figure 4). Affected nodes were defined by finding the overlap between the thresholded DSC Tmax maps (Tmax > 3 sec) and the predefined DMN mask in MNI space. In this analysis, the difference between the measured Z-scores before and after the correction were even more significant (p<0.001).Conclusion
We studied the DMN in a group of Moyamoya patients using ICA and observed significantly weaker connectivity in regions with prolonged arterial arrival time leading to inaccurate and incomplete characterization of functional connectivity in these patients. We demonstrate that using the proposed temporal realignment technique it is possible to mitigate the deleterious effects of arterial arrival delay on the assessment of functional connectivity of the DMN. The relationship between the delays observed in DSC Tmax maps and functional connectivity in the affected area strongly suggests that the apparent disruption in connectivity in these regions are due to spatial differences in arterial arrival delay rather true disruptions in neuronal connectivity, in which case it would have been unlikely to be able to recover them with simple temporal shifting techniques. Based on this, weakened connectivity of a node in functional connectivity maps in cerebrovascular disease patients obtained using the standard methods do not necessarily correspond to a “functional disconnectivity.” When studying patients with potential arterial arrival delays, it is crucial to account for this to be able to distinguish between true and apparent lack of functional connectivity.Acknowledgements
This work is supported by NIH grants 1R01NS066506, 2R01NS047607, R01 DK092241.References
1. Greicius MD, Srivastava G, Reiss AL, Menon V. Default-mode network activity distinguishes Alzheimer's disease from healthy aging: evidence from functional MRI. Proc Natl Acad Sci U S A. 2004;101(13):4637-42.
2. Greicius MD, Flores BH, Menon V, et al. Resting-state functional connectivity in major depression: abnormally increased contributions from subgenual cingulate cortex and thalamus. Biol Psychiatry. 2007;62(5):429-37.
3. Seeley WW, Crawford RK, Zhou J, Miller BL, Greicius MD. Neurodegenerative diseases target large-scale human brain networks. Neuron. 2009;62(1):42-52.
4. Jahanian H, Christen T, Moseley M and Zaharchuk G. Arterial Transit Delays Is Crucial for Identifying Functional Connectivity Networks: A Resting-State fMRI Study of the Default Mode Network in Moyamoya Disease Patients. Proceedings of ISMRM, May 2014, Milan, Italy, P. 167.
5. McKeown M, Makeig S, Brown G, et al. Analysis of fMRI data by blind separation into independent spatial components. Hum Brain Mapp. 1998;6(3):160-88.
6. Christen T, Jahanian H, Ni WW, Qiu D, Moseley ME, Zaharchuk G. Noncontrast mapping of arterial delay and functional connectivity using resting-state functional MRI: a study in Moyamoya patients. J Magn Reson Imaging. 2015;41(2):424-30.
7. Straka M, Albers GW, Bammer R. Real-time diffusion-perfusion mismatch analysis in acute stroke. J Magn Reson Imaging. 2010;32(5):1024-37.
8. Shirer WR, Jiang H, Price CM, Ng B, Greicius MD. Optimization of rs-fMRI Pre-processing for Enhanced Signal-Noise Separation, Test-Retest Reliability, and Group Discrimination. Neuroimage. 2015;117:67-79.
Figures