2403
Hemodynamic reorganization approach to estimate the functional connectivity in task based functional MRI study1NMR Research Centre, Institute of Nuclear Medicine & Allied Sciences, Delhi, India, 2Delhi Technological University, Delhi, India
Synopsis
Modulations in brain connectivity by task reveal more insights into complex interaction and neuronal communication occurs between various cortexes. However, assessment of these modulation is limited by dynamic hemodynamic (HRF) spread (3 to 6 sec) occurs at every brain regions by various task stimulus. This dynamic HRF limits methods of resting-state studies to be adopted directly in task-fMRI. Thus, in this study, a novel hemodynamic reorganization method is proposed to rearrange the dynamic HRF of every stimulus such that functional connectivity modulation caused by every stimulus and their mutual correlations in visual search based target detection task can be assessed.
Aim
Estimation of modulation in functional connectivity caused by task stimuli and their mutual correlations in visual search based target detection by reorganizing hemodynamic spread in task-fMRI dataset.Method
At first, resting-state and task-fMRI (target detection by visual search) of twenty volunteers (13 Males, 7 Females: Mean-age:24 years) were acquired using 3T MRI scanner and pre-processed. Then, proposed hemodynamic reorganization for network analysis was performed on aquired task-fMRI data $$$\small Y(T)$$$ and hemodynamically reorganised task-fMRI dataset R(T) was estimated as follows:
$$$\small R\left(T\right)=\left\{R_{r,c,s}(T)\right\}=\left\{Mean \left\{Y_{r,c,s}(T)\right\}\mid t_{earlier} <t<t_{later}\right\}$$$
where r, c and s are row, column and slice-number of voxel in $$$ \small R(T) $$$. $$$t_{earlier}$$$ and $$$t_{later}$$$ are earlier and later time point around Amplitude(A) of HRF and estimated through,
$$$\small t_{earlier}=\left\{Firstpoint\left\{t\right\}\mid t>TTP_{r,c,s}^\mu\ and\ h_{r,c,s}^\mu<\frac{A_{r,c,s}^\mu}{2}\right\}$$$
$$$\small t_{later}=\left\{Lastpoint\left\{t\right\}\mid t<TTP_{r,c,s}^\mu \ and\ h_{r,c,s}^\mu<\frac{A_{r,c,s}^\mu}{2}\right\}$$$
where $$$\small h_{r,c,s}^\mu(t)$$$ is HRF estimated for voxel (r,c,s) to given specific stimuli $$$\small \mu$$$ .$$$\small TTP_{r,c,s}^\mu$$$ ,$$$\small A_{r,c,s}^\mu$$$ are Time-to-Peak and Amplitude measured from $$$\small h_{r,c,s}^\mu(t)$$$.The estimation of $$$\small TTP_{r,c,s}^\mu$$$ and $$$\small A_{r,c,s}^\mu$$$ was performed as
$$$\small TTP_{r,c,s}^\mu=min\left\{t\mid\frac{dh_{r,c,s}^\mu(t)}{dt}=0,\ and\ \frac{d^{2} h_{r,c,s}^\mu(t)}{dt^{2}}<0\right\}$$$
$$$\small A_{r,c,s}^\mu=sign(\beta_{r,c,s}^\mu(1))\sqrt{(\beta_{r,c,s}^\mu(1))^{2}+\beta_{r,c,s}^\mu(2))^{2}+\beta_{r,c,s}^\mu(3))^{2}}$$$
$$$\small \beta_{r,c,s}^\mu(1))$$$,$$$\small \beta_{r,c,s}^\mu(2))$$$ and $$$\small \beta_{r,c,s}^\mu(3))$$$ are regression coefficients parameters of canonical HRF and its first, second order derivatives. Reorganized task-fMRI data $$$R_{r,c,s}(T)$$$ was subsequently segregated for every single stimulus independently.
These independently grouped hemodynamic
reorganized task dataset along with rsfMRI data were further processed through
MELODIC probabilistic ICA1 in FMRIB
Software Library to estimate correlation between DMN, Visual, Frontal-Parietal
and Hippocampus/Thalamus networks in task as well as in resting-state.
Results
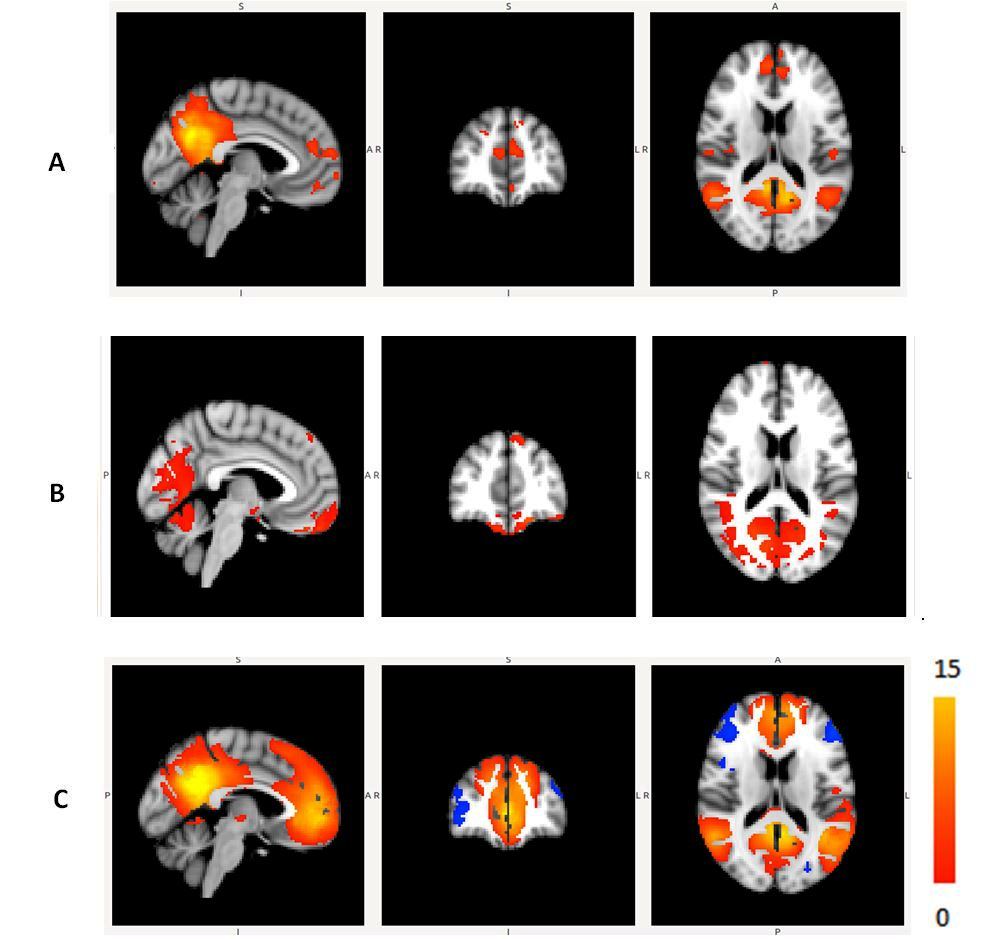
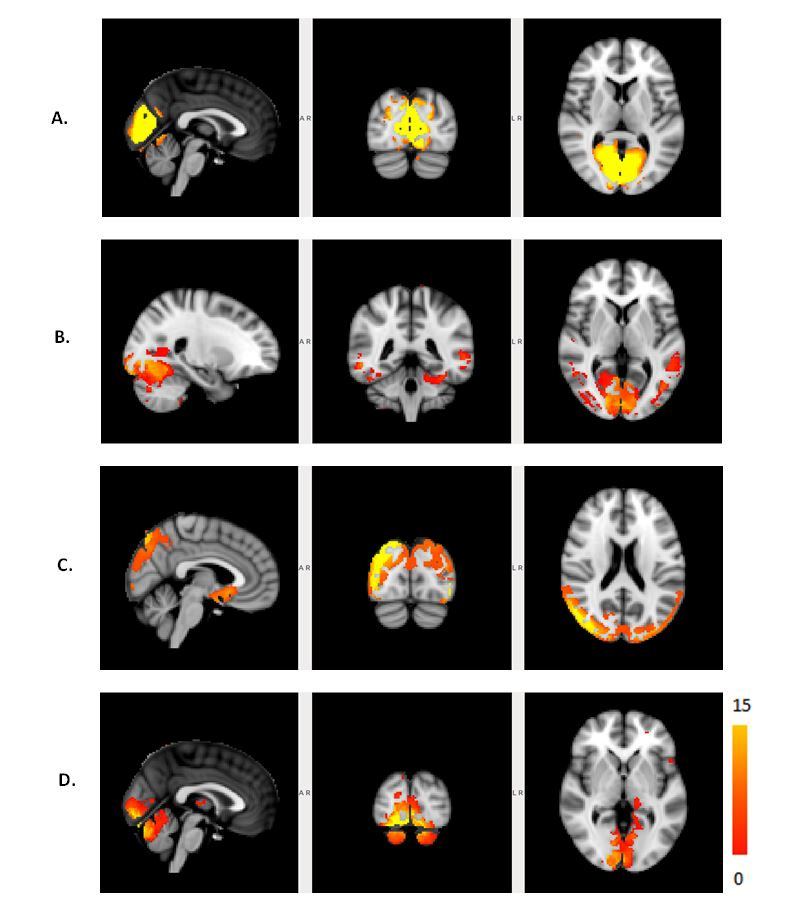
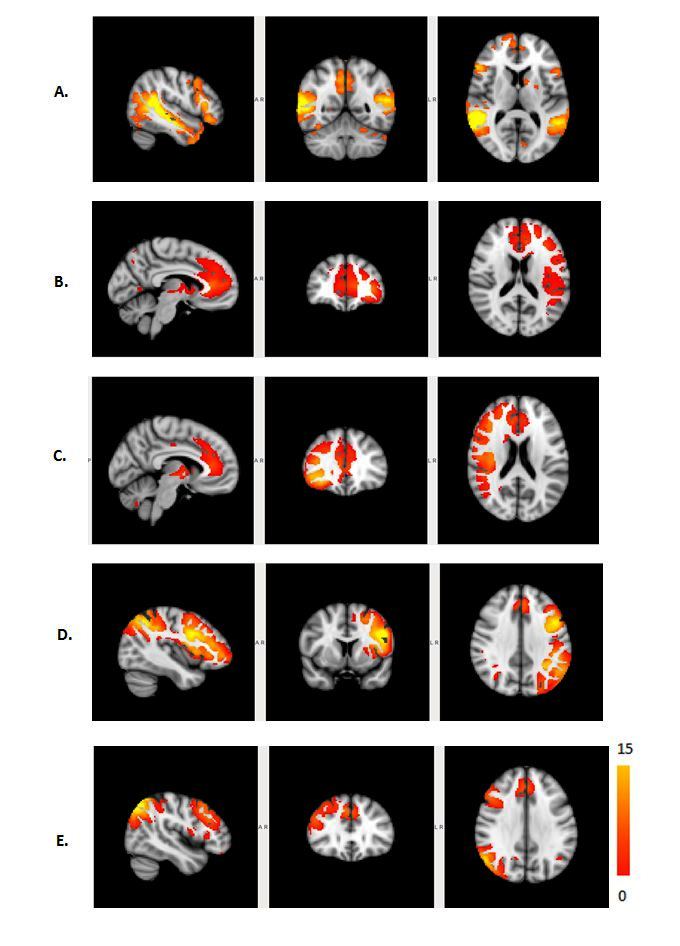
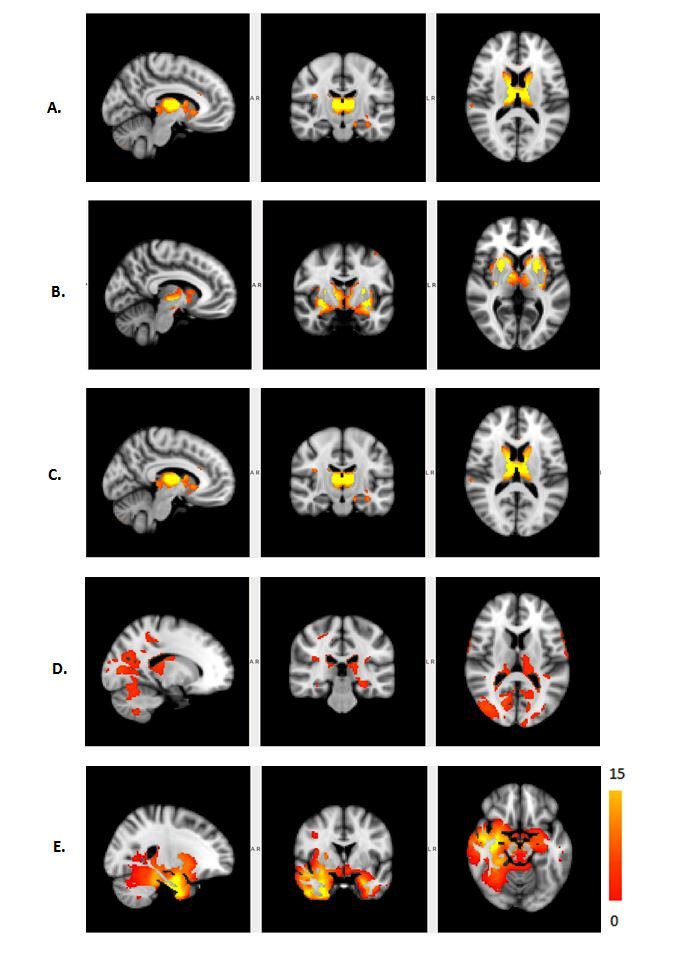
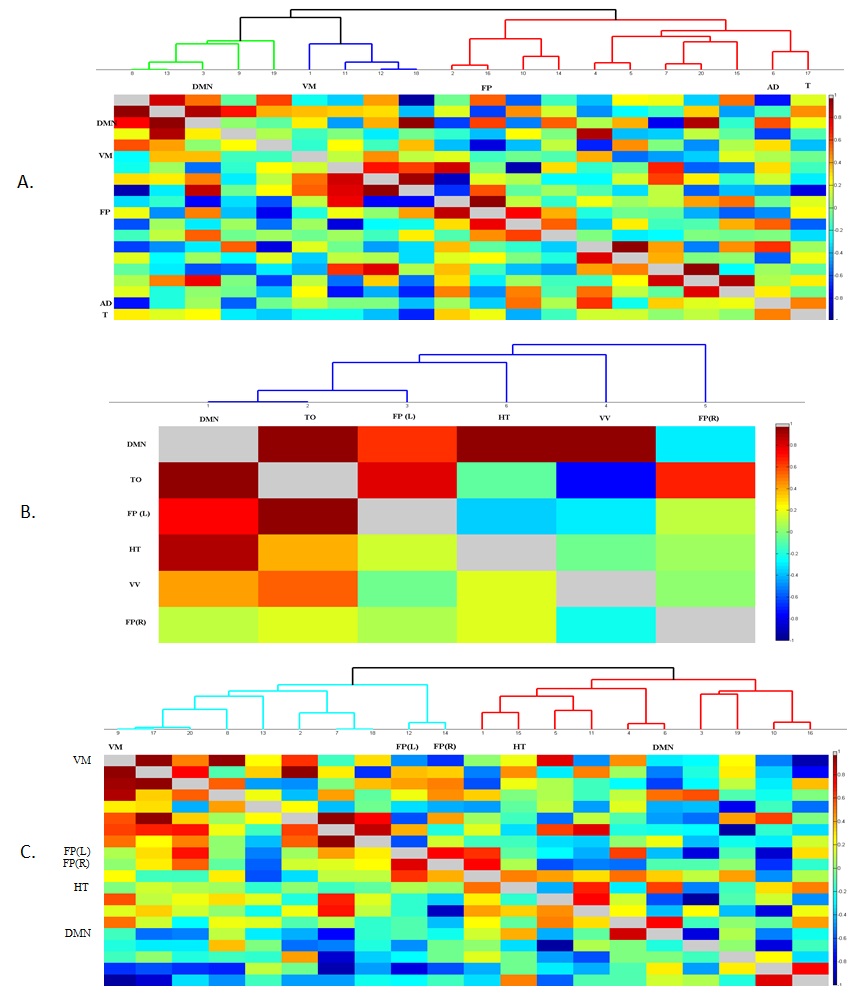
The Figure 1 – 4 shows DMN, Visual, Frontal-Parietal and Hippocampus/Thalamus networks of target and non-target stimuli in task-fMRI estimated by proposed method with their counter part of resting-state. In general, task stimuli observed to have higher de-synchronization in DMN, engagement of ventral pathway and hemispherical differences in frontal-parietal network while comparing resting-state. The functional connectivity through correlation of DMN with other networks (Figure 5) in task reveals modulation by task stimuli while comparing resting-state. DMN estimated for target stimuli correlates positively with visual (0.41105), frontal-parietal (Left:0.7459,Right:0.9621) and Hippocampus/Thalamus (0.878). The Non-target stimuli correlates positively with visual (0.1524), Hippocampus/Thalamus (0.3763) and negatively with frontal-parietal (Left:-0.1177,Right:-0.22). On the other hand, resting-state DMN correlates negatively with visual(-0.4771) and positively with frontal-parietal(0.4825) and Hippocampus/Thalamus(0.2459).Discussion
The proposed Hemodynamic-reorganization approach performs better than established approaches2-4 for task-fMRI studies due to following observations.
a. It reveals deactivation of DMN caused by every task stimulus and provides better insight in to network pathway.
b. It reveals engagement of visual ventral pathway during the target and non-target task stimulus whereas visual medial pathway was engaged during the rest. It is an established hypothesis5 that ventral stream pathway is specialized for object identification and activated during target detection task through visual search.
c. Further, effect of task stimuli on hemispherical difference on frontal-parietal pathway6,7 is clearly revealed as two independent frontal-parietal networks where resting-state frontal-parietal observed to be independent of hemispherical difference.
d. In addition, role of hippocampus in visual target detection task8 is also revealed in hippocampus/thalamus network of task. In resting-state, only thalamus network was observed without any role of hippocampus.
Conclusion
The proposed Hemodynamic-reorganization approach is able to map the functional connectivity modulation of every stimulus of task in visual search based target detection fMRI study.Acknowledgements
No acknowledgement found.References
1. Beckmann CF, Smith SM. Probabilistic independent component analysis for functional magnetic resonance imaging, IEEE Trans Med Imaging.2004;23(2):137-52
2. Sambataro F, Visintin E, Doerig N, Brakowski J, Holtforth MG, Seifritz E, Spinelli S. Altered dynamics of brain connectivity in major depressive disorder at rest and during task performance. Psychiatry Res. 2017;259:1-9.
3. Arbabshirani MR, Havlicek M, Kiehl KA, Pearlson GD, Calhoun VD. Functional network connectivity during rest and task conditions : A comparative study. Hum Brain Mapp. 2013;34(11):2959-71.
4. Matthew N DeSalvo, Linda Douw, Shigetoshi Takaya, Hesheng Liu, Steven M. Stufflebeam, Task-dependent reorganization of functional connectivity networks during visual semantic decision making, Brain and Behavior. 2014; 4(6): 877–885
5. Geniva Liu, Christopher G. Healey, James T. Enns. Target detection and localization in visual search: A dual systems perspective. Perception & Psychophysics. 2003, 65 (5), 678-694
6. Ruff CC, Blankenburg F, Bjoertomt O, Bestmann S, Weiskopf N, Driver J. Hemispheric differences in frontal and parietal influences on human occipital cortex: direct confirmation with concurrent TMS-Fmri. J Cogn Neurosci. 2009; 21(6) :1146-61.
7. Shulman GL, Pope DL, Astafiev SV, McAvoy MP, Snyder AZ, Corbetta M. Right hemisphere dominance during spatial selective attention and target detection occurs outside the dorsal frontoparietal network. J Neurosci. 2010; 30(10):3640-51
8. Ludowig E, Bien CG, Elger CE, Rosburg T. Two P300 generators in the hippocampal formation.Hippocampus. 2010;20(1):186-95.
Figures