2402
Multiband-enabled Resting State Functional Connectivity Mapping in Simultaneous PET/MRI1Department of Information Engineering, University of Padova, Padova, Italy, 2Padova Neuroscience Center, University of Padova, Padova, Italy, 3Department of Biomedical Engineering, King's College London, London, United Kingdom, 4Department of Diagnostic Medical Sciences, University of Padova, Padova, Italy
Synopsis
PET/MRI scanner is the ideal instrument to simultaneously study brain’s metabolism and fMRI-based functional connectivity (FC). State-of-the-art fMRI multiband (MB) EPI sequences on those scanners can be limited by the PET-transparent head coil receiver capabilities as the longitudinal coil elements organisation along head-feet direction is theoretically unable to provide sensitivity variation along this axis. In this work we provided optimal sequence settings for FC studies encompassing available out-of-plane (MB) and in-plane (iPAT) accelerations with two slice orientations demonstrating MB-EPI reliability for FC studies and how non conventional slice orientations can enhance supported MB acceleration factors.
Purpose
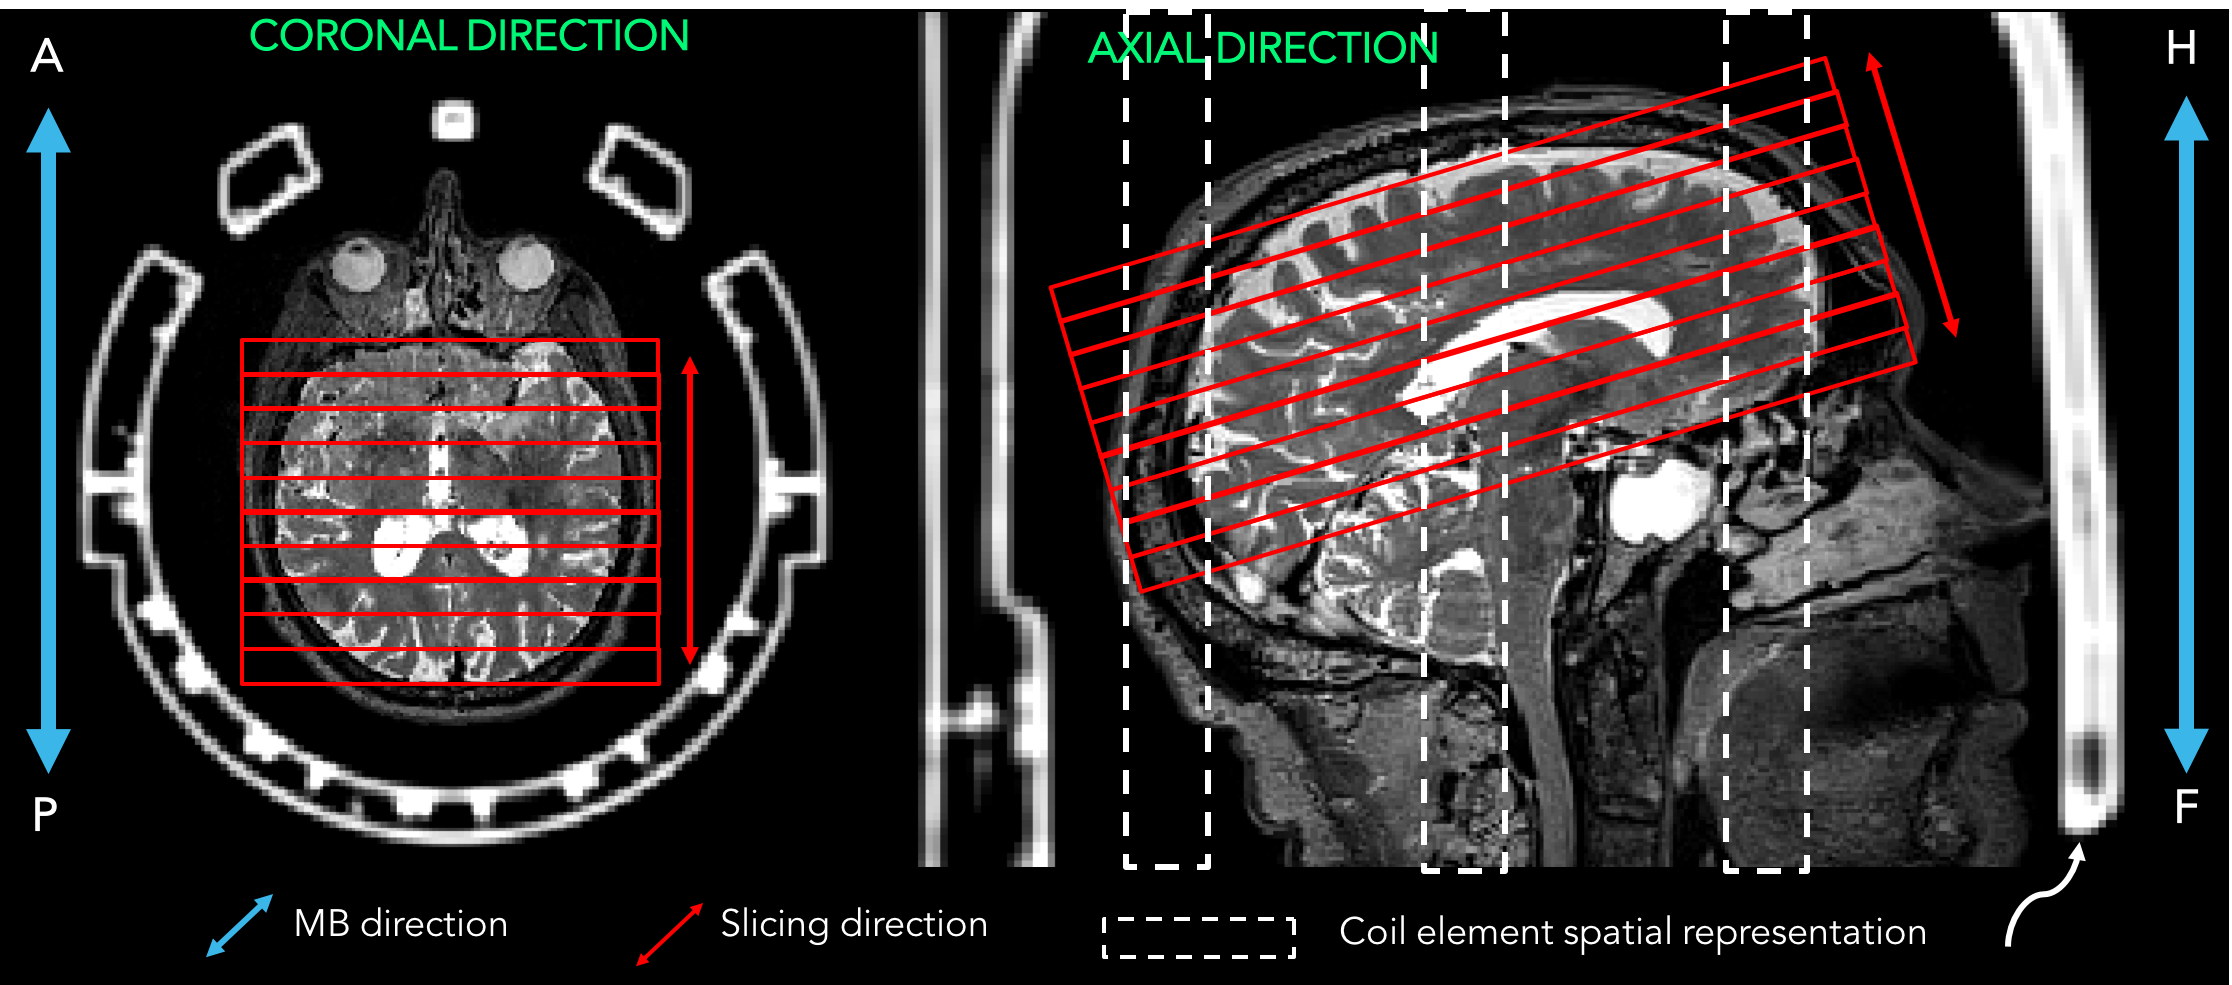
PET/MRI scanner is the ideal instrument to simultaneously study the brain’s functional metabolism and fMRI-based functional connectivity (FC). State-of-the-art fMRI, exploiting both multiband (MB) and parallel imaging (iPAT) echo planar imaging (EPI) sequences can be limited by the capabilities of PET-transparent head coil receivers of PET/MRI scanners. The limitation for MB imaging stems from the longitudinal organisation of the 12 coil elements along the head-feet direction, theoretically unable to provide sensitivity variation along this axis. In this work we aimed to provide optimal sequence settings for FC studies encompassing available out-of-plane (MB) and in-plane (iPAT) accelerations and two slice orientations (Axial: Ax, Coronal: Cor as in Figure 1).Materials and Methods
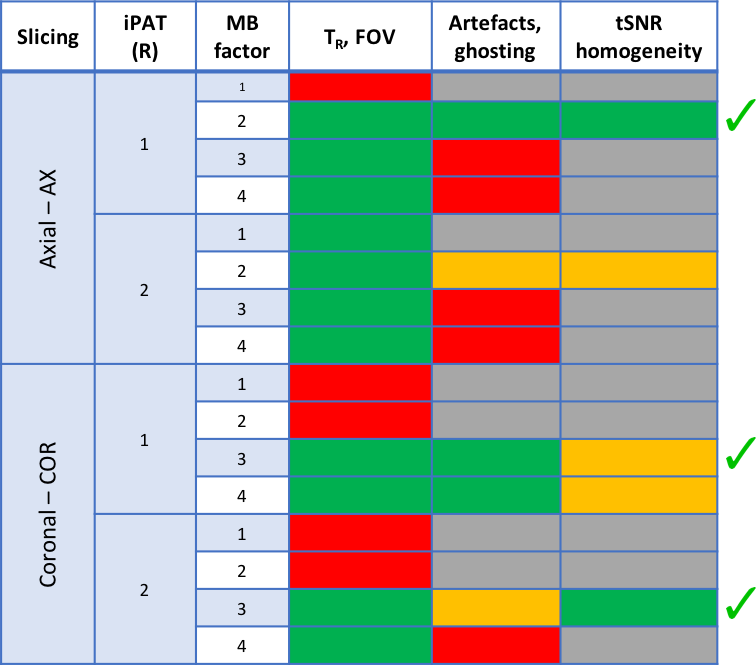
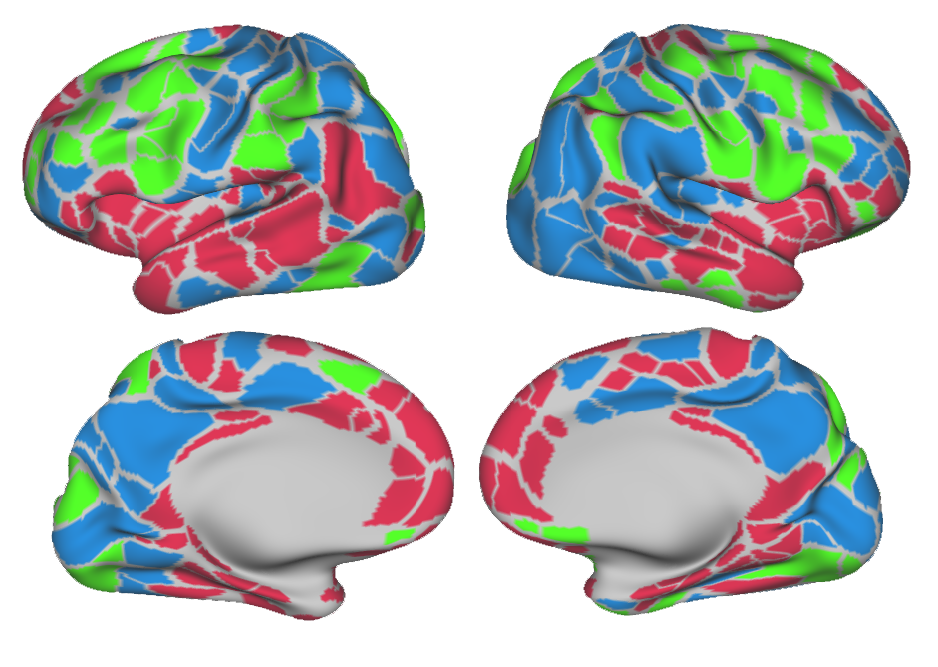
Ten healthy participants (25.2±4.3 y) were scanned on a Siemens Biograph mMR (12-channel commercial PET-transparent head coil). Five subjects underwent P1 protocol: structural T1w-MPRAGE (isotropic 1 mm voxel); 16 rs-fMRI short runs (50 volumes) of MB-EPI1 (R014) with factors reported in Table 1 but same voxel size (isotropic 3 mm), TR/TE (3700/30 ms) and flip angle (90°). fMRI data underwent standard pre-processing and temporal Signal to Noise Ratio (tSNR) evaluation in native EPI space. Adopted image quality criteria (Table 1) were: reachable parameters (TR, coverage i.e. field of view, FOV); ghosting, artefact content, tSNR amplitude and spatial homogeneity. Initial EPI-compliant settings were further examined on remaining subjects during P2 test/retest (T/RT) protocol: structural T1 (as P1); 3 rs-fMRI runs (600 volumes) of MB-EPI, repeated with opposed phase encoding direction and geometrically matched spin-echo EPI for distortion correction. These runs are referred by 3-digit labels: Axial (Ax)/Coronal (Cor) slice orientation, iPAT acceleration (R) factor (R, 1 or 2), MB factor (MB, 2 or 3). Run AxR1MB2 collected 40 axial slices with TR=1260 ms in A-P phase encoding direction (PEdir). Run CorR1MB3 and CorR2MB3 collected 60 coronal slices (L-R PEdir) with TR respectively 1261 ms and 1090 ms. FA was set to Ernst angle, other settings were maintained from P1. fMRI extended pre-processing consisted of distortion and motion correction, nuisance regression (motion and first order derivatives, compcor2 regressors, high-pass filter set at 0.009 Hz). Pre-processed fMRI data was sampled (FreeSurfer, Connectome Workbench) over a surface-based functional parcellation3. Pearson linear cross-correlation of parcel’s fMRI time series provided 12 Fisher-transformed FC matrices/subject. FC matrices of 150 subjects from the Human Connectome Project dataset4 were collected as FC reference. Node strength (STR) was evaluated summing the edge weights of each FC matrix. T/RT reliability was evaluated by intra class correlation coefficient (ICC) between FC matrices while FC structural agreement with Spearman correlation.Results
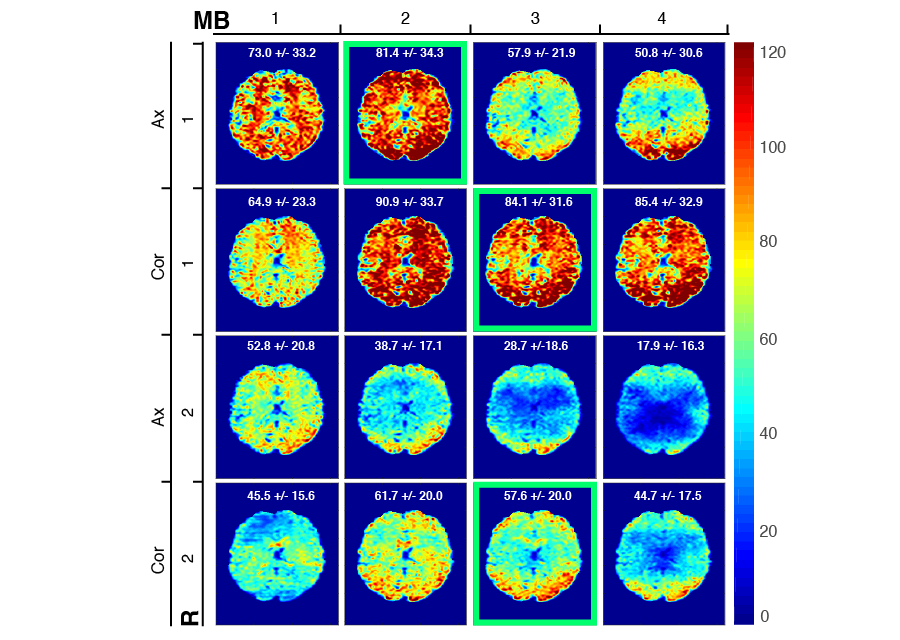
P1: Figure 2 report the tSNR dependency on acceleration (MB, iPAT). Coronal orientation provided higher tSNR than axial one with significant advantages in temporal/subcortical areas. Three over 16 settings were further investigated (Table 1). P2: Obtained FC matrices had similar T/RT intra-subject repeatability (ICC(1,1)=0.64) to HCP (ICC(1,1) = 0.64 +/- 0.09) and T/RT FC structural agreement (AxR1MB2: = 0.69; CorR1MB3: = 0.65; CorR2MB3: = 0.63) to HCP dataset (=0.61). Strength derived from average FC with each of the three setups was in high linear agreement (R2, AxR1MB2: 0.67; CorR1MB3: 0.71; CorR2MB3: 0.81) with STR from average FC of HCP (HCP intra-dataset R2 = 0.85). Coronal settings (CorR1MB3, CorR2MB3) provided in most of the brain parcels (86%) better STR agreement (minimal relative error) to the HCP reference compared to axial (AxR1MB2) one (Figure 3).Discussion
In this study we identified 3 settings (P1) adequate for reliable FC estimation in PET/MRI scanners. Maximally achievable MB factor was found to dependent on slice orientation: along axial orientation MB factor was limited at 2 (without iPAT) providing an overall limited FOV while coronal orientation reliably supported even MB=3 with iPAT (R=2) and full brain coverage as predicted by the enhanced coil sensitivity profile usage. Estimated FC matrices (P2) were in high structural agreement with HCP reference and had comparable T/RT performances. Slice orientation was the strongest factor over MB-EPI performance, emphasizing the need for PET-transparent receiver RF coils supporting MB imaging along arbitrary orientations.Conclusion
MB-EPI sequences provided short TR that brain network studies nowadays require. We selected three different MB-EPI settings suitable for high quality FC assessment, the overall best of them (CorR2MB3) make use of a coronal slice direction to support higher MB accelerations than traditional axial and the iPAT usage relevant for multi-echo studies. Future rsfMRI studies in combined PET/MRI scanners can benefit from these optimised settings to investigate both spatially extended (i.e. including the cerebellum) and reliable brain functional properties.Acknowledgements
We acknowledge that multi band EPI sequence was made available from University of Minnesota through the C2P Siemens sharing mechanism.References
1. S. Moeller, E. Yacoub, C. A. Olman, E. Auerbach, J. Strupp, N. Harel, and K. Uğurbil, “Multiband multislice GE-EPI at 7 tesla, with 16-fold acceleration using partial parallel imaging with application to high spatial and temporal whole-brain fMRI,” Magn. Reson. Med., vol. 63, no. 5, pp. 1144–1153, May 2010.
2. Y. Behzadi, K. Restom, J. Liau, and T. T. Liu, “A component based noise correction method (CompCor) for BOLD and perfusion based fMRI,” Neuroimage, vol. 37, no. 1, pp. 90–101, Aug. 2007.
3. E. M. Gordon, T. O. Laumann, B. Adeyemo, J. F. Huckins, W. M. Kelley, and S. E. Petersen, “Generation and Evaluation of a Cortical Area Parcellation from Resting-State Correlations,” Cereb. Cortex, vol. 26, no. 1, pp. 288–303, Jan. 2016.
4. D. C. Van Essen, S. M. Smith, D. M. Barch, T. E. J. Behrens, E. Yacoub, and K. Ugurbil, “The WU-Minn Human Connectome Project: An overview,” Neuroimage, vol. 80, pp. 62–79, Oct. 2013.
Figures