2401
Functional connectivity sensitivity to image acceleration and orientation in simultaneous PET/MRI1Department of Information Engineering, University of Padova, Padova, Italy, 2Padova Neuroscience Center, University of Padova, Padova, Italy, 3Department of Biomedical Engineering, King's College London, London, United Kingdom, 4Department of Diagnostic Medical Sciences, University of Padova, Padova, Italy
Synopsis
Resting state fMRI (rs-fMRI) permits in-vivo characterization of brain’s functional connectivity (FC). Multi-Band accelerated EPI allows to improve the temporal resolution of rs-fMRI data and, potentially, to achieve a better characterization of the brain network correlations. However, the impact of image acceleration and orientation on FC structure has not been quantified. In this work we investigated FC changes related to image acceleration effects in a test/retest rs-fMRI protocol. We found FC differences involving relevant networks, confirmed even by graph analysis of the FC maps. Our findings explore the lower bound of single-subject FC reliability and network-dependent acceleration sensitivity.
Purpose
Resting state fMRI (rs-fMRI) allows in-vivo characterization of brain’s functional connectivity (FC) and its decomposition in resting networks (RSNs). However, many confounds can bias rs-fMRI derived FC estimations. Multi-Band EPI (MB-EPI) sequences can help in this by improving both temporal noise characterization and statistical power but the impact of acceleration on FC underpinning structures have been poorly investigated. In this work, we characterized FC structural changes caused by acceleration and orientation in a test/retest rs-fMRI protocol by varying MB and/or Parallel Imaging (iPAT) factors.Materials and Methods
Subjects: five healthy participants (25.2 ± 4.3 y) scanned on a Siemens Biograph mMR 3T (12-channel PET-transparent head coil).
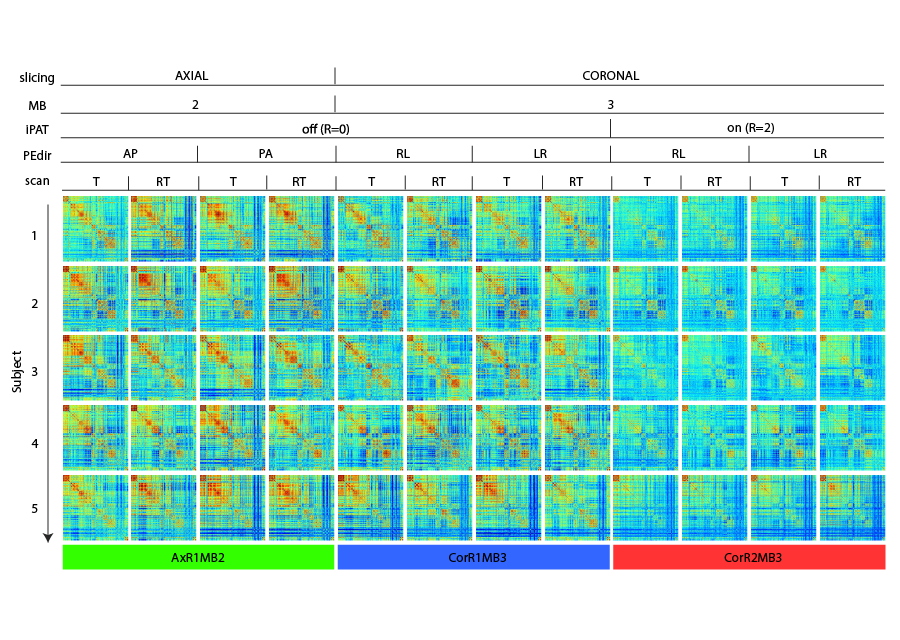
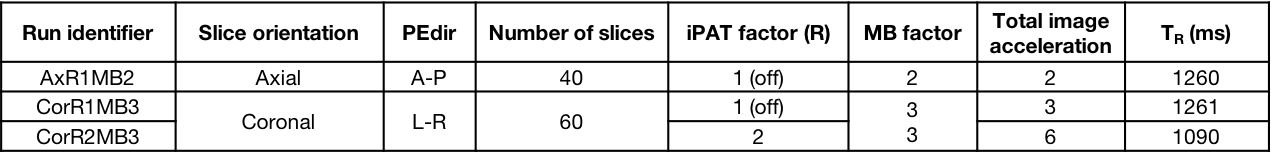
Acquisition Protocol: Six rs-fMRI runs (MB-EPI1 R014, 600 volumes each), 3 along opposed phase encoding directions (PEdir), additional parameters in Table 1. Geometrically matched spin-echo pair for distortion correction and T1w-MPRAGE (1 mm isotropic) for co-registration and brain parcellation purposes.
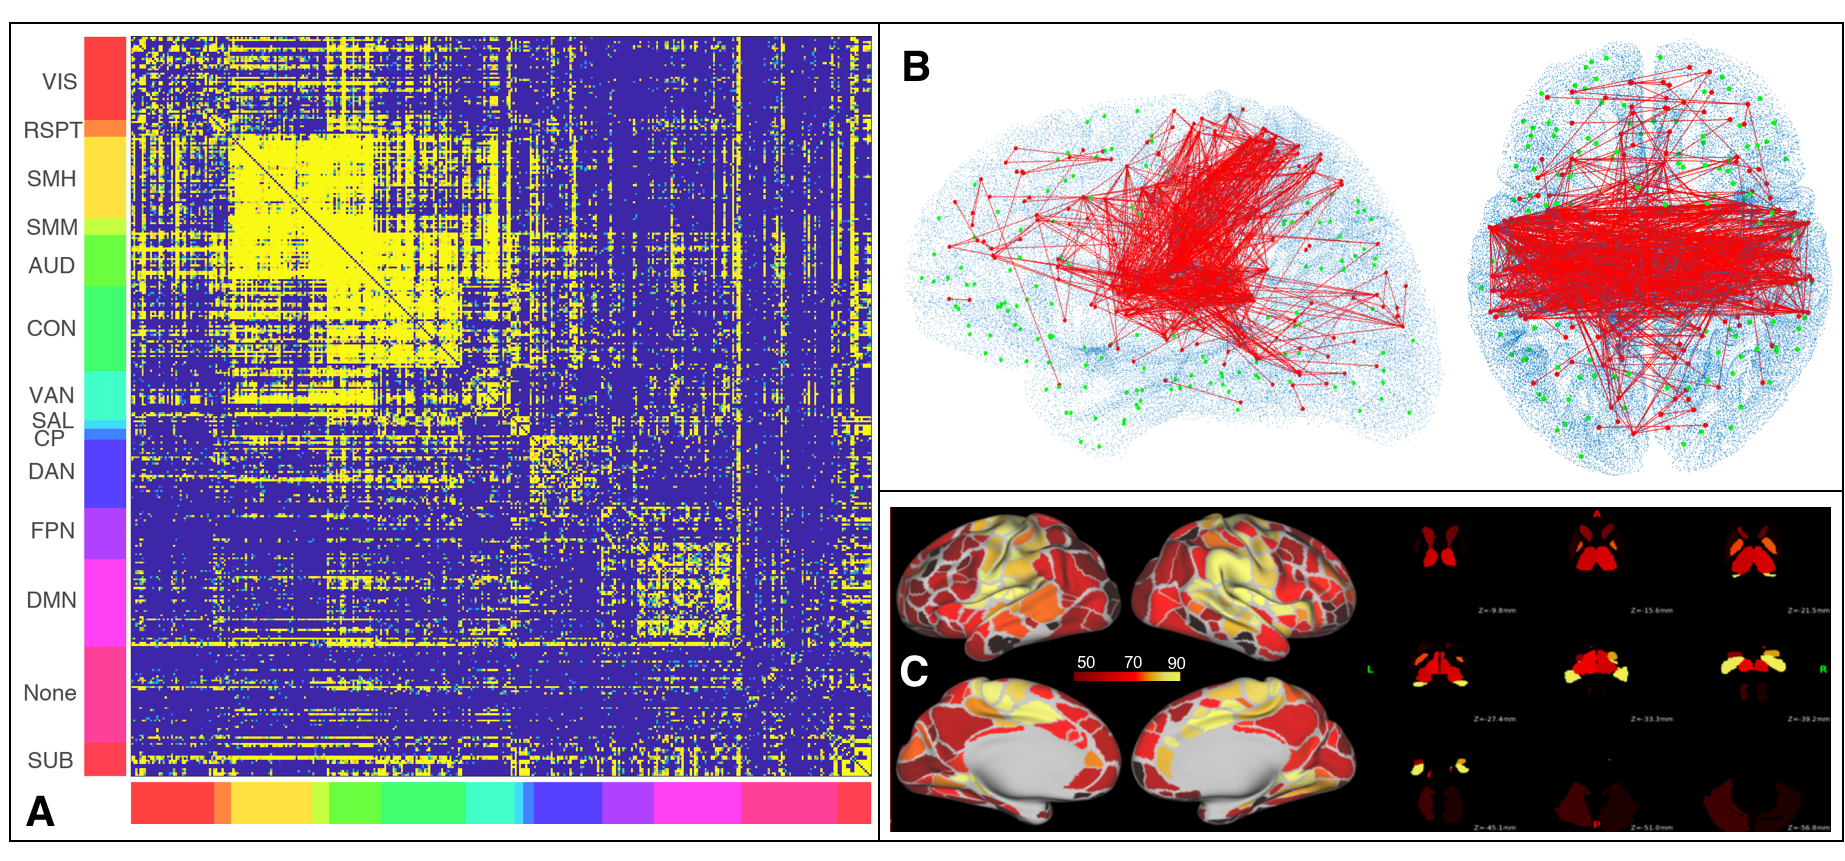
Image Processing: standardly pre-processed rs-fMRI data2 was sampled (FreeSurfer3, Connectome Workbench4) over a surface-based functional parcellation5. Parcel signals were Pearson cross-correlated6 to obtain FC matrices (Figure 1), characterised by node Degree (DEG), Strength (STR), Local Efficiency (LE) and Betweeness Centrality (BC) graph metrics7,8. By definition of Pearson correlation, the temporal covariance of two signals is divided by the product of their temporal standard deviations, thus any experimental setup able to modify temporal variance or covariance could affect FC estimation. To measure changes in signal variances related to noise propagation with increasing accelerations, we calculated temporal Signal to Noise Ratio (tSNR) and Physiological Contribution in Spontaneous Oscillations9 (PICSO) at parcel level. FC values were linearly regressed to tSNR and PICSO (multiplied for the involved areas) to describe noise propagation effects over three rs-fMRI settings, separately adding a categorical covariate to describe slicing orientation effects. A similar regression was carried out over FC-derived graph metrics. Statistical FC differences were investigated with ANOVA-1w test (setting as factor), FDR correction (0.05 level) and paired t-test as post-hocs.
Results
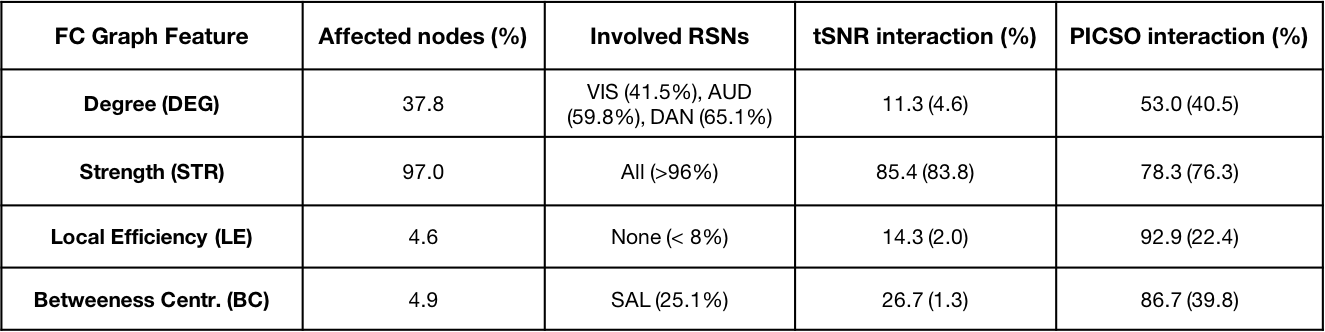
Significant FC differences were found between different settings (Figure 2-A), describing a monotonically decreasing FC trend with the total acceleration. These differences structurally affected sensory-motor (SMM, SMH, AUD), cingulo-opercular (CON), ventral (VAN), default mode (DMN) and subcortical (SUB) networks (Figure 2-B,C). A significant linear association between FC amplitude and both tSNR and PICSO products was respectively found in 75.3%, 67.2% of setting-affected FC edges. However, considering the slicing orientation covariate, this association respectively held only in 17.4% and 24.0% of setting-affected edges. Overall, noise metrics were not associated to FC amplitude when evaluated intra-setting (associated in < 3% of the edges). Observed FC differences were confirmed by FC graph metrics (Table 2). In most of the parcels, FC graph metrics differences were again linearly associated to noise effects along different sequence settings but not intra-setting.Discussion
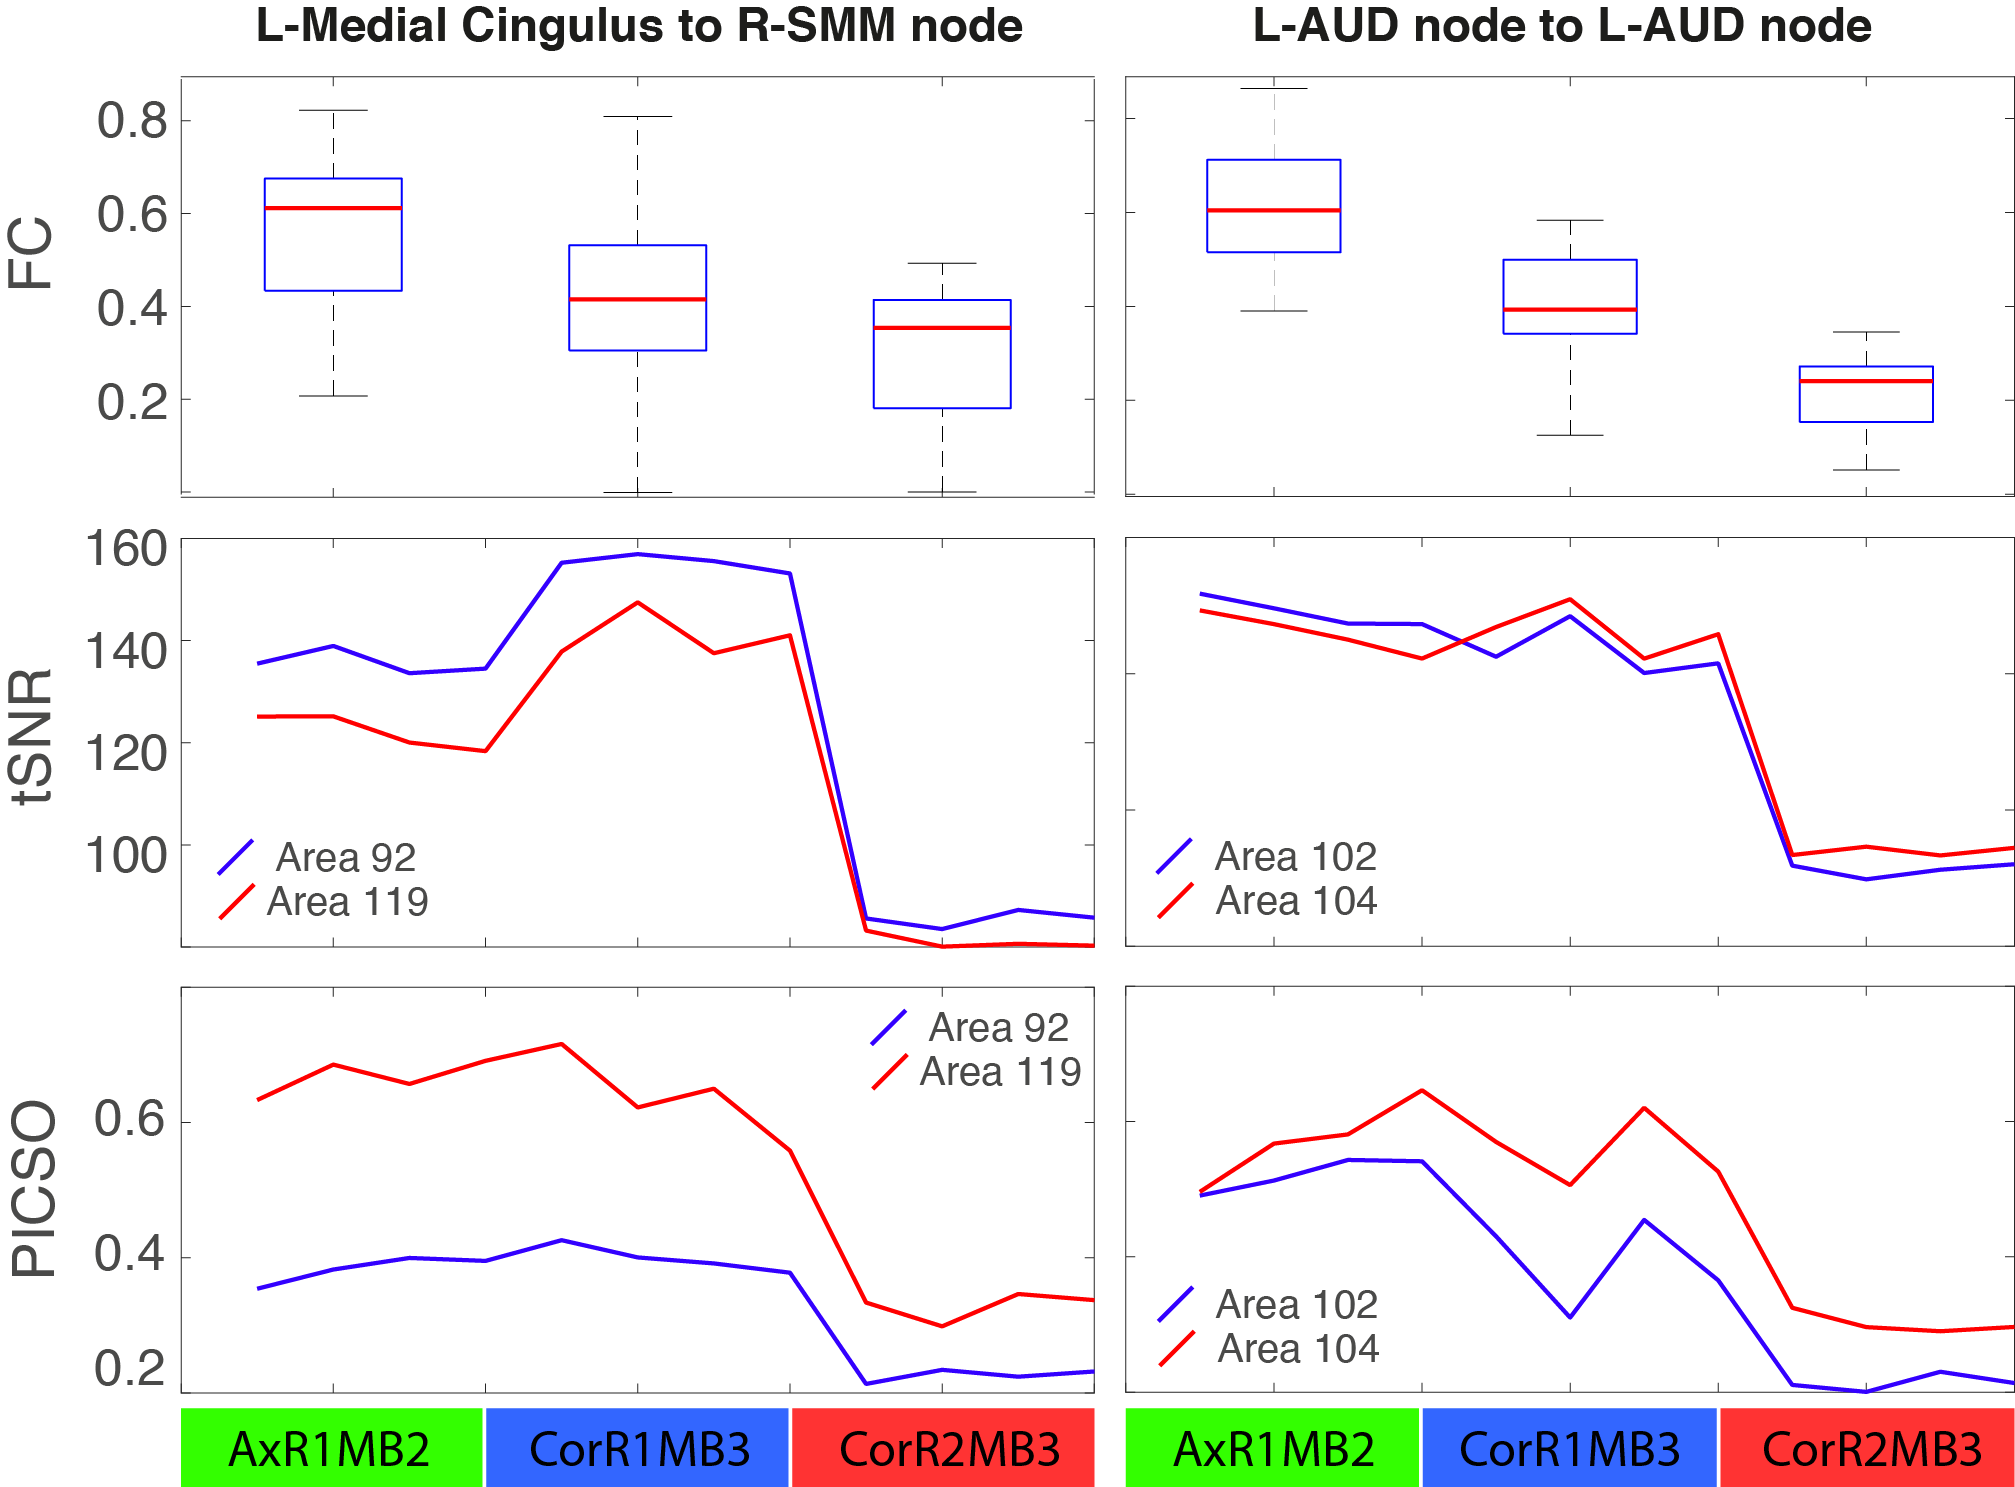
Increasing acceleration factors in rs-fMRI FC studies can improve characterization and removal of physiological confounds (motion, cardiac, respiratory, etc.) which could bias FC evaluation enhancing its statistical significance. However, we found it also lowers FC amplitudes of many relevant RSNs (Figure 2). Observed FC differences were mostly related to an enhanced noise propagation level due to increased accelerations over three sequence settings used. We have been able to pinpoint this effect by virtue of the equi-parameterized (other than acceleration) and equi-processed rs-fMRI data, a condition expected to provide same average signal and confound level in all sequence settings. In this condition, tSNR and PICSO are maximally sensitive to temporal variance differences related to noise propagation rather than subject-level effects. Their observed linear association to FC amplitude suggests that acceleration-derived noise increase plays a fundamental role over the observed FC alterations at single-subject level. However, as showed in Figure 5, this relation does not always hold at edge-level as the FC amplitude decrease is not accompanied by a lower tSNR (thus an increased temporal signal variance) from AxR1MB2 to CorR1MB3, though the overall trend is maintained. This inconsistence can be explained in terms of different receive head coil performance along different slicing orientations that alter noise propagation probed by tSNR. Taken together, these results point toward PICSO metric to consistently describe FC structural alterations in single-subject FC studies.Conclusion
Brain’s FC can be structurally altered at single-subject level by the image acceleration, differentially affecting RSNs connectivity. Noise arguments were able to predict these differences and, even if ineffective to describe inter-subject FC variability, they describe a non trivial interplay between temporal covariance and signal variance over FC estimation.Acknowledgements
We acknowledge that multi band EPI sequence was made available from University of Minnesota through the C2P Siemens sharing mechanism.References
1. S. Moeller, E. Yacoub, C. A. Olman, E. Auerbach, J. Strupp, N. Harel, and K. Uğurbil, “Multiband multislice GE-EPI at 7 tesla, with 16-fold acceleration using partial parallel imaging with application to high spatial and temporal whole-brain fMRI,” Magn. Reson. Med., vol. 63, no. 5, pp. 1144–1153, May 2010.
2. Y. Behzadi, K. Restom, J. Liau, and T. T. Liu, “A component based noise correction method (CompCor) for BOLD and perfusion based fMRI,” Neuroimage, vol. 37, no. 1, pp. 90–101, Aug. 2007.
3. B. Fischl, M. I. Sereno, and A. M. Dale, “Cortical Surface-Based Analysis,” Neuroimage, vol. 9, no. 2, pp. 195–207, Feb. 1999.
4. M. F. Glasser, S. N. Sotiropoulos, J. A. Wilson, T. S. Coalson, B. Fischl, J. L. Andersson, J. Xu, S. Jbabdi, M. Webster, J. R. Polimeni, D. C. Van Essen, and M. Jenkinson, “The minimal preprocessing pipelines for the Human Connectome Project,” Neuroimage, vol. 80, pp. 105–124, Oct. 2013.
5. E. M. Gordon, T. O. Laumann, B. Adeyemo, J. F. Huckins, W. M. Kelley, and S. E. Petersen, “Generation and Evaluation of a Cortical Area Parcellation from Resting-State Correlations,” Cereb. Cortex, vol. 26, no. 1, pp. 288–303, Jan. 2016.
6. L. Geerligs, M. Rubinov, Cam-CAN, and R. N. Henson, “State and Trait Components of Functional Connectivity: Individual Differences Vary with Mental State,” J. Neurosci., vol. 35, no. 41, pp. 13949–13961, Oct. 2015.
7. M. Rubinov and O. Sporns, “Complex network measures of brain connectivity: Uses and interpretations,” Neuroimage, vol. 52, no. 3, pp. 1059–1069, Sep. 2010.
8. E. Bullmore and O. Sporns, “Complex brain networks: graph theoretical analysis of structural and functional systems,” Nat. Rev. Neurosci., vol. 10, no. 4, pp. 312–312, 2009.
9. A.-L. Hsu, K.-H. Chou, Y.-P. Chao, H.-Y. Fan, C. W. Wu, and J.-H. Chen, “Physiological Contribution in Spontaneous Oscillations: An Approximate Quality-Assurance Index for Resting-State fMRI Signals,” PLoS One, vol. 11, no. 2, p. e0148393, Feb. 2016.
Figures