2400
The investigation of brain functional alterations of MCI patients by using two novel non-linear analysis techniques1Capital Medical University, Beijing, China, 2Clincial Science, Philips Healthcare, Guangzhou, China
Synopsis
In this paper, we proposed two novel non-linear analysis methods including cross-sample entropy of ordinal pattern and inner composition alignment (IOTA) of ordinal pattern to construct brain network based on functional magnetic resonance imaging. Group-level statistical comparisons were performed to investigate the differences of brain networks. The results showed that the network related to hippocampus, amygdala and posterior cingulate cortexin in mild cognitive impairment (MCI) participants significantly differ from in normal controls. Our results suggest that both the non-linear methods can be applied to estimate the characteristics of brain network in MCI.
Introduction
Patients with MCI generally show a higher likelihood of developing Alzheimer’s disease (AD) than normal aging people, which highlights the importance of early detection of abnormal brain network in MCI. Pearson correlation has been widely used in functional connectivity measurement as a linear technique. However, linear analysis may not be suited to detect properties of brain network since brain system is a complex system for which non-linear brain network construction method seems more suitable 1. Therefore, we proposed two non-linear brain network construction methods, cross-sample entropy of ordinal pattern and IOTA of ordinal pattern 2 to capture non-linear association between brain regions.Methods
All the fMRI data came from Alzheimer’s Disease Neuroimaging Initiative (ADNI). Fifty eight subjects were involved in this study. They were divided into two groups according to the scores of Mini-Mental State Examination and Clinical Dementia Rating scale: 29 subjects with MCI and 29 normal controls (NC). The fMRI data were preprocessed using DPARSF (data processing assistant for resting-state fMRI) software, the processing procedure contains slice timing, realign, normalization and smooth. Preprocessed fMRI data were divided into 90 brain regions based on automatic anatomical labeling (AAL) atlas, then we implemented Pearson correlation, cross-sample entropy of ordinal pattern and IOTA of ordinal pattern for each subject respectively to describe the relationship between each pair of the 90 brain sub-regions. Multiple comparison two sample t tests (p<0.005, no correction) were applied to find the statistical difference between MCI patients and NC for the three methods using GRETNA (graph-theoretical network analysis) software.Results
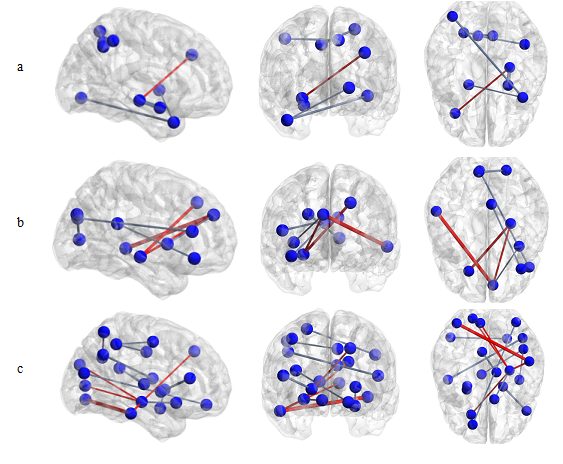
Demographic and clinical characteristics of 58 subjects were listed below (Table1). Brain connectivity matrixes with different methods were shown in Figure 1. The difference of the functional networks between MCI and NC were showed in Figure 2.Discussion
Compared with Pearson correlation, cross-sample entropy of ordinal pattern and IOTA of ordinal pattern have some advantages: firstly, in theory, they exhibit robustness, stability and invariance to nonlinear monotonic transformation. Secondly, they emphasize information interaction of nonlinear time series: cross-sample entropy of ordinal pattern is good at analyzing dynamic persistence of interaction between time series, and IOTA of ordinal pattern can measure time series’ synchro coupling.Statistical analysis suggests some abnormal brain regions found by Pearson correlation are hippocampus, amygdala. Apart from these two regions, by cross-sample entropy of ordinal pattern and IOTA of ordinal pattern, we found extra abnormal regions such as angular gyrus, posterior cingutate and inferior temporal gyrus, which are mainly located in default mode network. Therefore the two new nonlinear methods can reveal abnormality in brain network of MCI.Conclusion
This study shows cross-sample entropy of ordinal pattern and IOTA of ordinal pattern can effectively applied to describe the brain functional connectivity in MCI patients.Acknowledgements
No acknowledgement found.References
1. Wang ZJ, Lee PW, Mckeown MJ. A novel segmentation, mutual information network framework for EEG analysis of motor tasks. Biomed Eng Online (2009) 8:9. doi:10.1186/1475-925X-8-9.
2. Zhao, Xiaojun & Shang, Pengjian & Wang, Jing. (2013). Measuring information interactions on the ordinal pattern of stock time series. Physical review. E, Statistical, nonlinear, and soft matter physics. 87. 022805. 10.1103/PhysRevE.87.022805.
Figures
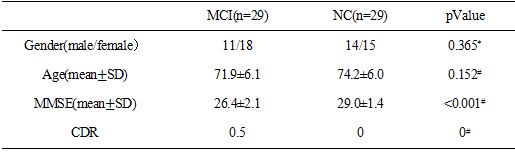
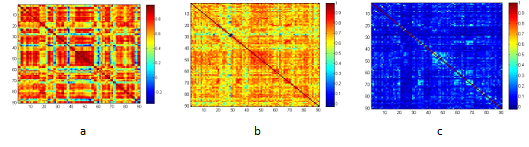
Figure1. Brain network matrix with Pearson correlation (a),cross-sample entropy of ordinal pattern (b) and IOTA of ordinal pattern(c) of a MCI patient.