2399
Estimating the time-lag of neuronal activity for the default mode network using multi-band EPI acquisitions in resting-state fMRIAtsushi Tachibana1,2,3, Yoko Ikoma1, Yasuhiko Tachibana1, Jeff Kershaw1, Yoshiyuki Hirano4, Katsutoshi Murata5, Tatsuya Higashi1, and Takayuki Obata1,2
1Applied MRI Research, Department of Molecular Imaging and Theranostics, National Institute of Radiological Sciences, QST, Chiba, Japan, 2Department of Radiological Sciences, Graduate School of Human Health Sciences, Tokyo Metropolitan University, Tokyo, Japan, 3Department of Radiology, AIC Yaesu Clinic, Tokyo, Japan, 4Research Center for Child Mental Development, Chiba University, Chiba, Japan, 5Siemens Healthcare K.K., Tokyo, Japan
Synopsis
Conventional EPI requires a temporal resolution of 2-3 seconds to obtain whole-brain data for resting-state fMRI (rsfMRI). More recently, multi-band EPI (MB) acquisition can be used to improve temporal resolution and obtain whole-brain coverage in less than 1 second. Our hypothesis is that MB acquisition can be used to detect the time-lag of neuronal activity. In this study, we estimated the time-lag in the default mode network using conventional (TR 2000 ms) and MB (TR 500 ms) rsfMRI. Significant time-lags between PCC and AG, and between mPFC and AG were detected only for the MB acquisition.
Introduction
Functional MRI (fMRI) measures brain activity using blood oxygenation level-dependent (BOLD) contrast. Resting-state fMRI (rsfMRI) examines spontaneous brain function using BOLD in the absence of a task, and the default mode network (DMN) can be identified from that. The DMN is commonly shown to be active when the brain is in an awake resting state and has connectivity between the posterior cingulate cortex (PCC), medial prefrontal cortex (mPFC) and angular gyrus (AG) (1). The conventional acquisition method using single-shot EPI (Conv) needs a longish TR (e.g. 2000 ms). More recently, multi-band accelerated EPI (MB) has been developed by the University of Minnesota, and it allows whole-brain fMRI coverage in less than TR 1000 ms (down to TR 500 ms) (2). This faster imaging improves temporal resolution as well as allows more accurate sampling of physiologic confounds and potentially increases the sensitivity to detect rsfMRI networks in the brain. Moreover, it might be possible to estimate the time-lag of neuronal activity for rsfMRI networks.Purpose
In this study, we evaluated whether the time-lag between active regions of the DMN is detectable using Conv and MB for rsfMRI.Methods
Ten subjects participated in this study. RsfMRI acquisitions using Conv (TR 2000 ms) and MB (TR 500 ms, MB factor 6) were performed on a MAGNETOM Verio 3T MRI scanner with 32ch head coil (Siemens Healthcare, Erlangen, Germany). Other parameters were: TE 25 ms (Conv) and 30 ms (MB), number of acquisitions 204 (Conv) and 600 (MB), FOV 240 mm, spatial resolution 3.8 x 3.8 x 3.8 mm3. All subjects were instructed to lie still and remain awake with their eyes open watching the red dot that was displayed on the screen. High-resolution T1 MPRAGE images were collected for co-registration with functional images.RsfMRI data were preprocessed using the DPARSF program (3). The first 10 time points were discarded to allow for T1 equilibration effects. Head motion correction and reorientation were performed. The data were then normalized into Montreal Neurologic Institute (MNI) space using unified segmentation of the T1 images. After smoothing with a 4 mm FWHM Gaussian kernel, white matter and cerebrospinal fluid regions were removed.
Seed-based correlation analysis was performed to observe the functional brain connectivity. The functional brain images were mapped to the automated anatomical labeling (AAL) brain template, and then separated into multiple anatomical brain regions. The PCC was selected as the volume-seed-ROI to produce time-dependent one-dimensional seed data (Fig 1-1). Volume data was also extracted from the PCC, mPFC and AG. The cross-correlation (CCor) between the PCC seed data and data from each pixel (shifted in time) in each region was then calculated and averaged (Fig 1-2). The time-lag between these regions was then calculated as the time corresponding to the maximum of the CCor after shifting the data in time (Fig 1-3).
Results
A significant time-lag was detected between PCC and AG for both the Conv and MB data (p<0.05/3) (Fig 2). In addition, a significant difference in the time-lags observed for mPFC and AG was found for the MB data (p<0.05/3) (Fig 2). The time-lag curves and CCor-map calculated for the Conv and MB data from one subject is shown (Fig 3). A higher CCor at a time-lag of -1000 ms was detected in AG only for the MB data, while the CCor for PCC, mPFC and AG were all highest at a time-lag of 0 ms for the Conv data. Note that the data from two subjects were removed from the analysis because the maximum value of CCor was less than 0.4.Discussion
Neuronal connectivity between active regions has been proposed for the DMN. As time-lags between PCC and AG, and between mPFC and AG were only found for the MB data, our results suggest that the MB protocol may be more sensitive to the time-lag than Conv.Conclusion
In this study, we succeeded in estimating the time-lags between three neuronally active regions in the DMN using MB acquisition for rsfMRI.Acknowledgements
No acknowledgement found.References
- Barkhof F, Haller S, Rombouts SA. Resting-state functional MR imaging: a new window to the brain. Radiology. 2014;272(1):29-49.
- CMRR, Minnesota university. https://www.cmrr.umn.edu/multiband/
- Chao-Gan Y, Yu-Feng Z.han. DPARSF: A MATLAB Toolbox for "Pipeline" Data Analysis of Resting-State fMRI. Front Syst Neurosci. 2010;14:4:13.
Figures
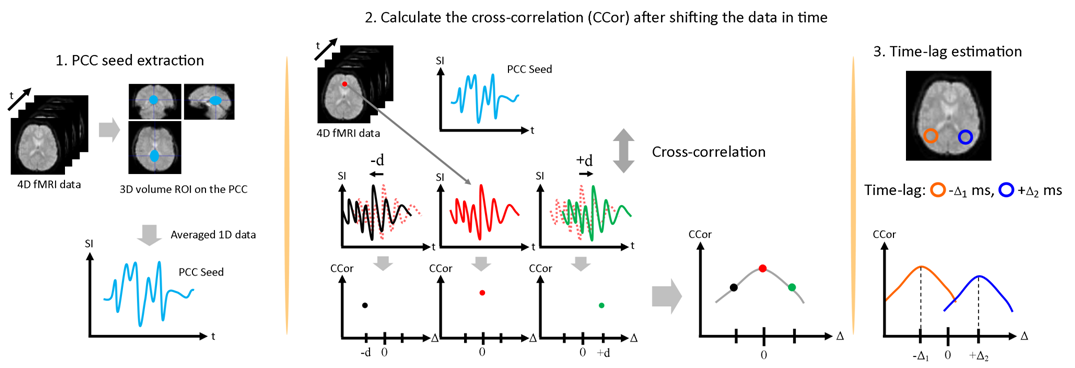
Procedure
for the time-lag assessment. (1) PCC-volume-seed was extracted. (2) The
cross-correlation (CCor) between the PCC seed and the time-shifted data from
other ROI’s was calculated. (3) Time-lag was estimated.
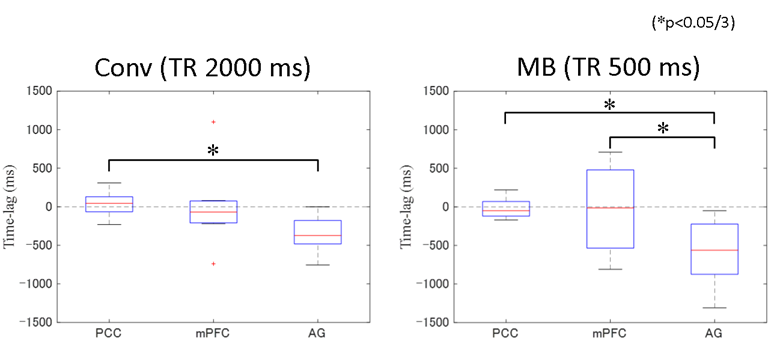
Time-lag
assessment for Conv and MB. Significant time-lag differences were detected
between PCC and AG for both Conv and MB data (p<0.05/3). A significant
difference in the time-lags between mPFC and AG was found only for MB data
(p<0.05/3).
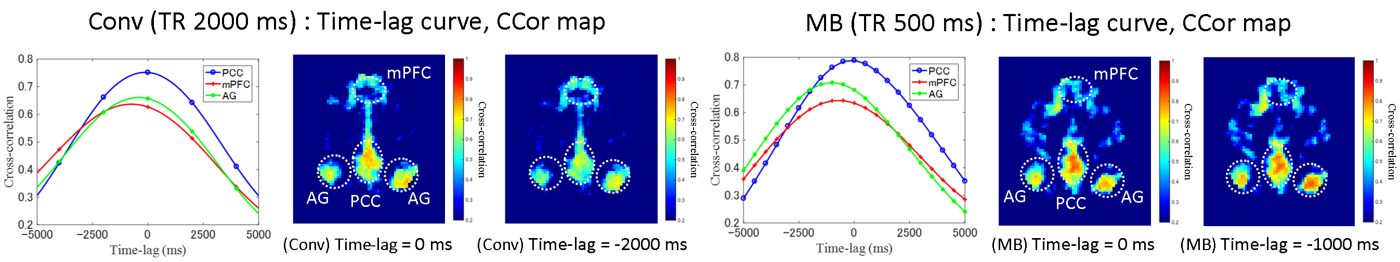
Time-lag
curves and CCor maps for both the Conv and MB data from a single subject.
Higher CCor in AG at a time-lag of -1000 ms was detected only for the MB data.
The CCor for PCC, mPFC and AG were all highest at a time-lag of 0 ms for the
Conv data.