2397
Preserving Maximal Spatial Specificity in Resting State Group Analysis at 7 Tesla1Neurology, Max Planck Institute for Human Cognitive and Brain Sciences, Leipzig, Germany, 2MaxNetAging, Max Planck Institute for Demographic Research, Rostock, Germany, 3Montreal Neurological Institute and Hospital, Montreal, QC, Canada, 4McGill University, Montreal, QC, Canada, 5Physics, Concordia University / PERFORM Centre, Montreal, QC, Canada, 6Cerebral Imaging Center, Douglas Mental Health University Institute, McGill University, Montreal, QC, Canada, 7Netherlands Institute for Neuroscience, Amsterdam, Netherlands, 8Spinoza Centre for Neuroimaging, Amsterdam, Netherlands
Synopsis
Most studies use standard software pipelines for processing and analyzing fMRI data. These pipelines were designed to work with data from 3 Tesla scanners. With more widespread availability of ultra-high field MRI scanners, new processing techniques need to be applied to address the unique demands of high resolution data and to fully take advantage of the high spatial specificity. Here, we propose a novel approach for processing and analysing high resolution resting state fMRI data.
Introduction
Ultra high resolution magnetic resonance imaging (MRI) offers much finer resolution and therefore better insight into anatomical and functional brain mechanisms than regularly used lower magnetic fields¹. While 3T scanners usually collect functional images at a resolution of 3mm, 7T MRI can collect whole-brain BOLD fMRI at up to ~1.0 mm isometric. The spatial and temporal specificity that high resolution data can provide is a considerable improvement in neuroimaging and an advantage for conceptual neuroscientific questions to be addressed in humans in vivo. But with higher resolution come new challenges for data processing. While conventional established processing pipelines may be sufficient for analyzing 3T data, these may turn out to be disadvantageous for higher resolution images due to different data demands and characteristics. Precise inter-subject alignment and limited spatial smoothing are crucial in order to take advantage of the anatomically specific information that high resolution data can provide at the group level. Indeed, some of the highest resolution studies only perform single-subject analyses²·³ to bypass this problem. Here we propose an optimized framework approach to process and analyze 7T fMRI data across subjects that utilizes advanced processing tools and tailors processing to the specific requirements of different brain regions.Methods
Pipeline development was conducted within the context of an ongoing experiment assessing longitudinal changes in resting state fMRI during motor learning. For the purposes of the current study, we processed data from two consecutive days of learning (days 1 and 2). We acquired resting-state BOLD fMRI, GRE field maps, and MP2RAGE anatomical images for 40 healthy volunteers (22 females) on a Siemens 7 Tesla scanner with a 32-channel Nova head coil with the following parameters:
Resting-state scans: voxel dimensions=1.2x1.2x1.2mm, 512 whole brain volumes, FOV=192×192 mm², slice thickness=1mm, 102 slices, TR=1130 ms, TE=22ms, flip angle=40°, bandwidth=1562 Hz/Px.
MP2RAGE: voxel dimensions=0.7x0.7x0.7mm, FOV=224×224x240mm³, TR=5000ms, TE=2.45ms, flip angle 1=5°, flip angle 2=3°, bandwidth=250 Hz/Px
Fieldmaps: voxel dimensions=0.6x0.6x0.6mm, FOV=192×192mm², slice thickness=0.6mm, 265 slices, TR=29ms, TE1=8.16 ms, TE 2=18.35ms, flip angle=11°, bandwidth 1=250 Hz/Px, bandwidth2=250 Hz/Px
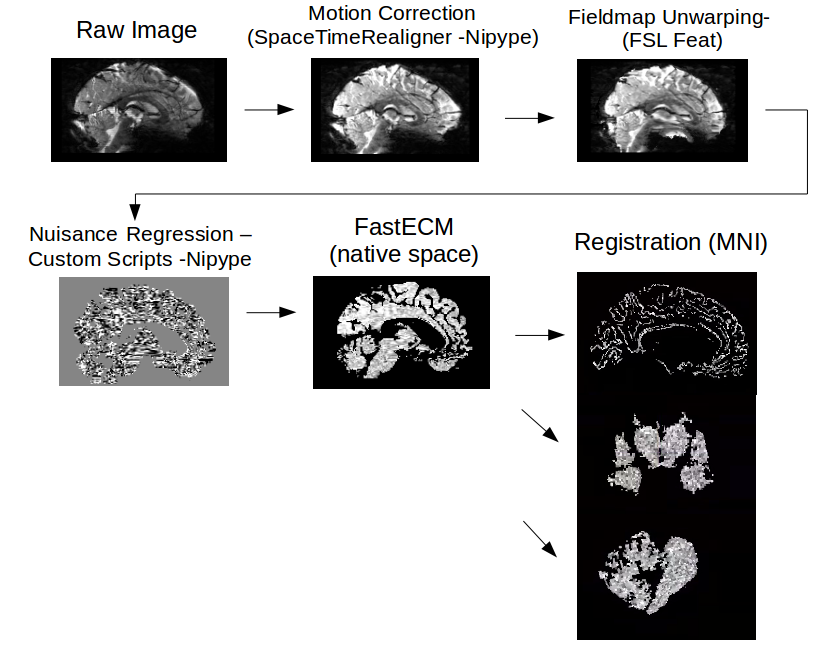
To account for the different processing demands of different regions, the analysis was split into three parts: cortical, sub-cortical, and cerebellar and brainstem.
Preprocessing: Up until coregistration, all data was processed the same way in native space with custom Nipype scripts⁴ and CBSTools⁵ (Figure 1). For resting state connectivity analyses, we used the fast Eigenvector Centrality Mapping (fastECM) algorithm⁶ to calculate centrality parameters for each individual in native space. In order to maintain high anatomical specificity, the cerebellar and sub-cortical data were coregistered using ANTs’ SyN algorithm⁷. Cortical data was registered using MMSR⁸ to ensure overlap of the outer cortex in group space. Hence, allowing for more nuanced interpretation of the results due to smaller, more precise clusters. To preserve maximal spatial precision, smoothing was limited to 1.2mm FWHM in all three sub-analyses.
Results and Discussion
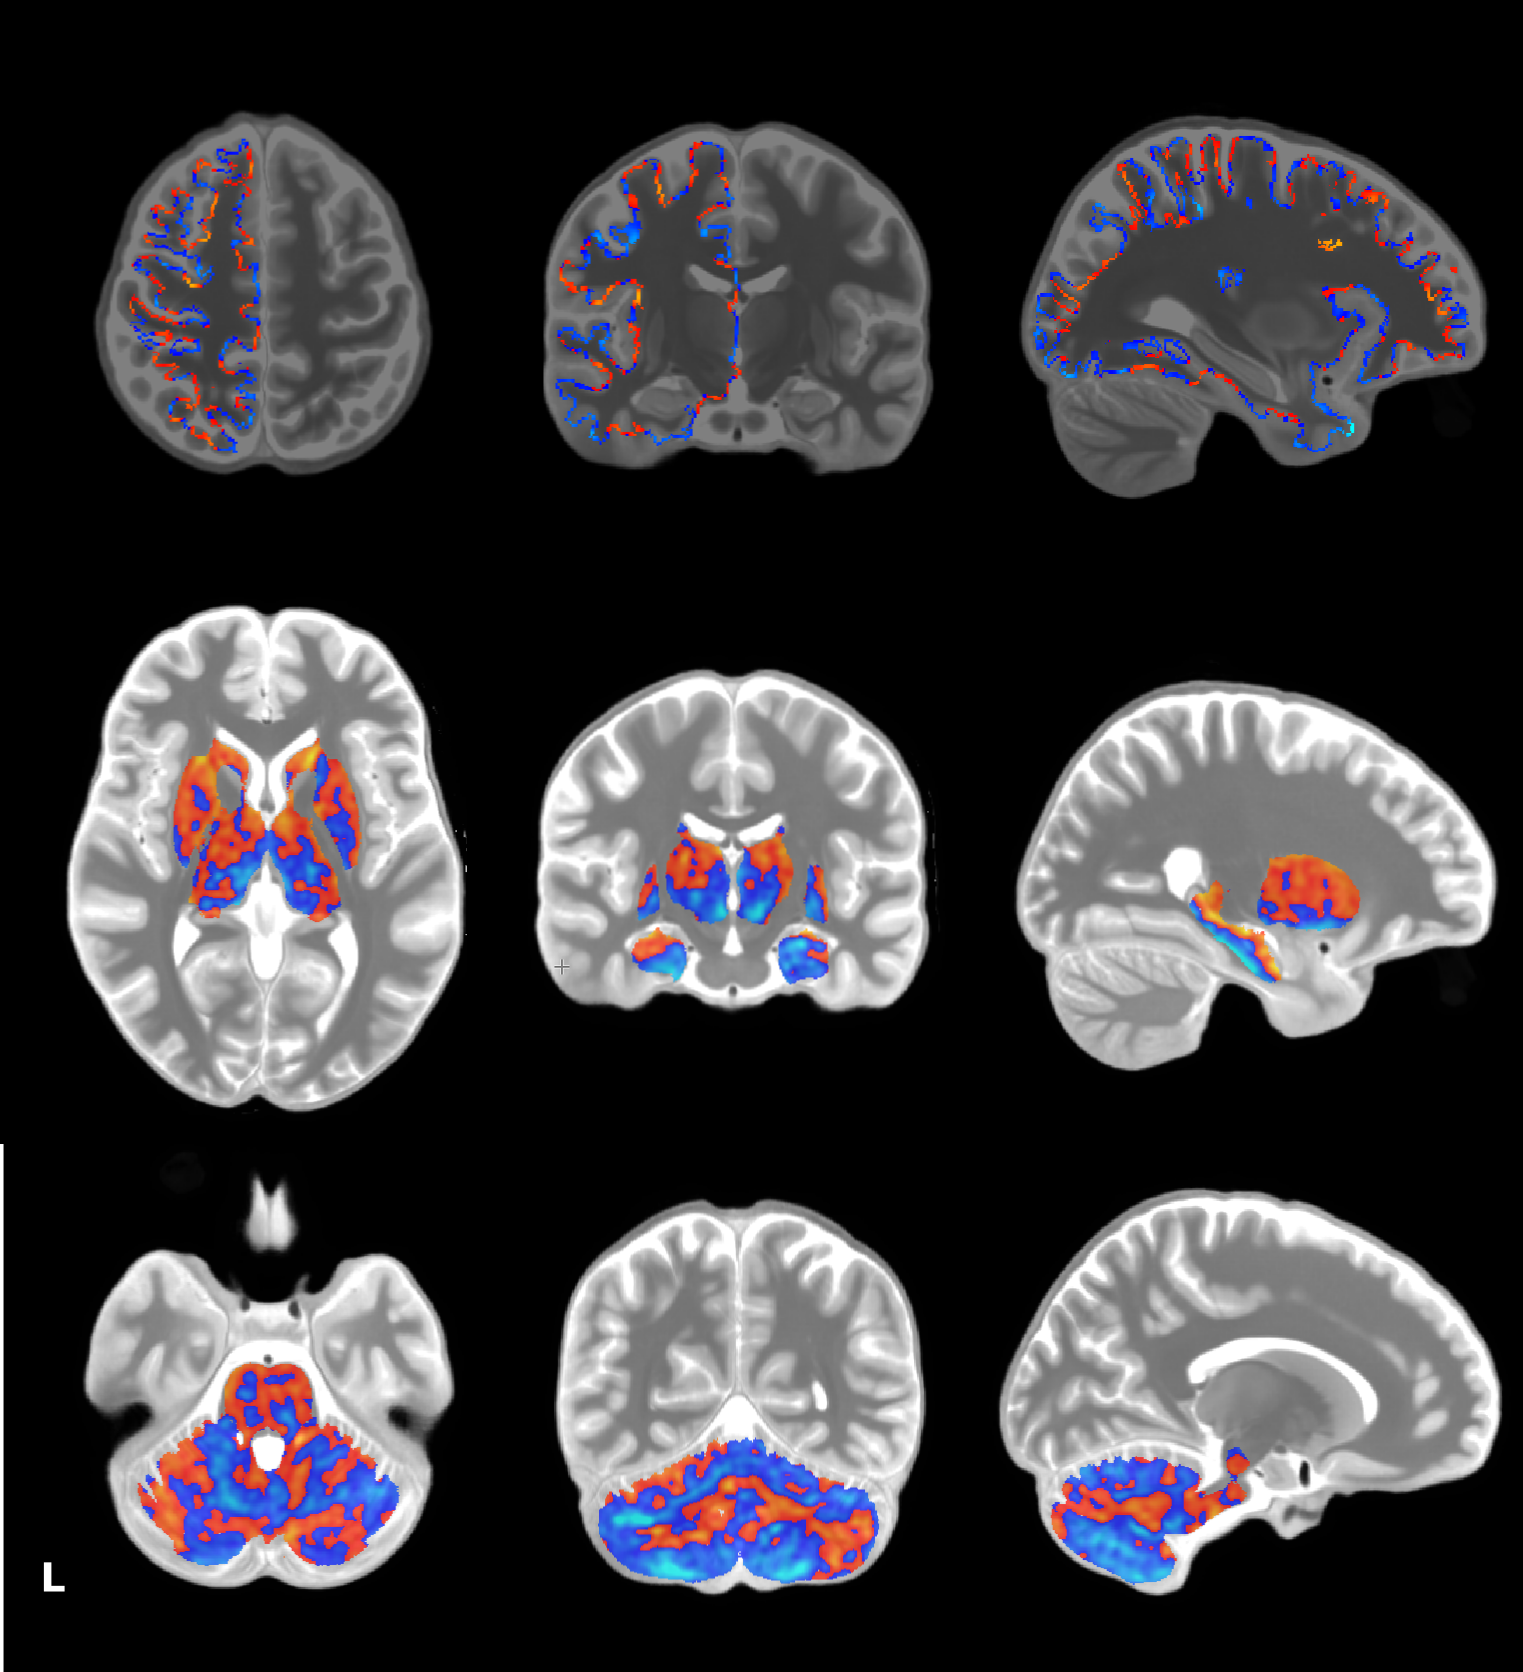
The proposed pipeline yielded highly spatially specific results on a whole brain level. The categorical region registration led to tight overlap of individual datasets, making extensive smoothing unnecessary. While studies investigating resting state connectivity often display results with low anatomical specificity, we were able to show results that can easily be associated with precise anatomical regions, as shown in Figure 2. Our results also highlight the necessity of splitting the analysis into sub analyses as tight registration could not be achieved in all three regions with the same tools. Interestingly, registration of the cerebellar data across subjects seemed to provide the most successful alignment with ANTs’ Syn algorithm compared to the subcortex, while cortical data required additional steps with MMSR.Conclusions
In order to gain new insights into neuroscientific questions from the spatial specificity that high resolution data can provide, advanced processing techniques need to be employed. As demonstrated in Figure 2, significant clusters are more focused than resting state connectivity images usually depicted in the neuroscience literature. We suggest the use of ANTs’ SyN algorithm for registration of regions that are not high in individual anatomical variability (subcortex/cerebellum/brainstem) and the MMSR algorithm for gray matter cortical data to yield good overlap of individual datasets on a group level. Furthermore, we recommend limited smoothing of high resolution data to preserve as much anatomically specific information as possible.Acknowledgements
No acknowledgement found.References
1. De Martino, F., Esposito, F., van de Moortele, P.-F., Harel, N., Formisano, E., Goebel, R., … Yacoub, E. (2011). Whole brain high-resolution functional imaging at ultra high magnetic fields: An application to the analysis of resting state networks. NeuroImage, 57(3), 1031–1044.
2. Fracasso, A., Luijten, P. R., Dumoulin, S. O., & Petridou, N. (2017). Laminar imaging of positive and negative BOLD in human visual cortex at 7T. NeuroImage.
3. Gonzalez-Castillo, J., Hoy, C. W., Handwerker, D. A., Roopchansingh, V., Inati, S. J., Saad, Z. S., … Bandettini, P. A. (2015). Task Dependence, Tissue Specificity, and Spatial Distribution of Widespread Activations in Large Single-Subject Functional MRI Datasets at 7T. Cerebral Cortex (New York, N.Y.: 1991), 25(12), 4667–4677.
4.Gorgolewski K, Burns CD, Madison C, Clark D, Halchenko YO, Waskom ML, Ghosh SS. (2011). Nipype: a flexible, lightweight and extensible neuroimaging data processing framework in Python. Front. Neuroinform. 5:13.
5. Bazin, P.-L., Weiss, M., Dinse, J., Schäfer, A., Trampel, R., Turner, R., 2014. A computational framework for ultra-high resolution cortical segmentation at 7Tesla. NeuroImage 93, 201–209. doi:10.1016/j.neuroimage.2013.03.077
6. Wink, A. M., Munck, J. C., Werf, Y. D., Heuvel, O. A., & Barkhof, F. (2012). Fast Eigenvector Centrality Mapping of Voxel-Wise Connectivity in Functional Magnetic Resonance Imaging: Implementation, Validation, and Interpretation. Brain Connectivity, 2(5), 265-274.
7. Avants, B.B., Epstein, C.L., Grossman, M., Gee, J.C., 2008. Symmetric diffeomorphic image registration with cross-correlation: Evaluating automated labeling of elderly and neurodegenerative brain. Medical Image Analysis 12, 26–41.
8. Tardif, C. L., Schäfer, A., Waehnert, M., Dinse, J., Turner, R., & Bazin, P.-L. (2015). Multi-contrast multi-scale surface registration for improved alignment of cortical areas. NeuroImage, 111, 107–122.
Figures