2394
Regression does not Eliminate the Effects of Nuisance terms in Dynamic Functional Connectivity Estimates1UCSD Center for Functional MRI, La Jolla, CA, United States
Synopsis
Nuisance regression is commonly used in dynamic functional connectivity (DFC) studies to reduce the influence of nuisance factors, such as head motion or physiological activity. Here, we show that DFC estimates before nuisance regression are significantly correlated with the norms of various nuisance terms. Furthermore, we find that nuisance regression does not eliminate the correlations between DFC estimates and the nuisance norms.
Introduction
In dynamic functional connectivity (DFC) fMRI, temporal variations in fMRI-based connectivity measures are used to investigate the temporal dynamics of brain function.1,2,3 Sliding-window correlations, computed across fMRI time series from different brain regions, are widely used as DFC estimates.1 Recently, it was argued that nuisance effects might contaminate DFC estimates and could masquerade as functional information.1,3 However, it is not known whether the nuisance removal techniques used in most DFC studies can eliminate the effects of nuisance terms. In this work, we show that the DFC estimates are highly related to nuisance measurements. Furthermore, we show that nuisance regression does not remove nuisance effects from DFC estimates.Methods
To understand the effect of nuisance factors, such as the global signal (GS), white matter (WM), cerebrospinal fluid (CSF) and head motion (HM), on the DFC estimates, we analyzed the data in,4 acquired from 68 resting-state scans (TR=2.16s, 4x4x4 mm, duration 6.6 minutes). We performed standard pre-processing steps described in5 (except for GS, WM+CSF and HM regression) to produce a set of uncorrected data. We obtained DFC estimates by computing sliding-window correlations between pairs of time courses from the posterior cingulate cortex (PCC), intra-parietal sulcus (IPS), frontal eye fields (FEF), and motor network (MOT), using a window size of 30 TRs (63 seconds with a window-shift of 2.16 seconds).
For comparison to DFC estimates, we computed sliding-window norms of the GS, WM+CSF and HM time courses. For nuisance measurements with multiple time courses (e.g. HM and WM+CSF), we summed the norms of multiple measurements to obtain a single nuisance time course. We separately performed GS, WM+CSF and HM regression on the uncorrected data, using either (1) full linear regression or (2) block regression to obtain 6 additional `cleaned’ versions of the uncorrected data. In block regression, nuisance regression is performed on each window separately, as opposed to over the full time series as in full regression. We compared the nuisance norms to (1) uncorrected DFC estimates, (2) DFC estimates after full regression and (3) DFC estimates after block regression.
Results
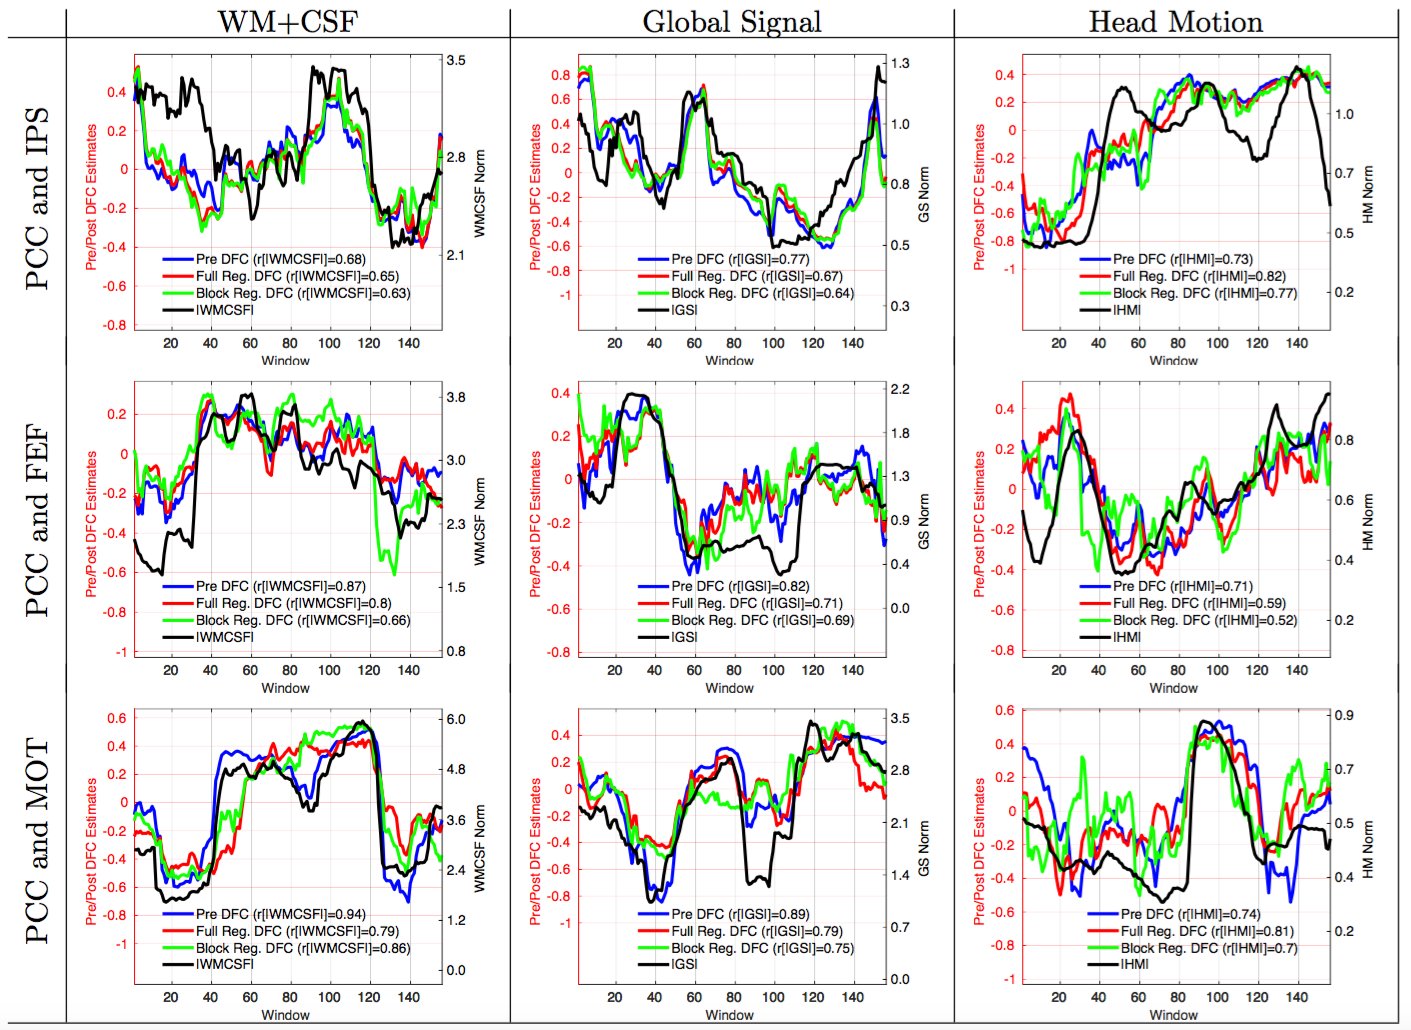
In Figure 1, we show the DFC estimates and the nuisance norms from 9 representative scans. The row labels indicate the pairs of seed regions, and the column labels indicate the type of nuisance term. The correlations between the nuisance norm and the uncorrected DFC estimates (Pre DFC, blue line) were significant $$$(p<10^{−6})$$$ and ranged from $$$r=0.68$$$ to $$$r=0.94$$$. This indicates a large contamination of the DFC estimates by the nuisance terms. Performing either full (red line) or block regression (green line) did not eliminate the relationship between the nuisance norm and DFC estimates. The correlations after full regression ranged from $$$r=0.59$$$ to $$$r=0.82$$$, and correlations after block regression ranged from $$$r=0.52$$$ to $$$r=0.86$$$.
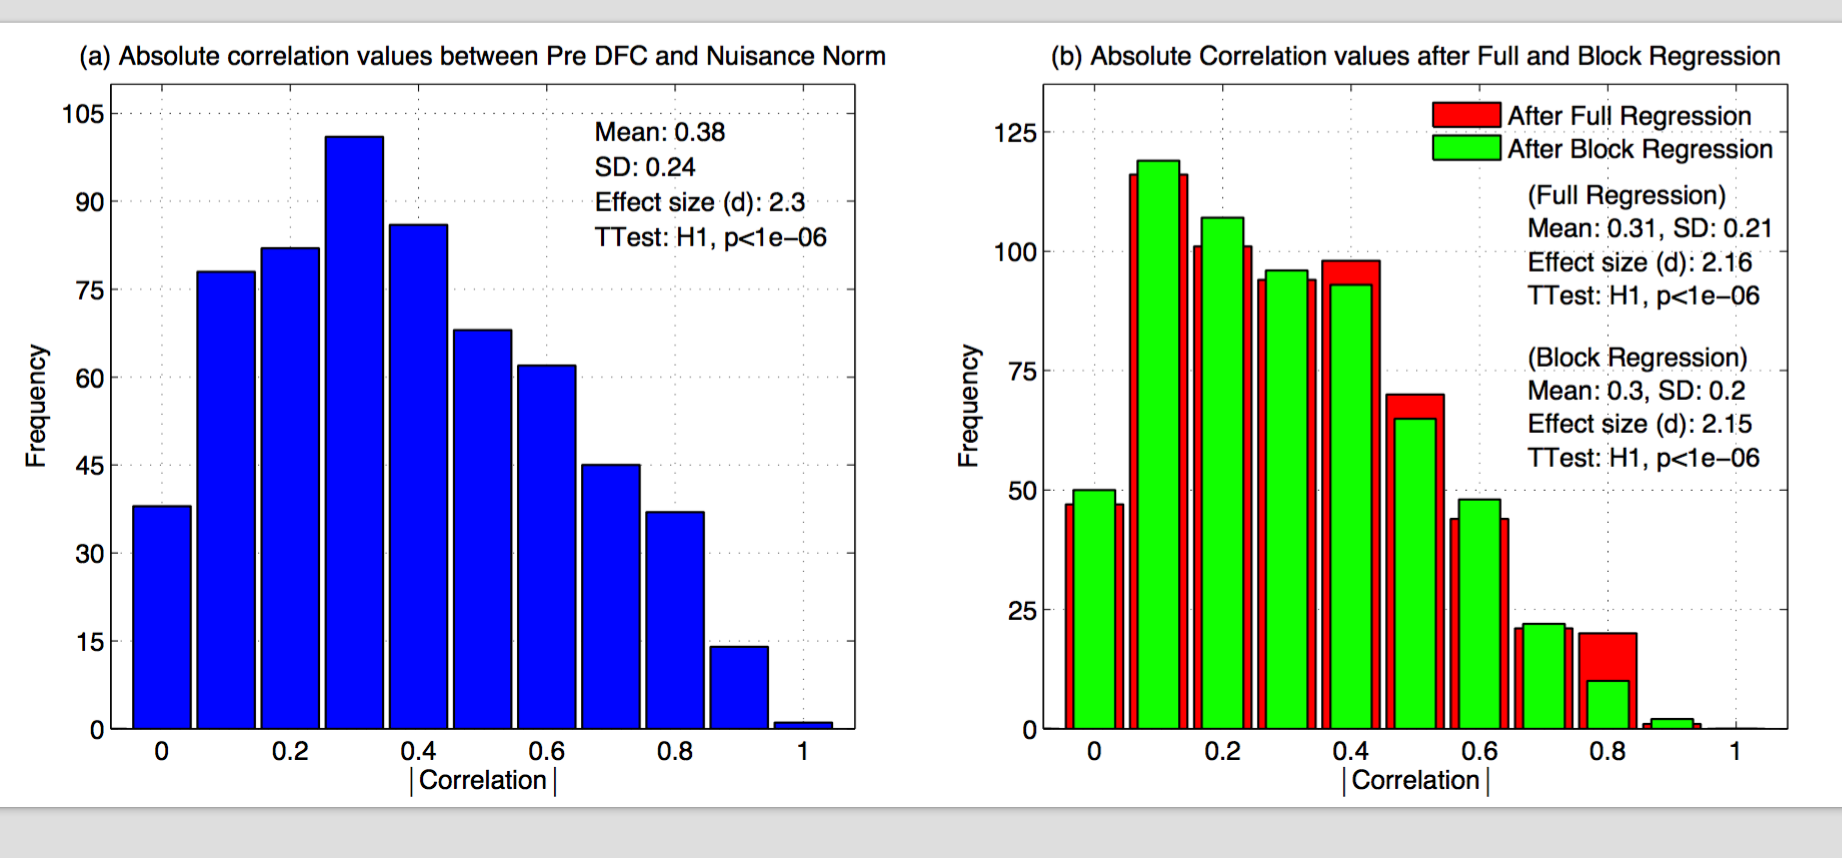
In Figure 2, we show histograms of absolute correlation values between the DFC estimates and the nuisance norms, computed across all scans, seeds and nuisance measurements. In (a) and (b), the absolute correlations between nuisance norms and the before and after regression DFC estimates were significantly greater than zero $$$(p<10^{−6})$$$. Overall, 76% of the uncorrected DFC estimates were significantly correlated with the nuisance norm. After full and block regression, 72% of the DFC estimates obtained with each regression method (e.g. full or block) were significantly correlated with the nuisance norm.
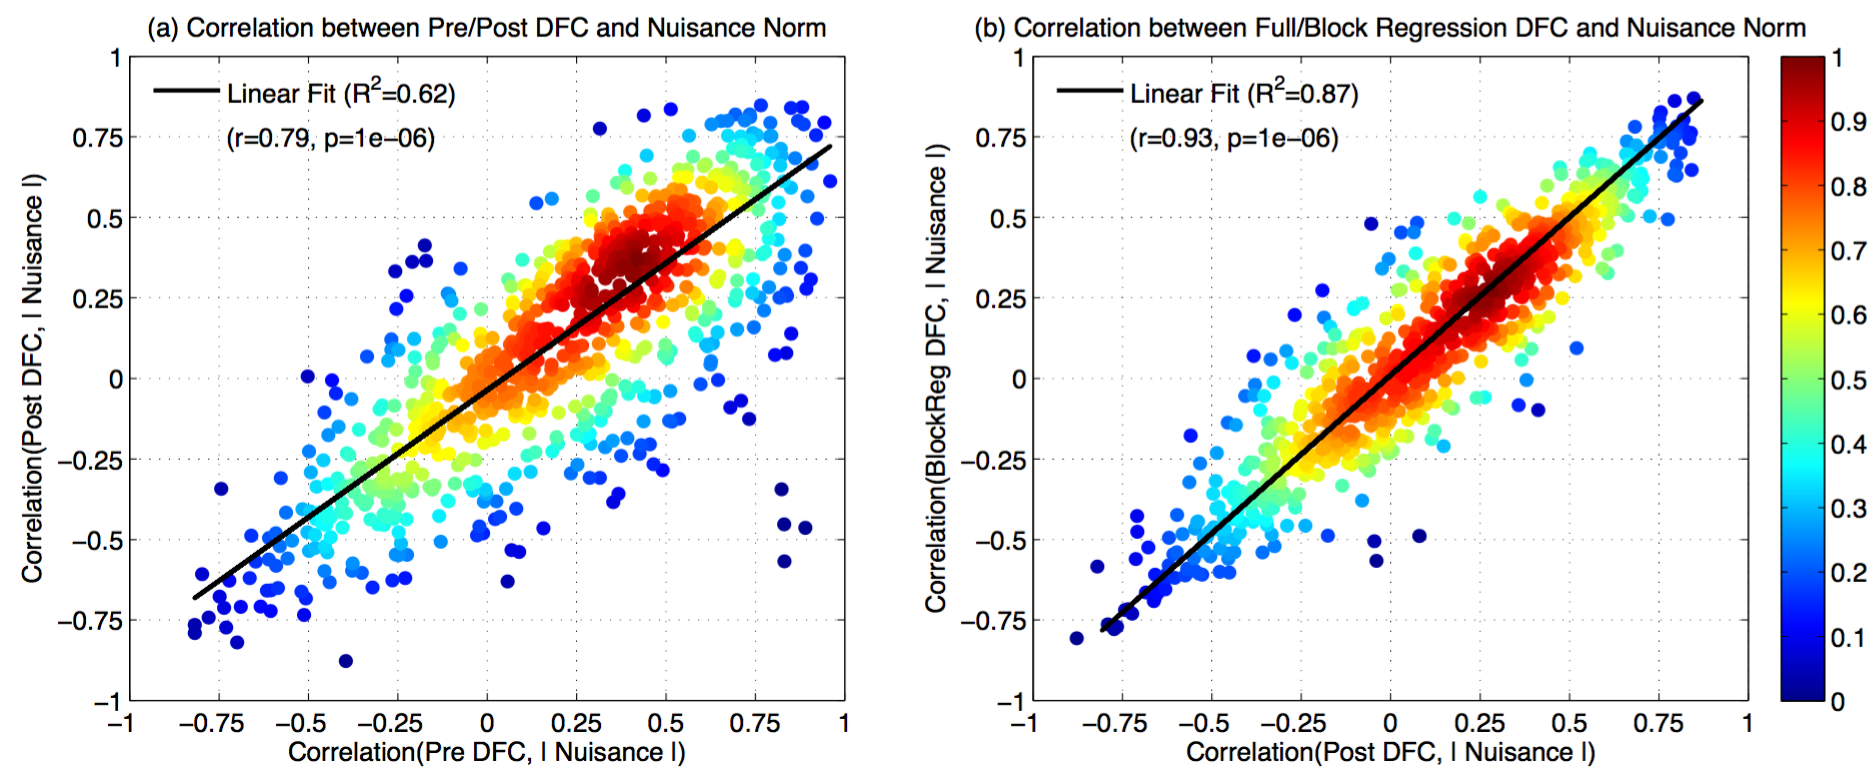
In Figure 3 (a), we show that there is a strong linear relationship ($$$R^2=0.62$$$) between the correlations obtained between the Pre DFC estimates and nuisance norms versus the correlations obtained between the Post DFC (after full regression) estimates and nuisance norms. In Figure 3 (b), we show that the correlations between the DFC estimates and the nuisance norms after block regression and after full regression were not significantly different (paired t-test; $$$p=0.98$$$).
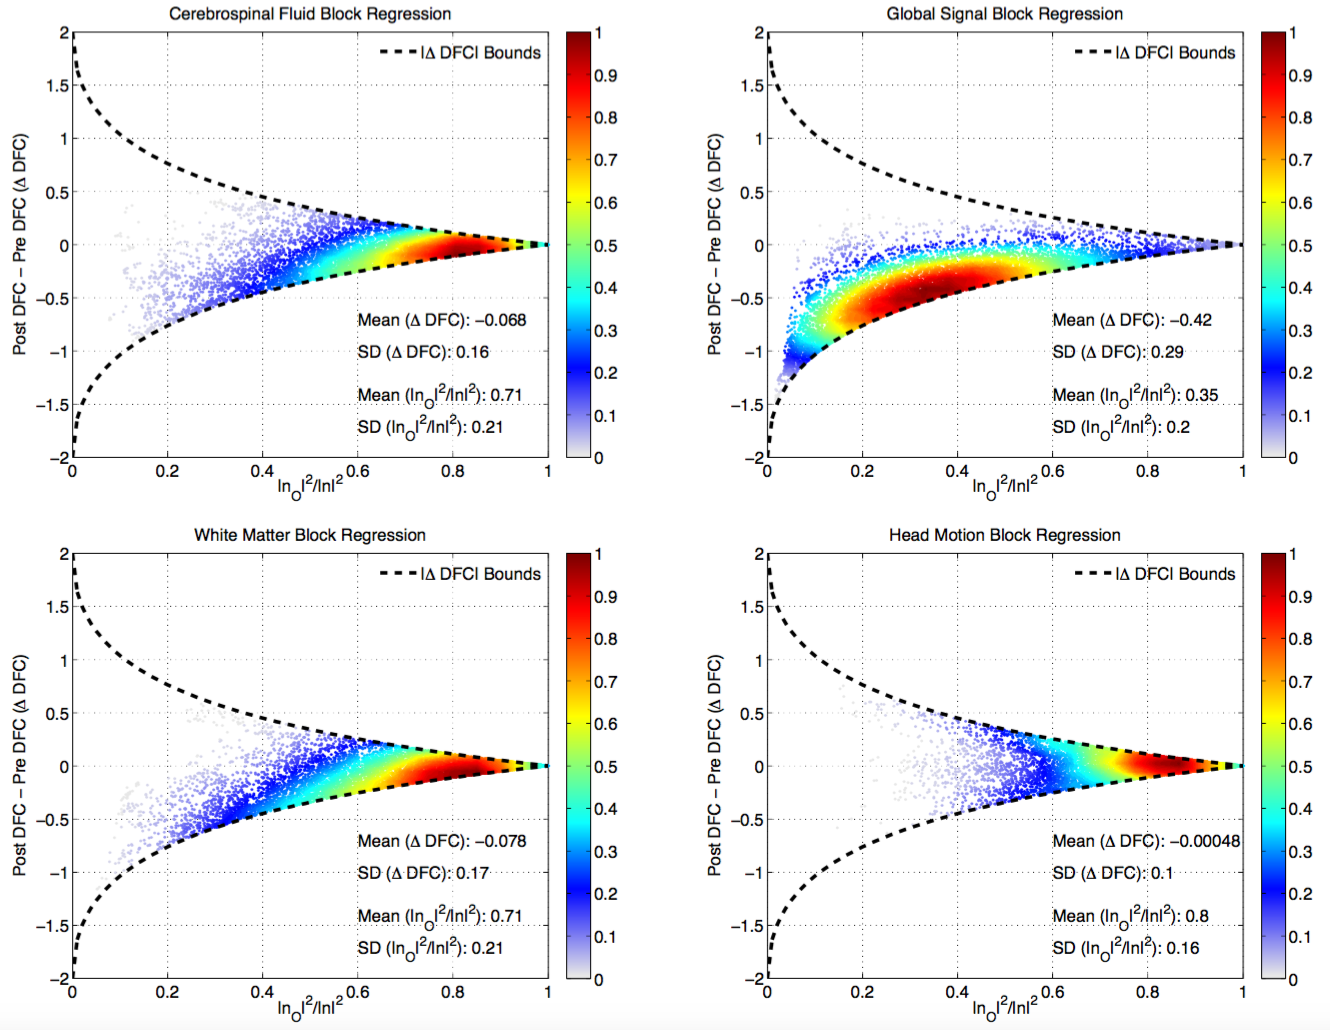
In Figure 4, we show that the difference $$$\Delta DFC=\tilde{r}-r$$$ between post regression DFC estimates and uncorrected DFC estimates can be bounded by theoretically derived curves. For WM, CSF, and HM nuisance terms, the narrow width of the bounds is consistent with the similarity between the pre and post regression DFC estimates.
Discussion
We have shown that DFC estimates are largely contaminated by
various nuisance factors, and canonical nuisance removal techniques do not
remove this contamination. This important finding suggest that care must be
taken when interpreting results of DFC studies, and raises questions about the
use of regression based techniques in sliding-window DFC analysis methods.
Acknowledgements
This work was supported in part by R21MH112155References
1. Hutchison RM, et al. Dynamic functional connectivity: promise, issues, and interpretations. Neuroimage. 2013;80:360-78.
2. Sakoglu U, et al. A method for evaluating dynamic functional network connectivity and task-modulation: application to schizophrenia. Magnetic Resonance Materials in Physics, Biology and Medicine. 2010;23:351-366
3. Leonardi N, et al. On spurious and real fluctuations of dynamic functional connectivity during rest. Neuroimage. 2015;104:430-6.
4. Fox MD, et al. Intrinsic fluctuations within cortical systems account for intertrial variability in human behavior. Neuron. 2007;56(1):171-84.
5. He H, et al. A geometric view of global signal confounds in resting-state functional MRI. Neuroimage. 2012;59(3):2339-48.
Figures